1960 United States presidential election in Mississippi
| |||||||||||||||||||||||||||||||||
| |||||||||||||||||||||||||||||||||
| |||||||||||||||||||||||||||||||||
| Elections in Mississippi |
|---|
 |
The 1960 United States presidential election in Mississippi took place on November 8, 1960, as part of the 1960 United States presidential election. Voters chose eight representatives, or electors to the Electoral College, who voted for president and vice president. This was the last election in which Mississippi had eight electoral votes: the Great Migration of Black Americans caused the state to lose congressional districts for the third time in four censuses before the next election.
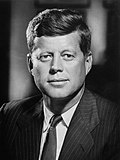
The election saw the only case of a state being carried by a slate of unpledged electors. Mississippi voted narrowly for this slate, who voted unanimously for long-time Virginia Senator and political machine director Harry Flood Byrd, over the national Democratic nominee, Senator John F. Kennedy of Massachusetts. Republican nominee and outgoing Vice President Richard Nixon, from California, came in third, with his percentage of the vote practically unchanged from what outgoing President Dwight D. Eisenhower recorded in 1956.
Governor Ross Barnett, a segregationist, was faced with a severe dilemma upon becoming governor at the beginning of the year owing to the rigid opposition of Mississippi’s limited and almost exclusively White electorate[1] to the active Civil Rights Movement. Pressured by the "Citizens' Council" who wished to unite the South behind a White-supremacist Democratic candidate,[2] Governor Barnett repeated James P. Coleman’s strategy from 1956 and nominated two sets of Democratic Party electors for the presidential ballot.[3] The first slate was pledged to Kennedy, while the other was not pledged to any candidate. The aim of placing unpledged electors on the ballot was to gain leverage from either major party in a close election,[3] with the possibility of the House of Representatives electing a candidate more favourable to opponents of Brown v. Board of Education than either national major party nominee.[4]
Because the civil rights movement’s supporters regarded Kennedy’s record as poor on this issue, Senators John C. Stennis and James Eastland supported his candidacy, although state-level politicians were not at all supportive.[5] The state’s media saw a vigorous debate between the loyalist and unpledged Democrats in the week before the election.[6] Outside heavily French-settled Hancock County, which has greater cultural ties with Louisiana than with most of the rest of Mississippi, Kennedy’s Catholic faith was also considered suspect.[7]
Polls
[edit]| Source | Ranking | As of |
|---|---|---|
| The Philadelphia Inquirer[8] | Tilt I (Flip) | October 3, 1960 |
| Knoxville News Sentinel[9] | Tossup | October 23, 1960 |
| Daily News[10] | Likely D | October 28, 1960 |
| The Daily Item[11] | Tilt D | November 4, 1960 |
| The Clarion-Ledger[12] | Tilt D | November 7, 1960 |
| Hattiesburg American[13] | Lean D | November 7, 1960 |
Results
[edit]The following slates were nominated for the November general election:[14]
Electoral slates
[edit]| Unpledged electors State Democratic Party |
John F. Kennedy and Lyndon B. Johnson National Democratic Party |
Richard Nixon and Henry Cabot Lodge Jr. Republican Party |
|---|---|---|
| Henry Harris George Payne Cossar Charles L. Sullivan Clay B. Tucker Earl Evans Jr. Bob Buntin D. M. Nelson Lawrence Y. Foote |
Frank K. Hughes David E. Guyton Will M. Whittington Frank E. Shanahan Jr. Martin V. B. Miller Edward H. Stevens Curtis H. Mullen Lovie Gore |
John M. Kaye Ralph O. White J. H. Snyder J. J. Newman George W. Shaw C. E. Tolar Noel Womack Jr. J. B. Snyder |
General election results
[edit]| 1960 United States presidential election in Mississippi[15] | |||||
|---|---|---|---|---|---|
| Party | Candidate | Votes | Percentage | Electoral votes | |
| Unpledged Electors | — | 116,248 | 38.99% | 8 | |
| Democratic | John F. Kennedy | 108,362 | 36.34% | 0 | |
| Republican | Richard Nixon | 73,561 | 24.67% | 0 | |
| Totals | 298,171 | 100.00% | 8 | ||
Results by county
[edit]| County | Unpledged Electors Democratic |
John F. Kennedy Democratic |
Richard Nixon Republican |
Margin | Total votes cast | ||||
|---|---|---|---|---|---|---|---|---|---|
| # | % | # | % | # | % | # | % | ||
| Adams | 2,526 | 48.53% | 1,452 | 27.90% | 1,227 | 23.57% | 1,074 | 20.63% | 5,205 |
| Alcorn | 601 | 13.43% | 3,054 | 68.25% | 820 | 18.32% | 2,234[a] | 49.93% | 4,475 |
| Amite | 1,655 | 72.72% | 338 | 14.85% | 283 | 12.43% | 1,317 | 57.87% | 2,276 |
| Attala | 1,281 | 39.20% | 1,337 | 40.91% | 650 | 19.89% | -56 | -1.71% | 3,268 |
| Benton | 348 | 31.90% | 568 | 52.06% | 175 | 16.04% | -220 | -20.16% | 1,091 |
| Bolivar | 1,638 | 43.46% | 1,119 | 29.69% | 1,012 | 26.85% | 519 | 13.77% | 3,769 |
| Calhoun | 1,299 | 53.09% | 765 | 31.26% | 383 | 15.65% | 534 | 21.83% | 2,447 |
| Carroll | 840 | 57.07% | 425 | 28.87% | 207 | 14.06% | 415 | 28.20% | 1,472 |
| Chickasaw | 1,362 | 53.66% | 791 | 31.17% | 385 | 15.17% | 571 | 22.49% | 2,538 |
| Choctaw | 584 | 35.48% | 817 | 49.64% | 245 | 14.88% | -233 | -14.16% | 1,646 |
| Claiborne | 651 | 62.84% | 205 | 19.79% | 180 | 17.37% | 446 | 43.05% | 1,036 |
| Clarke | 1,478 | 44.68% | 1,244 | 37.61% | 586 | 17.71% | 234 | 7.07% | 3,308 |
| Clay | 1,295 | 54.60% | 626 | 26.39% | 451 | 19.01% | 669 | 28.21% | 2,372 |
| Coahoma | 1,385 | 35.82% | 1,386 | 35.84% | 1,096 | 28.34% | -1 | -0.02% | 3,867 |
| Copiah | 1,957 | 54.15% | 896 | 24.79% | 761 | 21.06% | 1,061 | 29.36% | 3,614 |
| Covington | 985 | 44.81% | 842 | 38.31% | 371 | 16.88% | 143 | 6.50% | 2,198 |
| DeSoto | 734 | 35.25% | 795 | 38.18% | 553 | 26.56% | -61 | -2.93% | 2,082 |
| Forrest | 3,152 | 36.52% | 2,068 | 23.96% | 3,412 | 39.53% | 260[b] | 3.01% | 8,632 |
| Franklin | 1,115 | 66.37% | 441 | 26.25% | 124 | 7.38% | 674 | 40.12% | 1,680 |
| George | 917 | 44.28% | 844 | 40.75% | 310 | 14.97% | 73 | 3.53% | 2,071 |
| Greene | 781 | 49.49% | 550 | 34.85% | 247 | 15.65% | 231 | 14.64% | 1,578 |
| Grenada | 1,132 | 48.31% | 529 | 22.58% | 682 | 29.11% | 450[b] | 19.20% | 2,343 |
| Hancock | 502 | 14.97% | 2,132 | 63.58% | 719 | 21.44% | 1,413[a] | 42.14% | 3,353 |
| Harrison | 2,621 | 15.64% | 8,961 | 53.47% | 5,177 | 30.89% | 3,784[a] | 22.58% | 16,759 |
| Hinds | 12,094 | 41.72% | 5,811 | 20.05% | 11,083 | 38.23% | 1,011[b] | 3.49% | 28,988 |
| Holmes | 1,484 | 57.81% | 628 | 24.46% | 455 | 17.72% | 856 | 33.35% | 2,567 |
| Humphreys | 732 | 51.48% | 459 | 32.28% | 231 | 16.24% | 273 | 19.20% | 1,422 |
| Issaquena | 181 | 42.79% | 178 | 42.08% | 64 | 15.13% | 3 | 0.71% | 423 |
| Itawamba | 653 | 23.57% | 1,752 | 63.23% | 366 | 13.21% | -1,099 | -39.66% | 2,771 |
| Jackson | 1,908 | 20.80% | 5,000 | 54.50% | 2,266 | 24.70% | 2,734[a] | 29.80% | 9,174 |
| Jasper | 926 | 38.03% | 1,147 | 47.10% | 362 | 14.87% | -221 | -9.07% | 2,435 |
| Jefferson | 728 | 66.54% | 229 | 20.93% | 137 | 12.52% | 499 | 45.61% | 1,094 |
| Jefferson Davis | 988 | 57.34% | 510 | 29.60% | 225 | 13.06% | 478 | 27.74% | 1,723 |
| Jones | 2,928 | 27.81% | 4,871 | 46.27% | 2,729 | 25.92% | -1,943 | -18.46% | 10,528 |
| Kemper | 587 | 34.31% | 931 | 54.41% | 193 | 11.28% | -344 | -20.10% | 1,711 |
| Lafayette | 909 | 31.11% | 1,308 | 44.76% | 705 | 24.13% | -399 | -13.65% | 2,922 |
| Lamar | 1,046 | 44.83% | 651 | 27.90% | 636 | 27.26% | 395 | 16.93% | 2,333 |
| Lauderdale | 4,154 | 38.66% | 3,755 | 34.95% | 2,836 | 26.39% | 399 | 3.71% | 10,745 |
| Lawrence | 923 | 55.91% | 469 | 28.41% | 259 | 15.69% | 454 | 27.50% | 1,651 |
| Leake | 2,011 | 61.88% | 953 | 29.32% | 286 | 8.80% | 1,058 | 32.56% | 3,250 |
| Lee | 1,438 | 21.65% | 3,653 | 55.01% | 1,550 | 23.34% | 2,103[a] | 31.67% | 6,641 |
| Leflore | 2,112 | 45.51% | 1,212 | 26.12% | 1,317 | 28.38% | 795[b] | 17.13% | 4,641 |
| Lincoln | 2,185 | 44.73% | 1,449 | 29.66% | 1,251 | 25.61% | 736 | 15.07% | 4,885 |
| Lowndes | 1,430 | 30.56% | 1,240 | 26.50% | 2,010 | 42.95% | 580[b] | 12.39% | 4,680 |
| Madison | 1,583 | 55.33% | 753 | 26.32% | 525 | 18.35% | 830 | 29.01% | 2,861 |
| Marion | 1,265 | 41.54% | 1,082 | 35.53% | 698 | 22.92% | 183 | 6.01% | 3,045 |
| Marshall | 700 | 39.22% | 681 | 38.15% | 404 | 22.63% | 19 | 1.07% | 1,785 |
| Monroe | 1,559 | 32.08% | 1,901 | 39.12% | 1,400 | 28.81% | -342 | -7.04% | 4,860 |
| Montgomery | 761 | 38.65% | 623 | 31.64% | 585 | 29.71% | 138 | 7.01% | 1,969 |
| Neshoba | 1,716 | 41.49% | 1,840 | 44.49% | 580 | 14.02% | -124 | -3.00% | 4,136 |
| Newton | 1,956 | 57.94% | 912 | 27.01% | 508 | 15.05% | 1,044 | 30.93% | 3,376 |
| Noxubee | 870 | 58.43% | 277 | 18.60% | 342 | 22.97% | 528[b] | 35.46% | 1,489 |
| Oktibbeha | 1,672 | 48.95% | 915 | 26.79% | 829 | 24.27% | 757 | 22.16% | 3,416 |
| Panola | 1,404 | 48.61% | 841 | 29.12% | 643 | 22.26% | 563 | 19.49% | 2,888 |
| Pearl River | 1,556 | 44.67% | 1,276 | 36.64% | 651 | 18.69% | 280 | 8.03% | 3,483 |
| Perry | 556 | 41.37% | 514 | 38.24% | 274 | 20.39% | 42 | 3.13% | 1,344 |
| Pike | 2,632 | 49.13% | 1,258 | 23.48% | 1,467 | 27.38% | 1,165[b] | 21.75% | 5,357 |
| Pontotoc | 792 | 29.29% | 1,584 | 58.58% | 328 | 12.13% | -792 | -29.29% | 2,704 |
| Prentiss | 468 | 15.68% | 1,777 | 59.53% | 740 | 24.79% | 1,037[a] | 34.74% | 2,985 |
| Quitman | 674 | 43.32% | 583 | 37.47% | 299 | 19.22% | 91 | 5.85% | 1,556 |
| Rankin | 3,114 | 65.12% | 850 | 17.77% | 818 | 17.11% | 2,264 | 47.35% | 4,782 |
| Scott | 1,841 | 53.02% | 1,024 | 29.49% | 607 | 17.48% | 817 | 23.53% | 3,472 |
| Sharkey | 431 | 42.80% | 263 | 26.12% | 313 | 31.08% | 118[b] | 11.72% | 1,007 |
| Simpson | 1,568 | 48.88% | 1,034 | 32.23% | 606 | 18.89% | 534 | 16.65% | 3,208 |
| Smith | 1,025 | 34.79% | 1,568 | 53.22% | 353 | 11.98% | -543 | -18.43% | 2,946 |
| Stone | 818 | 56.96% | 343 | 23.89% | 275 | 19.15% | 475 | 33.07% | 1,436 |
| Sunflower | 1,241 | 35.96% | 1,033 | 29.93% | 1,177 | 34.11% | 64[b] | 1.85% | 3,451 |
| Tallahatchie | 1,421 | 54.72% | 830 | 31.96% | 346 | 13.32% | 591 | 22.76% | 2,597 |
| Tate | 845 | 47.69% | 686 | 38.71% | 241 | 13.60% | 159 | 8.98% | 1,772 |
| Tippah | 467 | 16.15% | 1,939 | 67.05% | 486 | 16.80% | 1,453[a] | 50.25% | 2,892 |
| Tishomingo | 669 | 27.56% | 1,222 | 50.35% | 536 | 22.08% | -553 | -22.79% | 2,427 |
| Tunica | 240 | 26.76% | 323 | 36.01% | 334 | 37.24% | -11[a] | -1.23% | 897 |
| Union | 689 | 20.91% | 2,001 | 60.73% | 605 | 18.36% | -1,312 | -39.82% | 3,295 |
| Walthall | 1,082 | 50.58% | 747 | 34.92% | 310 | 14.49% | 335 | 15.66% | 2,139 |
| Warren | 2,021 | 30.68% | 2,289 | 34.75% | 2,277 | 34.57% | 12[a] | 0.18% | 6,587 |
| Washington | 1,258 | 18.90% | 3,105 | 46.66% | 2,292 | 34.44% | 813[a] | 12.22% | 6,655 |
| Wayne | 1,036 | 46.39% | 707 | 31.66% | 490 | 21.94% | 329 | 14.73% | 2,233 |
| Webster | 1,174 | 57.95% | 553 | 27.30% | 299 | 14.76% | 621 | 30.65% | 2,026 |
| Wilkinson | 832 | 68.09% | 216 | 17.68% | 174 | 14.24% | 616 | 50.41% | 1,222 |
| Winston | 1,505 | 50.74% | 1,056 | 35.60% | 405 | 13.65% | 449 | 15.14% | 2,966 |
| Yalobusha | 704 | 36.99% | 650 | 34.16% | 549 | 28.85% | 54 | 2.83% | 1,903 |
| Yazoo | 1,847 | 55.30% | 715 | 21.41% | 778 | 23.29% | 1,069[b] | 32.01% | 3,340 |
| Totals | 116,248 | 38.99% | 108,362 | 36.34% | 73,561 | 24.67% | 7,886 | 2.65% | 298,171 |
Analysis
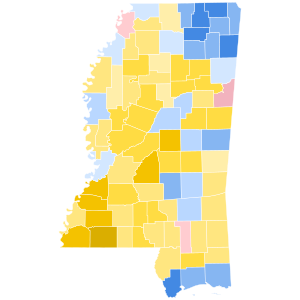
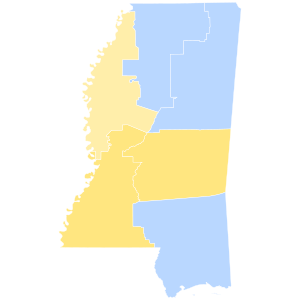
[edit]In the coastal counties, Kennedy improved considerably upon what Adlai Stevenson II achieved in 1956, but except for those counties around the cities of Natchez and Vicksburg, Kennedy otherwise showed a major decline from the Democratic result in 1956.[7] Kennedy held up best in the poor White upcountry counties that had historically been much more anti-Catholic than the Black Belt,[16] suggesting that voters throughout the state had become more suspicious of the Democrats’ civil rights policies. Since the Republican percentage of the vote essentially failed to change – Nixon lost Hancock to Kennedy and Adams and Warren to the unpledged slate but picked up Tunica and Lowndes Counties – the unpledged slate took almost all of Kennedy’s lost votes and thus shaded him for the state overall.
Despite Kennedy’s statewide defeat being only the second for a national Democrat in Mississippi since Reconstruction, this remains the last election when the coastal, French-influenced counties of Harrison and Jackson have voted for a Democratic presidential nominee.[17] The following landlocked counties have also never voted Democratic since: Choctaw, Jones and Smith.[17] Warren County would not vote Democratic again until Barack Obama won it in 2012.[18]
Notes
[edit]- ^ a b c d e f g h i j In this county where the unpledged slate did finish third behind both Kennedy and Nixon, margin given is Kennedy vote minus Nixon vote and percentage margin Kennedy percentage minus Nixon percentage.
- ^ a b c d e f g h i j In this county where Kennedy ran third behind both Nixon and the unpledged slate, margin given is Nixon vote minus unpledged vote and percentage margin Nixon percentage minus unpledged percentage.
References
[edit]- ^ See Bullock, Charles S.; Gaddie, Ronald Keith. The Triumph of Voting Rights in the South. pp. 31–33. ISBN 0806185309.
- ^ McMillen, Neil R. The Citizens' Council: Organized Resistance to the Second Reconstruction, 1954-64. p. 333. ISBN 0252064410.
- ^ a b Crespino, Joseph. In Search of Another Country: Mississippi and the Conservative Counterrevolution. pp. 35–36. ISBN 0691122091.
- ^ Hills, Charles M. (October 11, 1960). "Barnett's Colonels Hear Elector Plan". Clarion-Ledger. Jackson, Mississippi. pp. 1, 6.
- ^ Bolton, Charles C. William F. Winter and the New Mississippi: A Biography. p. 113. ISBN 1617037877.
- ^ "Loyalist, Unpledged Slug Away on Television". Enterprise-Journal. McComb, Mississippi. November 3, 1960. p. 7.
- ^ a b Menendez, Albert J. The Religious Factor in the 1960 Presidential Election: An Analysis of the Kennedy Victory over Anti-Catholic Prejudice. pp. 132–133. ISBN 0786484934.
- ^ Hoffman, Fred S. (October 3, 1960). "How Election Looks Today". The Philadelphia Inquirer. Philadelphia. pp. 1, 3.
- ^ "Populous States Are Key: Both Parties Claim Enough Votes To Win". Knoxville News Sentinel. Knoxville, Tennessee. October 23, 1960. p. A-4.
- ^ Lewis, Ted (October 28, 1960). "Campaign Circus". Daily News. Jersey City, New Jersey. p. 4C.
- ^ "Poll of Editors Predicts Victory for Nixon-Lodge: Republican Ticket Seen Winning in 28 States and Democrats in 19". The Daily Item. November 4, 1960. p. 3.
- ^ Hoffman, Fred S. (November 7, 1960). "AP Poll Puts Jack Ahead in Electors". The Clarion-Ledger. Jackson, Mississippi. pp. 1–2.
- ^ Gould, Geoffrey (November 7, 1960). "Final Survey Shows Race a Tossup to the Finish". Hattiesburg American. Hattiesburg, Mississippi. p. 16.
- ^ Mississippi official and statistical register 1960-64. Jackson, MS: Secretary of State of Mississippi. 1965. pp. 393–395.
- ^ Dave Leip’s Atlas of U.S. Presidential Elections; 1960 Presidential General Election Results – Mississippi
- ^ Phillips, Kevin P. (1969). The Emerging Republican Majority. New Rochelle, New York: Arlington House. pp. 220, 234–237. ISBN 0870000586.
- ^ a b Sullivan, Robert David; ‘How the Red and Blue Map Evolved Over the Past Century’; America Magazine in The National Catholic Review; June 29, 2016
- ^ "Warren County, Mississippi Votes". The Political Graveyard.


