1988 United States presidential election in Illinois Turnout 71.72%
County Results Township Results
Bush
40–50%
50–60%
60–70%
70–80%
80–90%
Dukakis
40–50%
50–60%
60–70%
70–80%
80–90%
>90%
The 1988 United States presidential election in Illinois took place on November 8, 1988. All 50 states and the District of Columbia were part of the 1988 United States presidential election . State voters chose 24 electors to the Electoral College , which selected the president and vice president .
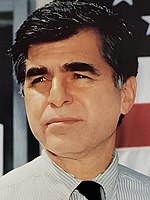
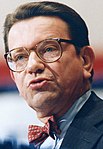
Illinois was won by incumbent United States Vice President George H. W. Bush of Texas , who was running against Massachusetts Governor Michael Dukakis . Bush ran with Indiana Senator Dan Quayle as Vice President, and Dukakis ran with Texas Senator Lloyd Bentsen .
Illinois weighed in for this election as 5.4% more Democratic than the national average. Bush won the election in rapidly liberalizing Illinois with a narrow 2-point margin. Like the neighboring state of Missouri , Bush's performance here was far below that of President Ronald Reagan 's just four years earlier . Bush's loss of many down-state rural counties, combined with Dukakis's stronger than normal performance across much of the state, especially in Cook County, which houses the Chicago area, made the election results in this state much closer than usual.
The presidential election of 1988 was a very partisan election for Illinois, with more than 99% of the electorate voting for either the Democratic or Republican parties, and only five political parties listed as options on the ballot statewide.[ 1] 2020 presidential election , this was the last time that Illinois voted Republican in a presidential election. 1988 is also the most recent election in which Peoria County and Champaign County voted for a Republican presidential candidate, as well as the last time a Republican candidate won more than 40% of the vote in Cook County, home to Chicago.[ 2] Midwest at the presidential level.
The primaries and general elections coincided with those for congress , as well as those for state offices .[ 3] [ 4]
Turnout during the state-run primaries was 39.82%, with 2,359,737 votes cast.[ 3]
Turnout during the general election was 71.72%, 4,559,120 votes cast.[ 4]
1988 Illinois Democratic presidential primary
The 1988 Illinois Democratic presidential primary was held on March 15, 1988 in the U.S. state of Illinois as one of the Democratic Party's statewide nomination contests ahead of the 1988 presidential election.
1988 Illinois Republican presidential primary
The 1988 Illinois Republican presidential primary was held on March 15, 1988 in the U.S. state of Illinois as one of the Republican Party's statewide nomination contests ahead of the 1988 presidential election.
Illinois Solidarity [ edit ] The 1988 Illinois Solidarity presidential primary was held on March 15, 1988, in the U.S. state of Illinois . Lenora Fulani won, running unopposed.
County
George H.W. Bush
Michael Dukakis
Ron Paul
Leonora Fulani
Edward Winn
Margin
Total votes cast[ 5]
#
%
#
%
#
%
#
%
#
%
#
%
Adams
15,831
53.29%
13,768
46.34%
64
0.22%
18
0.06%
29
0.10%
2,063
6.95%
29,710
Alexander
1,954
41.90%
2,693
57.75%
4
0.09%
8
0.17%
4
0.09%
-739
-15.85%
4,663
Bond
3,608
50.78%
3,459
48.68%
18
0.25%
9
0.13%
11
0.15%
149
2.10%
7,105
Boone
6,923
61.69%
4,234
37.73%
30
0.27%
14
0.12%
21
0.19%
2,689
23.96%
11,222
Brown
1,373
51.89%
1,267
47.88%
1
0.04%
3
0.11%
2
0.08%
106
4.01%
2,646
Bureau
8,896
54.41%
7,354
44.98%
42
0.26%
23
0.14%
36
0.22%
1,542
9.43%
16,351
Calhoun
1,238
44.37%
1,544
55.34%
2
0.07%
4
0.14%
2
0.07%
-306
-10.97%
2,790
Carroll
4,464
59.42%
2,990
39.80%
20
0.27%
24
0.32%
14
0.19%
1,474
19.62%
7,512
Cass
2,916
46.53%
3,316
52.91%
8
0.13%
8
0.13%
19
0.30%
-400
-6.38%
6,267
Champaign
33,247
52.36%
29,733
46.82%
264
0.42%
164
0.26%
91
0.14%
3,514
5.54%
63,499
Christian
7,040
45.61%
8,295
53.74%
44
0.29%
23
0.15%
34
0.22%
-1,255
-8.13%
15,436
Clark
4,508
57.71%
3,275
41.93%
11
0.14%
9
0.12%
8
0.10%
1,233
15.78%
7,811
Clay
3,494
55.65%
2,761
43.97%
10
0.16%
5
0.08%
9
0.14%
733
11.68%
6,279
Clinton
7,681
56.15%
5,935
43.38%
27
0.20%
22
0.16%
15
0.11%
1,746
12.77%
13,680
Coles
11,043
56.62%
8,327
42.69%
58
0.30%
36
0.18%
40
0.21%
2,716
13.93%
19,504
Cook
878,582
43.36%
1,129,973
55.77%
7,776
0.38%
6,244
0.31%
3,569
0.18%
-251,391
-12.41%
2,026,144
Crawford
4,951
57.76%
3,555
41.48%
32
0.37%
19
0.22%
14
0.16%
1,396
16.28%
8,571
Cumberland
2,667
57.98%
1,904
41.39%
9
0.20%
8
0.17%
12
0.26%
763
16.59%
4,600
DeKalb
17,182
58.86%
11,811
40.46%
122
0.42%
37
0.13%
38
0.13%
5,371
18.40%
29,190
DeWitt
3,942
59.32%
2,660
40.03%
22
0.33%
12
0.18%
9
0.14%
1,282
19.29%
6,645
Douglas
4,378
57.62%
3,184
41.91%
9
0.12%
8
0.11%
19
0.25%
1,194
15.71%
7,598
DuPage
217,907
69.39%
94,285
30.02%
1,180
0.38%
360
0.11%
322
0.10%
123,622
39.37%
314,054
Edgar
5,538
58.55%
3,880
41.02%
19
0.20%
10
0.11%
12
0.13%
1,658
17.53%
9,459
Edwards
2,212
64.12%
1,218
35.30%
5
0.14%
9
0.26%
6
0.17%
994
28.82%
3,450
Effingham
8,431
64.53%
4,553
34.85%
38
0.29%
18
0.14%
26
0.20%
3,878
29.68%
13,066
Fayette
5,452
53.88%
4,632
45.78%
15
0.15%
10
0.10%
9
0.09%
820
8.10%
10,118
Ford
4,059
66.05%
2,026
32.97%
22
0.36%
20
0.33%
18
0.29%
2,033
33.08%
6,145
Franklin
7,677
40.87%
11,023
58.69%
34
0.18%
26
0.14%
23
0.12%
-3,346
-17.82%
18,783
Fulton
6,999
43.45%
9,046
56.16%
24
0.15%
22
0.14%
17
0.11%
-2,047
-12.71%
16,108
Gallatin
1,580
38.89%
2,455
60.42%
8
0.20%
9
0.22%
11
0.27%
-875
-21.53%
4,063
Greene
3,136
50.56%
3,020
48.69%
15
0.24%
16
0.26%
16
0.26%
116
1.87%
6,203
Grundy
8,743
60.88%
5,525
38.47%
41
0.29%
22
0.15%
30
0.21%
3,218
22.41%
14,361
Hamilton
2,622
49.89%
2,618
49.81%
5
0.10%
8
0.15%
3
0.06%
4
0.08%
5,256
Hancock
4,568
48.71%
4,740
50.54%
37
0.39%
16
0.17%
17
0.18%
-172
-1.83%
9,378
Hardin
1,504
53.26%
1,308
46.32%
3
0.11%
2
0.07%
7
0.25%
196
6.94%
2,824
Henderson
1,726
45.17%
2,085
54.57%
5
0.13%
1
0.03%
4
0.10%
-359
-9.40%
3,821
Henry
11,358
49.28%
11,594
50.30%
45
0.20%
23
0.10%
28
0.12%
-236
-1.02%
23,048
Iroquois
9,596
69.11%
4,221
30.40%
24
0.17%
21
0.15%
24
0.17%
5,375
38.71%
13,886
Jackson
9,687
45.73%
11,334
53.50%
81
0.38%
54
0.25%
29
0.14%
-1,647
-7.77%
21,185
Jasper
3,024
58.28%
2,135
41.14%
15
0.29%
5
0.10%
10
0.19%
889
17.14%
5,189
Jefferson
7,624
49.42%
7,729
50.10%
34
0.22%
18
0.12%
21
0.14%
-105
-0.68%
15,426
Jersey
4,343
49.62%
4,376
50.00%
15
0.17%
6
0.07%
12
0.14%
-33
-0.38%
8,752
Jo Daviess
4,923
53.88%
4,141
45.32%
40
0.44%
17
0.19%
16
0.18%
782
8.56%
9,137
Johnson
2,797
59.61%
1,872
39.90%
8
0.17%
11
0.23%
4
0.09%
925
19.71%
4,692
Kane
66,283
64.10%
36,366
35.17%
432
0.42%
170
0.16%
161
0.16%
29,917
28.93%
103,412
Kankakee
20,316
56.82%
15,147
42.36%
55
0.15%
202
0.56%
35
0.10%
5,169
14.46%
35,755
Kendall
10,653
70.62%
4,347
28.82%
39
0.26%
26
0.17%
19
0.13%
6,306
41.80%
15,084
Knox
10,842
45.75%
12,752
53.81%
44
0.19%
31
0.13%
31
0.13%
-1,910
-8.06%
23,700
Lake
114,115
63.53%
64,327
35.81%
709
0.39%
287
0.16%
195
0.11%
49,788
27.72%
179,633
LaSalle
22,166
49.64%
22,271
49.88%
89
0.20%
59
0.13%
65
0.15%
-105
-0.24%
44,650
Lawrence
3,655
53.57%
3,140
46.02%
9
0.13%
10
0.15%
9
0.13%
515
7.55%
6,823
Lee
8,903
65.48%
4,608
33.89%
38
0.28%
25
0.18%
22
0.16%
4,295
31.59%
13,596
Livingston
10,324
67.02%
5,009
32.52%
37
0.24%
18
0.12%
17
0.11%
5,315
34.50%
15,405
Logan
8,490
63.90%
4,727
35.58%
33
0.25%
15
0.11%
21
0.16%
3,763
28.32%
13,286
Macon
23,862
48.22%
25,364
51.25%
132
0.27%
66
0.13%
65
0.13%
-1,502
-3.03%
49,489
Macoupin
9,362
43.20%
12,195
56.28%
50
0.23%
30
0.14%
32
0.15%
-2,833
-13.08%
21,669
Madison
44,907
45.04%
54,175
54.34%
268
0.27%
219
0.22%
126
0.13%
-9,268
-9.30%
99,695
Marion
8,695
50.05%
8,592
49.46%
35
0.20%
24
0.14%
27
0.16%
103
0.59%
17,373
Marshall
3,588
56.35%
2,742
43.07%
21
0.33%
6
0.09%
10
0.16%
846
13.28%
6,367
Mason
3,424
49.95%
3,406
49.69%
8
0.12%
5
0.07%
12
0.18%
18
0.26%
6,855
Massac
3,507
51.86%
3,227
47.72%
5
0.07%
18
0.27%
6
0.09%
280
4.14%
6,763
McDonough
7,173
57.42%
5,247
42.00%
28
0.22%
26
0.21%
19
0.15%
1,926
15.42%
12,493
McHenry
46,135
70.44%
18,919
28.88%
251
0.38%
81
0.12%
113
0.17%
27,216
41.56%
65,499
McLean
30,572
61.75%
18,659
37.69%
117
0.24%
99
0.20%
64
0.13%
11,913
24.06%
49,511
Menard
3,560
62.40%
2,103
36.86%
19
0.33%
17
0.30%
6
0.11%
1,457
25.54%
5,705
Mercer
3,683
46.45%
4,204
53.02%
18
0.23%
9
0.11%
15
0.19%
-521
-6.57%
7,929
Monroe
6,275
57.83%
4,529
41.74%
18
0.17%
13
0.12%
16
0.15%
1,746
16.09%
10,851
Montgomery
6,388
46.43%
7,293
53.01%
40
0.29%
17
0.12%
21
0.15%
-905
-6.58%
13,759
Morgan
8,808
59.17%
6,032
40.52%
29
0.19%
8
0.05%
9
0.06%
2,776
18.65%
14,886
Moultrie
3,167
50.98%
3,013
48.50%
14
0.23%
6
0.10%
12
0.19%
154
2.48%
6,212
Ogle
11,644
66.94%
5,641
32.43%
61
0.35%
25
0.14%
23
0.13%
6,003
34.51%
17,394
Peoria
37,605
51.35%
35,253
48.14%
172
0.23%
117
0.16%
83
0.11%
2,352
3.21%
73,230
Perry
4,576
46.78%
5,167
52.83%
9
0.09%
13
0.13%
16
0.16%
-591
-6.05%
9,781
Piatt
4,137
56.85%
3,099
42.59%
15
0.21%
12
0.16%
14
0.19%
1,038
14.26%
7,277
Pike
3,965
46.11%
4,614
53.66%
13
0.15%
6
0.07%
1
0.01%
-649
-7.55%
8,599
Pope
1,202
54.44%
996
45.11%
5
0.23%
2
0.09%
3
0.14%
206
9.33%
2,208
Pulaski
1,666
47.90%
1,793
51.55%
5
0.14%
12
0.35%
2
0.06%
-127
-3.65%
3,478
Putnam
1,516
48.30%
1,601
51.00%
6
0.19%
6
0.19%
10
0.32%
-85
-2.70%
3,139
Randolph
7,396
48.28%
7,844
51.21%
31
0.20%
27
0.18%
20
0.13%
-448
-2.93%
15,318
Richland
4,264
59.61%
2,863
40.03%
9
0.13%
9
0.13%
8
0.11%
1,401
19.58%
7,153
Rock Island
27,412
40.37%
40,174
59.17%
155
0.23%
70
0.10%
90
0.13%
-12,762
-18.80%
67,901
Saline
5,798
46.31%
6,676
53.32%
17
0.14%
12
0.10%
18
0.14%
-878
-7.01%
12,521
Sangamon
50,175
56.76%
37,729
42.68%
228
0.26%
146
0.17%
125
0.14%
12,446
14.08%
88,403
Schuyler
2,178
53.57%
1,866
45.89%
7
0.17%
7
0.17%
8
0.20%
312
7.68%
4,066
Scott
1,535
55.02%
1,243
44.55%
4
0.14%
4
0.14%
4
0.14%
292
10.47%
2,790
Shelby
5,370
53.28%
4,650
46.14%
19
0.19%
15
0.15%
24
0.24%
720
7.14%
10,078
St. Clair
41,439
42.58%
55,465
57.00%
180
0.18%
133
0.14%
96
0.10%
-14,026
-14.42%
97,313
Stark
1,841
58.39%
1,274
40.41%
19
0.60%
9
0.29%
10
0.32%
567
17.98%
3,153
Stephenson
11,342
59.87%
7,460
39.38%
74
0.39%
39
0.21%
30
0.16%
3,882
20.49%
18,945
Tazewell
28,861
53.72%
24,603
45.79%
119
0.22%
69
0.13%
75
0.14%
4,258
7.93%
53,727
Union
4,244
50.05%
4,197
49.50%
18
0.21%
7
0.08%
13
0.15%
47
0.55%
8,479
Vermilion
16,943
48.32%
17,918
51.10%
75
0.21%
67
0.19%
64
0.18%
-975
-2.78%
35,067
Wabash
3,453
60.30%
2,241
39.14%
12
0.21%
8
0.14%
12
0.21%
1,212
21.16%
5,726
Warren
4,584
55.54%
3,617
43.82%
18
0.22%
22
0.27%
13
0.16%
967
11.72%
8,254
Washington
4,127
60.04%
2,689
39.12%
18
0.26%
25
0.36%
15
0.22%
1,438
20.92%
6,874
Wayne
5,481
63.29%
3,135
36.20%
11
0.13%
10
0.12%
23
0.27%
2,346
27.09%
8,660
White
4,354
51.04%
4,144
48.58%
13
0.15%
7
0.08%
13
0.15%
210
2.46%
8,531
Whiteside
12,978
53.05%
11,328
46.31%
74
0.30%
37
0.15%
45
0.18%
1,650
6.74%
24,462
Will
73,129
59.10%
49,816
40.26%
363
0.29%
259
0.21%
164
0.13%
23,313
18.84%
123,731
Williamson
12,274
48.84%
12,712
50.58%
58
0.23%
62
0.25%
24
0.10%
-438
-1.74%
25,130
Winnebago
55,699
54.69%
45,280
44.46%
568
0.56%
137
0.13%
166
0.16%
10,419
10.23%
101,850
Woodford
9,474
66.93%
4,604
32.53%
44
0.31%
13
0.09%
20
0.14%
4,870
34.40%
14,155
Totals
2,310,939
50.69%
2,215,940
48.60%
14,944
0.33%
10,276
0.23%
7,021
0.15%
94,999
2.09%
4,559,120
Counties that flipped from Republican to Democratic [ edit ]


