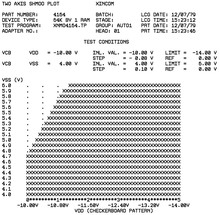
Shmoo plot
In electrical engineering, a shmoo plot is a graphical display of the response of a component or system varying over a range of conditions or inputs.
Origin
[edit]The origin of the shmoo plot is unclear. It is referenced in a 1966 IEEE paper.[1] Another early reference is in manuals for IBM 2365 Processor Storage.[2]
The invention of the shmoo plot is sometimes credited to VLSI Hall Of Fame inductee Robert Huston (1941–2006).[3] But this is unlikely because Huston did not begin working as a test engineer until 1967.[4]
Etymology
[edit]
The plot takes its name from the Shmoo, a fictional species created by Al Capp in the cartoon Li'l Abner. These small, blob-like creatures have shapes similar to the "working" volumes that would be enclosed by shmoo plots drawn against three independent variables (such as voltage, temperature, and response speed).
Semiconductor chips do not usually exhibit "shmoo" shape plots.[citation needed] Historically, testing of magnetic core memory arrays produced the "shmoo" shape and the term continued into the semiconductor era.
Description
[edit]Shmoo plots are often used to represent the results of the testing of complex electronic systems such as computers or integrated circuits such as DRAMs, ASICs or microprocessors. The plot usually shows the range of conditions in which the device under test operates (in adherence with some remaining set of specifications).
For example, when testing semiconductor memory: voltages, temperature, and refresh rates can be varied over specified ranges and only certain combinations of these factors will allow the device to operate. Plotted on independent axes (voltage, temperature, refresh rates), the range of working values will enclose a three-dimensional, usually oddly-shaped volume. Other examples of conditions and inputs that can be varied include frequency, temperature, timing parameters, system- or component-specific variables, and even varying knobs tweakable during silicon chip fabrication producing parts of varying quality which are then used in the process.
Often one 'knob' or variable is plotted on one axis against another knob or variable on another axis, producing a two-dimensional graph. This allows the test engineer to visually observe the operating ranges of the device under test. This process of varying the conditions and inputs to the component or system may sometimes be referred to as 'shmooing' but more officially known as electrical testing or qualification. Automatic test equipment often contains software features that allow automated shmooing of a part.
Examples
[edit]


Automated test equipment have traditionally generated a two-dimensional, ASCII form of the shmoo plot that uses an "X" to represent functional points and blank space for non-functional points. In modern times plots with two colors (e.g. red/green) or even multi colored plots in form of digital spread sheet documents and alike became also common, even if the traditional form is still in use.[5] For testing efficiency sometimes only the border of interest (where a certain value changes its state) is backed up with data in the diagrams thus (often reasonably) assuming the areas outside those transition will stay at those state.[6]
If sufficiently-wide ranges of the two independent variables were to be tested, a normal shmoo plot would show an operating envelope of some shape not unlike Al Capp's Shmoo, but in practice, this might damage the device under test, and finer-grained views are of much more interest, particularly focusing on published component margins (e.g., - 5% Vcc). When this is done, the operating envelope typically extends to the border of the plot in one or more directions.
One example of such “shmooing” is the procedure for optimising the two operating variables of the Read Only Storage (ROS) in the IBM S/360 Model 65 Central Processing Unit (CPU). While the CPU is running a diagnostic test program the ROS bias voltage and time delay are varied and the points where the ROS generates errors are manually plotted on a graphical shmoo plot (see illustration). To pass the test the shmoo plot must be large enough to contain a rectangle which represents the minimum permissible error-free range of bias voltage and time delay. The optimum ROS bias voltage and time delay will be indicated by a point at the centre of the rectangle.
Sometimes a shmoo plot has an unusual and surprising shape, and while it is difficult to determine the exact cause, it is sometimes due to some unusual defect (perhaps in only part of a circuit) coupled with otherwise normal operation. In other cases, it might be an artifact of the electrical testing setup or the test program used, in particular a race condition. As such, a shmoo plot can be a useful test setup verification tool.
A limitation of the technique is that the extended duration of testing of the device may cause additional internal device heating, resulting in a skewing of the data (later tested cells on the plot may perform worse than earlier ones). One way of avoiding this is to exercise the device thoroughly in a similar manner immediately before the actual shmoo test.
External links
[edit]- Shmoo Plotting: The Black Art of IC Testing, Keith Baker and Jos van Beers, IEEE International Test Conference, 1996
- Shmoo Plotting: The Black Art of IC Testing, Keith Baker and Jos van Beers, IEEE Design & Test of Computers, July-September 1997
References
[edit]- ^ The Sensitivity Function in Variability Analysis, Charles Belove, IEEE Transactions on Reliability, Volume R-15, Issue 2, August 1966.
- ^ 64KByte gate in a Core Storage Unit, Virtual Museum, Newcastle University. According to the Virtual Museum page, this computer was installed in 1967.
- ^ VLSIresearch’s CHIP MAKING INDUSTRY HALL OF FAME, VLSI Research Inc.
- ^ Robert Huston Obituary, San Jose Mercury News, July 31, 2006
- ^ Energy optimization for an 28 nm sized storage semiconductor using ASCII Shmoo plots for read and write metrics, dated 2016
- ^ Examples for thinned out, multi-color Shmoo diagrams, dated 2015
