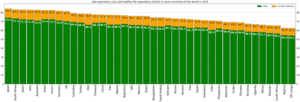
List of Japanese prefectures by life expectancy
Appearance
This article needs to be updated. (January 2022) |


the Our World in Data


This is a list of Japanese prefectures by life expectancy.[1]
List (2015)
[edit]Prefectures by life expectancy at birth according to Ministry of Health, Labour and Welfare of Japan. The total life expectancy is calculated out of the averages for men and women.
| Rank | Prefecture | Life expectancy, total |
Life expectancy, men[2] |
Life expectancy, women[3] |
|---|---|---|---|---|
| 1 | 84.72 | 81.75 | 87.68 | |
| 2 | 84.68 | 81.78 | 87.57 | |
| 3 | 84.41 | 81.27 | 87.54 | |
| 4 | 84.38 | 81.40 | 87.35 | |
| 5 | 84.36 | 81.22 | 87.49 | |
| 6 | 84.35 | 81.03 | 87.67 | |
| 7 | 84.31 | 81.36 | 87.25 | |
| 8 | 84.28 | 81.32 | 87.24 | |
| 9 | 84.22 | 80.79 | 87.64 | |
| 10 | 84.21 | 81.08 | 87.33 | |
| 11 | 84.20 | 81.08 | 87.31 | |
| 12 | 84.17 | 81.07 | 87.26 | |
| 13 | 84.16 | 81.04 | 87.28 | |
| 14 | 84.08 | 80.99 | 87.16 | |
| 15 | 84.04 | 80.85 | 87.22 | |
| 16 | 84.03 | 80.95 | 87.10 | |
| 16 | 84.03 | 80.85 | 87.21 | |
| 18 | 84.02 | 80.61 | 87.42 | |
| 19 | 84.01 | 80.69 | 87.32 | |
| 20 | 84.00 | 80.92 | 87.07 | |
| 21 | 83.98 | 81.10 | 86.86 | |
| 22 | 83.94 | 80.96 | 86.91 | |
| 23 | 83.93 | 80.86 | 86.99 | |
| 24 | 83.91 | 81.00 | 86.82 | |
| 25 | 83.90 | 80.66 | 87.14 | |
| 26 | 83.89 | 80.65 | 87.12 | |
| 27 | 83.86 | 80.27 | 87.44 | |
| 28 | 83.74 | 80.82 | 86.66 | |
| 29 | 83.74 | 80.52 | 86.96 | |
| 30 | 83.73 | 80.61 | 86.84 | |
| 31 | 83.73 | 80.34 | 87.12 | |
| 32 | 83.72 | 80.17 | 87.27 | |
| 33 | 83.70 | 80.51 | 86.88 | |
| 34 | 83.68 | 80.38 | 86.97 | |
| 35 | 83.64 | 80.26 | 87.01 | |
| 36 | 83.53 | 80.28 | 86.77 | |
| 37 | 83.49 | 80.32 | 86.66 | |
| 38 | 83.49 | 80.16 | 86.82 | |
| 39 | 83.48 | 80.23 | 86.73 | |
| 40 | 83.40 | 80.02 | 86.78 | |
| 41 | 83.31 | 80.28 | 86.33 | |
| 42 | 83.26 | 80.12 | 86.40 | |
| 43 | 83.21 | 79.94 | 86.47 | |
| 44 | 83.17 | 80.10 | 86.24 | |
| 45 | 83.15 | 79.86 | 86.44 | |
| 46 | 82.95 | 79.51 | 86.38 | |
| 47 | 82.30 | 78.67 | 85.93 | |
| 83.89 | 80.77 | 87.01 |
See also
[edit]Wikimedia Commons has media related to Life expectancy charts for Japan.
References
[edit]- ^ "平成27年都道府県別生命表の概況|厚生労働省". www.mhlw.go.jp. Retrieved 2019-04-19.
- ^ "Average Life Expectancy: Male".
- ^ "Average Life Expectancy: Male".
