List of French departments by life expectancy
INSEE (2023)[edit]
The official statistics of France, available on the INSEE website, do not include total life expectancy for the population as a whole. For a more correct comparison of regions with various differences in life expectancy for men and women, a column with the arithmetic mean of these indicators was added to the tables. By default tables are sorted by arithmetic mean for 2023.
Statistics by region[edit]
Metropolitan France[edit]
| region | 2019 | 2019 →2022 | 2022 | 2022 →2023 | 2023 | 2019 →2023 | |||||||||
|---|---|---|---|---|---|---|---|---|---|---|---|---|---|---|---|
| male | female | sex gap | arith. mean | male | female | sex gap | arith. mean | male | female | sex gap | arith. mean | ||||
| Metropolitan France | 79.8 | 85.7 | 5.9 | 82.75 | −0.40 | 79.4 | 85.3 | 5.9 | 82.35 | 0.60 | 80.1 | 85.8 | 5.7 | 82.95 | 0.20 |
| Île-de-France (Paris Region) | 81.4 | 86.1 | 4.7 | 83.75 | −0.35 | 80.8 | 86.0 | 5.2 | 83.40 | 0.75 | 81.8 | 86.5 | 4.7 | 84.15 | 0.40 |
| Auvergne-Rhône-Alpes | 80.5 | 85.9 | 5.4 | 83.20 | −0.20 | 80.2 | 85.8 | 5.6 | 83.00 | 0.70 | 81.0 | 86.4 | 5.4 | 83.70 | 0.50 |
| Corsica | 80.5 | 86.4 | 5.9 | 83.45 | −0.45 | 80.3 | 85.7 | 5.4 | 83.00 | 0.40 | 80.8 | 86.0 | 5.2 | 83.40 | −0.05 |
| Provence-Alpes-Côte d'Azur | 80.0 | 85.6 | 5.6 | 82.80 | −0.40 | 79.5 | 85.3 | 5.8 | 82.40 | 0.90 | 80.6 | 86.0 | 5.4 | 83.30 | 0.50 |
| Pays de la Loire | 79.8 | 86.0 | 6.2 | 82.90 | −0.25 | 79.7 | 85.6 | 5.9 | 82.65 | 0.60 | 80.3 | 86.2 | 5.9 | 83.25 | 0.35 |
| Occitania | 80.1 | 85.5 | 5.4 | 82.80 | −0.35 | 79.6 | 85.3 | 5.7 | 82.45 | 0.70 | 80.5 | 85.8 | 5.3 | 83.15 | 0.35 |
| Nouvelle-Aquitaine | 79.7 | 85.5 | 5.8 | 82.60 | −0.35 | 79.2 | 85.3 | 6.1 | 82.25 | 0.65 | 80.1 | 85.7 | 5.6 | 82.90 | 0.30 |
| Brittany | 78.7 | 85.2 | 6.5 | 81.95 | −0.15 | 78.6 | 85.0 | 6.4 | 81.80 | 0.65 | 79.4 | 85.5 | 6.1 | 82.45 | 0.50 |
| Centre-Val de Loire | 79.3 | 85.2 | 5.9 | 82.25 | −0.15 | 79.0 | 85.2 | 6.2 | 82.10 | 0.25 | 79.5 | 85.2 | 5.7 | 82.35 | 0.10 |
| Bourgogne-Franche-Comté | 78.9 | 85.0 | 6.1 | 81.95 | −0.05 | 78.8 | 85.0 | 6.2 | 81.90 | 0.30 | 79.3 | 85.1 | 5.8 | 82.20 | 0.25 |
| Grand Est | 79.0 | 84.6 | 5.6 | 81.80 | −0.30 | 78.6 | 84.4 | 5.8 | 81.50 | 0.60 | 79.4 | 84.8 | 5.4 | 82.10 | 0.30 |
| Normandy | 78.3 | 84.9 | 6.6 | 81.60 | −0.45 | 78.0 | 84.3 | 6.3 | 81.15 | 0.75 | 78.9 | 84.9 | 6.0 | 81.90 | 0.30 |
| Hauts-de-France | 77.5 | 83.8 | 6.3 | 80.65 | −0.20 | 77.3 | 83.6 | 6.3 | 80.45 | 0.70 | 78.1 | 84.2 | 6.1 | 81.15 | 0.50 |


Life expectancy in the regions of metropolitan France in 2022 for male and female[1]
Overseas regions[edit]
| region | 2019 | 2019 →2022 | 2022 | 2022 →2023 | 2023 | 2019 →2023 | |||||||||
|---|---|---|---|---|---|---|---|---|---|---|---|---|---|---|---|
| male | female | sex gap | arith. mean | male | female | sex gap | arith. mean | male | female | sex gap | arith. mean | ||||
| France on average | 79.7 | 85.6 | 5.9 | 82.65 | −0.40 | 79.3 | 85.2 | 5.9 | 82.25 | 0.60 | 80.0 | 85.7 | 5.7 | 82.85 | 0.20 |
| Réunion (in the Indian Ocean) | 78.5 | 84.7 | 6.2 | 81.60 | −1.50 | 76.9 | 83.3 | 6.4 | 80.10 | 2.15 | 79.4 | 85.1 | 5.7 | 82.25 | 0.65 |
| Martinique (in the Caribbean) | 78.8 | 84.3 | 5.5 | 81.55 | −1.80 | 76.7 | 82.8 | 6.1 | 79.75 | 1.25 | 78.2 | 83.8 | 5.6 | 81.00 | −0.55 |
| Guadeloupe (in the Caribbean) | 76.4 | 84.7 | 8.3 | 80.55 | −0.70 | 76.2 | 83.5 | 7.3 | 79.85 | 0.75 | 76.9 | 84.3 | 7.4 | 80.60 | 0.05 |
| French Guiana (in South America) | 76.6 | 83.8 | 7.2 | 80.20 | −0.70 | 76.4 | 82.6 | 6.2 | 79.50 | −0.50 | 76.1 | 81.9 | 5.8 | 79.00 | −1.20 |
| Mayotte (in the Indian Ocean) | — | — | — | — | — | 72.3 | 74.6 | 2.3 | 73.45 | 0.65 | 73.9 | 74.3 | 0.4 | 74.10 | — |
Statistics by departments[edit]
| code | department | 2019 | 2019 →2022 | 2022 | 2022 →2023 | 2023 | 2019 →2023 | |||||||||
|---|---|---|---|---|---|---|---|---|---|---|---|---|---|---|---|---|
| male | female | sex gap | arith. mean | male | female | sex gap | arith. mean | male | female | sex gap | arith. mean | |||||
| M | Metropolitan France | 79.8 | 85.7 | 5.9 | 82.75 | −0.40 | 79.4 | 85.3 | 5.9 | 82.35 | 0.60 | 80.1 | 85.8 | 5.7 | 82.95 | 0.20 |
| 92 | Hauts-de-Seine | 82.6 | 86.5 | 3.9 | 84.55 | −0.25 | 81.9 | 86.7 | 4.8 | 84.30 | 0.70 | 82.8 | 87.2 | 4.4 | 85.00 | 0.45 |
| 78 | Yvelines | 81.9 | 86.6 | 4.7 | 84.25 | −0.25 | 81.6 | 86.4 | 4.8 | 84.00 | 0.80 | 82.5 | 87.1 | 4.6 | 84.80 | 0.55 |
| 75 | Paris | 82.0 | 86.9 | 4.9 | 84.45 | −0.55 | 81.1 | 86.7 | 5.6 | 83.90 | 0.80 | 82.4 | 87.0 | 4.6 | 84.70 | 0.25 |
| 69 | Rhône, Lyon Metropolis | 81.3 | 86.6 | 5.3 | 83.95 | −0.10 | 81.0 | 86.7 | 5.7 | 83.85 | 0.85 | 82.0 | 87.4 | 5.4 | 84.70 | 0.75 |
| 94 | Val-de-Marne | 81.4 | 86.2 | 4.8 | 83.80 | 0.20 | 81.3 | 86.7 | 5.4 | 84.00 | 0.65 | 82.3 | 87.0 | 4.7 | 84.65 | 0.85 |
| 31 | Haute-Garonne | 81.5 | 86.0 | 4.5 | 83.75 | 0.05 | 81.1 | 86.5 | 5.4 | 83.80 | 0.40 | 81.8 | 86.6 | 4.8 | 84.20 | 0.45 |
| 74 | Haute-Savoie | 81.4 | 86.3 | 4.9 | 83.85 | −0.10 | 81.1 | 86.4 | 5.3 | 83.75 | 0.40 | 81.6 | 86.7 | 5.1 | 84.15 | 0.30 |
| 38 | Isère | 81.2 | 85.9 | 4.7 | 83.55 | −0.30 | 80.6 | 85.9 | 5.3 | 83.25 | 0.90 | 81.6 | 86.7 | 5.1 | 84.15 | 0.60 |
| 91 | Essonne | 81.5 | 86.2 | 4.7 | 83.85 | −0.65 | 80.8 | 85.6 | 4.8 | 83.20 | 0.85 | 82.0 | 86.1 | 4.1 | 84.05 | 0.20 |
| 81 | Tarn | 79.8 | 85.8 | 6.0 | 82.80 | 0.15 | 80.0 | 85.9 | 5.9 | 82.95 | 0.90 | 81.4 | 86.3 | 4.9 | 83.85 | 1.05 |
| 49 | Maine-et-Loire | 81.0 | 86.7 | 5.7 | 83.85 | −0.55 | 80.5 | 86.1 | 5.6 | 83.30 | 0.55 | 81.1 | 86.6 | 5.5 | 83.85 | 0.00 |
| 05 | Hautes-Alpes | 80.4 | 86.3 | 5.9 | 83.35 | −0.10 | 80.4 | 86.1 | 5.7 | 83.25 | 0.60 | 80.7 | 87.0 | 6.3 | 83.85 | 0.50 |
| 73 | Savoie | 80.5 | 86.5 | 6.0 | 83.50 | −0.40 | 80.0 | 86.2 | 6.2 | 83.10 | 0.70 | 80.9 | 86.7 | 5.8 | 83.80 | 0.30 |
| 01 | Ain | 80.9 | 86.0 | 5.1 | 83.45 | −0.25 | 80.7 | 85.7 | 5.0 | 83.20 | 0.50 | 81.2 | 86.2 | 5.0 | 83.70 | 0.25 |
| 35 | Ille-et-Vilaine | 80.2 | 86.1 | 5.9 | 83.15 | −0.10 | 79.9 | 86.2 | 6.3 | 83.05 | 0.65 | 80.9 | 86.5 | 5.6 | 83.70 | 0.55 |
| 33 | Gironde | 80.4 | 85.8 | 5.4 | 83.10 | −0.30 | 79.9 | 85.7 | 5.8 | 82.80 | 0.85 | 81.2 | 86.1 | 4.9 | 83.65 | 0.55 |
| 13 | Bouches-du-Rhône | 80.0 | 85.7 | 5.7 | 82.85 | −0.50 | 79.5 | 85.2 | 5.7 | 82.35 | 1.10 | 81.0 | 85.9 | 4.9 | 83.45 | 0.60 |
| 42 | Loire | 80.3 | 85.5 | 5.2 | 82.90 | −0.40 | 79.7 | 85.3 | 5.6 | 82.50 | 0.95 | 80.8 | 86.1 | 5.3 | 83.45 | 0.55 |
| 37 | Indre-et-Loire | 80.0 | 86.2 | 6.2 | 83.10 | −0.35 | 79.7 | 85.8 | 6.1 | 82.75 | 0.70 | 80.6 | 86.3 | 5.7 | 83.45 | 0.35 |
| 95 | Val-d'Oise | 80.5 | 85.4 | 4.9 | 82.95 | −0.40 | 80.0 | 85.1 | 5.1 | 82.55 | 0.85 | 81.1 | 85.7 | 4.6 | 83.40 | 0.45 |
| 2B | Haute-Corse | 80.2 | 86.4 | 6.2 | 83.30 | 0.00 | 80.7 | 85.9 | 5.2 | 83.30 | 0.10 | 81.0 | 85.8 | 4.8 | 83.40 | 0.10 |
| 82 | Tarn-et-Garonne | 79.8 | 85.5 | 5.7 | 82.65 | −0.85 | 79.3 | 84.3 | 5.0 | 81.80 | 1.55 | 81.3 | 85.4 | 4.1 | 83.35 | 0.70 |
| 21 | Côte-d'Or | 79.9 | 85.9 | 6.0 | 82.90 | −0.25 | 79.6 | 85.7 | 6.1 | 82.65 | 0.65 | 80.8 | 85.8 | 5.0 | 83.30 | 0.40 |
| 34 | Hérault | 79.9 | 85.7 | 5.8 | 82.80 | −0.35 | 79.6 | 85.3 | 5.7 | 82.45 | 0.85 | 80.8 | 85.8 | 5.0 | 83.30 | 0.50 |
| 32 | Gers | 79.4 | 85.6 | 6.2 | 82.50 | −0.20 | 79.4 | 85.2 | 5.8 | 82.30 | 1.00 | 80.5 | 86.1 | 5.6 | 83.30 | 0.80 |
| 44 | Loire-Atlantique | 79.5 | 85.8 | 6.3 | 82.65 | 0.05 | 79.8 | 85.6 | 5.8 | 82.70 | 0.60 | 80.4 | 86.2 | 5.8 | 83.30 | 0.65 |
| 64 | Pyrénées-Atlantiques | 80.6 | 86.1 | 5.5 | 83.35 | −0.15 | 80.5 | 85.9 | 5.4 | 83.20 | 0.05 | 80.6 | 85.9 | 5.3 | 83.25 | −0.10 |
| 07 | Ardèche | 79.9 | 85.3 | 5.4 | 82.60 | −0.35 | 79.0 | 85.5 | 6.5 | 82.25 | 1.00 | 80.6 | 85.9 | 5.3 | 83.25 | 0.65 |
| 83 | Var | 79.7 | 85.5 | 5.8 | 82.60 | −0.15 | 79.9 | 85.0 | 5.1 | 82.45 | 0.80 | 80.5 | 86.0 | 5.5 | 83.25 | 0.65 |
| 06 | Alpes-Maritimes | 80.5 | 85.8 | 5.3 | 83.15 | −0.45 | 79.6 | 85.8 | 6.2 | 82.70 | 0.55 | 80.4 | 86.1 | 5.7 | 83.25 | 0.10 |
| 53 | Mayenne | 79.9 | 86.1 | 6.2 | 83.00 | −0.30 | 79.8 | 85.6 | 5.8 | 82.70 | 0.55 | 80.2 | 86.3 | 6.1 | 83.25 | 0.25 |
| 2A | Corse-du-Sud | 80.8 | 86.4 | 5.6 | 83.60 | −1.10 | 79.7 | 85.3 | 5.6 | 82.50 | 0.70 | 80.3 | 86.1 | 5.8 | 83.20 | −0.40 |
| 77 | Seine-et-Marne | 80.4 | 85.5 | 5.1 | 82.95 | −0.35 | 79.9 | 85.3 | 5.4 | 82.60 | 0.55 | 80.8 | 85.5 | 4.7 | 83.15 | 0.20 |
| 26 | Drôme | 79.6 | 85.6 | 6.0 | 82.60 | 0.15 | 80.3 | 85.2 | 4.9 | 82.75 | 0.35 | 80.5 | 85.7 | 5.2 | 83.10 | 0.50 |
| 12 | Aveyron | 80.2 | 86.0 | 5.8 | 83.10 | −0.05 | 80.1 | 86.0 | 5.9 | 83.05 | 0.05 | 80.1 | 86.1 | 6.0 | 83.10 | 0.00 |
| 86 | Vienne | 79.5 | 85.9 | 6.4 | 82.70 | −0.40 | 79.4 | 85.2 | 5.8 | 82.30 | 0.70 | 80.0 | 86.0 | 6.0 | 83.00 | 0.30 |
| 40 | Landes | 79.9 | 85.4 | 5.5 | 82.65 | −0.40 | 79.4 | 85.1 | 5.7 | 82.25 | 0.70 | 80.7 | 85.2 | 4.5 | 82.95 | 0.30 |
| 93 | Seine-Saint-Denis | 80.0 | 84.7 | 4.7 | 82.35 | −0.50 | 79.1 | 84.6 | 5.5 | 81.85 | 1.10 | 80.5 | 85.4 | 4.9 | 82.95 | 0.60 |
| 04 | Alpes-de-Haute-Provence | 79.6 | 84.7 | 5.1 | 82.15 | 0.15 | 79.5 | 85.1 | 5.6 | 82.30 | 0.60 | 80.5 | 85.3 | 4.8 | 82.90 | 0.75 |
| 30 | Gard | 79.6 | 85.3 | 5.7 | 82.45 | −0.25 | 79.3 | 85.1 | 5.8 | 82.20 | 0.70 | 80.2 | 85.6 | 5.4 | 82.90 | 0.45 |
| 87 | Haute-Vienne | 78.8 | 85.7 | 6.9 | 82.25 | 0.00 | 78.9 | 85.6 | 6.7 | 82.25 | 0.60 | 80.2 | 85.5 | 5.3 | 82.85 | 0.60 |
| 84 | Vaucluse | 79.2 | 85.1 | 5.9 | 82.15 | −0.15 | 78.7 | 85.3 | 6.6 | 82.00 | 0.85 | 80.1 | 85.6 | 5.5 | 82.85 | 0.70 |
| 85 | Vendée | 79.4 | 85.7 | 6.3 | 82.55 | −0.35 | 79.1 | 85.3 | 6.2 | 82.20 | 0.65 | 79.8 | 85.9 | 6.1 | 82.85 | 0.30 |
| 72 | Sarthe | 79.2 | 85.4 | 6.2 | 82.30 | −0.25 | 78.9 | 85.2 | 6.3 | 82.05 | 0.75 | 79.8 | 85.8 | 6.0 | 82.80 | 0.50 |
| 67 | Bas-Rhin | 79.9 | 85.1 | 5.2 | 82.50 | −0.20 | 79.6 | 85.0 | 5.4 | 82.30 | 0.45 | 80.3 | 85.2 | 4.9 | 82.75 | 0.25 |
| 45 | Loiret | 79.9 | 85.4 | 5.5 | 82.65 | −0.10 | 79.4 | 85.7 | 6.3 | 82.55 | 0.20 | 80.2 | 85.3 | 5.1 | 82.75 | 0.10 |
| 47 | Lot-et-Garonne | 79.3 | 85.2 | 5.9 | 82.25 | −0.20 | 79.0 | 85.1 | 6.1 | 82.05 | 0.65 | 80.0 | 85.4 | 5.4 | 82.70 | 0.45 |
| 19 | Corrèze | 78.7 | 84.9 | 6.2 | 81.80 | −0.10 | 78.9 | 84.5 | 5.6 | 81.70 | 1.00 | 79.9 | 85.5 | 5.6 | 82.70 | 0.90 |
| 39 | Jura | 80.0 | 85.1 | 5.1 | 82.55 | −0.05 | 79.8 | 85.2 | 5.4 | 82.50 | 0.20 | 79.8 | 85.6 | 5.8 | 82.70 | 0.15 |
| 46 | Lot | 79.4 | 85.3 | 5.9 | 82.35 | 0.30 | 80.1 | 85.2 | 5.1 | 82.65 | 0.05 | 79.7 | 85.7 | 6.0 | 82.70 | 0.35 |
| 68 | Haut-Rhin | 80.1 | 84.8 | 4.7 | 82.45 | −0.30 | 79.4 | 84.9 | 5.5 | 82.15 | 0.50 | 80.3 | 85.0 | 4.7 | 82.65 | 0.20 |
| 65 | Hautes-Pyrénées | 80.1 | 84.6 | 4.5 | 82.35 | −0.75 | 78.7 | 84.5 | 5.8 | 81.60 | 1.05 | 79.8 | 85.5 | 5.7 | 82.65 | 0.30 |
| 41 | Loir-et-Cher | 79.3 | 85.0 | 5.7 | 82.15 | −0.25 | 78.7 | 85.1 | 6.4 | 81.90 | 0.75 | 79.6 | 85.7 | 6.1 | 82.65 | 0.50 |
| 63 | Puy-de-Dôme | 79.3 | 85.5 | 6.2 | 82.40 | −0.40 | 79.0 | 85.0 | 6.0 | 82.00 | 0.60 | 79.7 | 85.5 | 5.8 | 82.60 | 0.20 |
| 79 | Deux-Sèvres | 79.6 | 85.9 | 6.3 | 82.75 | −0.75 | 78.7 | 85.3 | 6.6 | 82.00 | 0.60 | 79.3 | 85.9 | 6.6 | 82.60 | −0.15 |
| 71 | Saône-et-Loire | 79.1 | 85.0 | 5.9 | 82.05 | 0.15 | 79.0 | 85.4 | 6.4 | 82.20 | 0.35 | 79.5 | 85.6 | 6.1 | 82.55 | 0.50 |
| 17 | Charente-Maritime | 79.2 | 85.2 | 6.0 | 82.20 | −0.60 | 78.4 | 84.8 | 6.4 | 81.60 | 0.90 | 79.1 | 85.9 | 6.8 | 82.50 | 0.30 |
| 56 | Morbihan | 78.1 | 85.2 | 7.1 | 81.65 | −0.05 | 78.5 | 84.7 | 6.2 | 81.60 | 0.85 | 79.2 | 85.7 | 6.5 | 82.45 | 0.80 |
| 43 | Haute-Loire | 79.2 | 85.6 | 6.4 | 82.40 | −0.55 | 78.8 | 84.9 | 6.1 | 81.85 | 0.55 | 79.1 | 85.7 | 6.6 | 82.40 | 0.00 |
| 25 | Doubs | 79.3 | 85.6 | 6.3 | 82.45 | −0.40 | 79.1 | 85.0 | 5.9 | 82.05 | 0.30 | 79.8 | 84.9 | 5.1 | 82.35 | −0.10 |
| 14 | Calvados | 78.5 | 85.0 | 6.5 | 81.75 | −0.20 | 78.5 | 84.6 | 6.1 | 81.55 | 0.65 | 79.1 | 85.3 | 6.2 | 82.20 | 0.45 |
| 15 | Cantal | 78.4 | 84.3 | 5.9 | 81.35 | −0.20 | 78.0 | 84.3 | 6.3 | 81.15 | 1.05 | 79.0 | 85.4 | 6.4 | 82.20 | 0.85 |
| 60 | Oise | 78.7 | 84.6 | 5.9 | 81.65 | 0.00 | 78.9 | 84.4 | 5.5 | 81.65 | 0.45 | 79.5 | 84.7 | 5.2 | 82.10 | 0.45 |
| 88 | Vosges | 77.9 | 84.5 | 6.6 | 81.20 | −0.60 | 77.3 | 83.9 | 6.6 | 80.60 | 1.50 | 79.4 | 84.8 | 5.4 | 82.10 | 0.90 |
| 24 | Dordogne | 79.4 | 85.0 | 5.6 | 82.20 | −0.95 | 77.7 | 84.8 | 7.1 | 81.25 | 0.85 | 79.0 | 85.2 | 6.2 | 82.10 | −0.10 |
| 03 | Allier | 77.7 | 84.6 | 6.9 | 81.15 | 0.25 | 78.3 | 84.5 | 6.2 | 81.40 | 0.65 | 79.2 | 84.9 | 5.7 | 82.05 | 0.90 |
| 51 | Marne | 78.8 | 84.8 | 6.0 | 81.80 | −0.25 | 78.6 | 84.5 | 5.9 | 81.55 | 0.50 | 79.0 | 85.1 | 6.1 | 82.05 | 0.25 |
| 61 | Orne | 78.2 | 84.8 | 6.6 | 81.50 | −0.25 | 77.9 | 84.6 | 6.7 | 81.25 | 0.80 | 79.0 | 85.1 | 6.1 | 82.05 | 0.55 |
| 50 | Manche | 78.6 | 85.6 | 7.0 | 82.10 | −1.25 | 77.4 | 84.3 | 6.9 | 80.85 | 1.15 | 78.8 | 85.2 | 6.4 | 82.00 | −0.10 |
| 90 | Territoire de Belfort | 78.6 | 84.0 | 5.4 | 81.30 | 0.20 | 79.1 | 83.9 | 4.8 | 81.50 | 0.45 | 79.8 | 84.1 | 4.3 | 81.95 | 0.65 |
| 09 | Ariège | 78.7 | 85.0 | 6.3 | 81.85 | −0.10 | 78.8 | 84.7 | 5.9 | 81.75 | 0.20 | 79.3 | 84.6 | 5.3 | 81.95 | 0.10 |
| 57 | Moselle | 78.9 | 83.9 | 5.0 | 81.40 | −0.15 | 78.6 | 83.9 | 5.3 | 81.25 | 0.65 | 79.7 | 84.1 | 4.4 | 81.90 | 0.50 |
| 27 | Eure | 78.3 | 84.6 | 6.3 | 81.45 | −0.40 | 77.9 | 84.2 | 6.3 | 81.05 | 0.85 | 79.2 | 84.6 | 5.4 | 81.90 | 0.45 |
| 16 | Charente | 79.4 | 84.5 | 5.1 | 81.95 | −0.50 | 78.3 | 84.6 | 6.3 | 81.45 | 0.45 | 78.7 | 85.1 | 6.4 | 81.90 | −0.05 |
| 29 | Finistère | 78.2 | 84.8 | 6.6 | 81.50 | −0.15 | 78.2 | 84.5 | 6.3 | 81.35 | 0.55 | 78.7 | 85.1 | 6.4 | 81.90 | 0.40 |
| 66 | Pyrénées-Orientales | 78.7 | 84.9 | 6.2 | 81.80 | −1.20 | 77.0 | 84.2 | 7.2 | 80.60 | 1.30 | 78.7 | 85.1 | 6.4 | 81.90 | 0.10 |
| 28 | Eure-et-Loir | 79.2 | 85.1 | 5.9 | 82.15 | −0.20 | 79.1 | 84.8 | 5.7 | 81.95 | −0.10 | 79.0 | 84.7 | 5.7 | 81.85 | −0.30 |
| 10 | Aube | 77.6 | 84.6 | 7.0 | 81.10 | 0.30 | 78.0 | 84.8 | 6.8 | 81.40 | 0.45 | 78.8 | 84.9 | 6.1 | 81.85 | 0.75 |
| 11 | Aude | 79.4 | 85.1 | 5.7 | 82.25 | −0.85 | 78.1 | 84.7 | 6.6 | 81.40 | 0.40 | 78.5 | 85.1 | 6.6 | 81.80 | −0.45 |
| 48 | Lozère | 78.7 | 85.2 | 6.5 | 81.95 | −1.05 | 77.7 | 84.1 | 6.4 | 80.90 | 0.85 | 78.5 | 85.0 | 6.5 | 81.75 | −0.20 |
| 08 | Ardennes | 77.8 | 83.7 | 5.9 | 80.75 | −0.45 | 77.1 | 83.5 | 6.4 | 80.30 | 1.30 | 78.8 | 84.4 | 5.6 | 81.60 | 0.85 |
| 76 | Seine-Maritime | 78.1 | 84.6 | 6.5 | 81.35 | −0.30 | 77.8 | 84.3 | 6.5 | 81.05 | 0.55 | 78.7 | 84.5 | 5.8 | 81.60 | 0.25 |
| 22 | Côtes-d'Armor | 78.1 | 84.5 | 6.4 | 81.30 | −0.50 | 77.4 | 84.2 | 6.8 | 80.80 | 0.80 | 78.5 | 84.7 | 6.2 | 81.60 | 0.30 |
| 52 | Haute-Marne | 77.1 | 84.5 | 7.4 | 80.80 | 0.00 | 77.3 | 84.3 | 7.0 | 80.80 | 0.70 | 78.1 | 84.9 | 6.8 | 81.50 | 0.70 |
| 23 | Creuse | 77.3 | 85.1 | 7.8 | 81.20 | −1.20 | 76.4 | 83.6 | 7.2 | 80.00 | 1.50 | 77.9 | 85.1 | 7.2 | 81.50 | 0.30 |
| 54 | Meurthe-et-Moselle | 79.3 | 85.1 | 5.8 | 82.20 | −0.75 | 78.4 | 84.5 | 6.1 | 81.45 | 0.00 | 78.3 | 84.6 | 6.3 | 81.45 | −0.75 |
| 70 | Haute-Saône | 78.7 | 84.4 | 5.7 | 81.55 | 0.10 | 78.7 | 84.6 | 5.9 | 81.65 | −0.20 | 77.9 | 85.0 | 7.1 | 81.45 | −0.10 |
| 36 | Indre | 77.7 | 84.9 | 7.2 | 81.30 | −0.60 | 77.6 | 83.8 | 6.2 | 80.70 | 0.70 | 78.5 | 84.3 | 5.8 | 81.40 | 0.10 |
| 59 | Nord | 77.6 | 83.8 | 6.2 | 80.70 | −0.25 | 77.3 | 83.6 | 6.3 | 80.45 | 0.85 | 78.2 | 84.4 | 6.2 | 81.30 | 0.60 |
| 55 | Meuse | 77.7 | 84.4 | 6.7 | 81.05 | −0.70 | 77.5 | 83.2 | 5.7 | 80.35 | 0.60 | 77.9 | 84.0 | 6.1 | 80.95 | −0.10 |
| 80 | Somme | 77.3 | 83.7 | 6.4 | 80.50 | 0.10 | 77.2 | 84.0 | 6.8 | 80.60 | 0.35 | 77.7 | 84.2 | 6.5 | 80.95 | 0.45 |
| 89 | Yonne | 77.5 | 83.9 | 6.4 | 80.70 | −0.20 | 77.0 | 84.0 | 7.0 | 80.50 | 0.40 | 77.8 | 84.0 | 6.2 | 80.90 | 0.20 |
| 18 | Cher | 78.0 | 83.3 | 5.3 | 80.65 | 0.80 | 78.5 | 84.4 | 5.9 | 81.45 | −0.65 | 77.7 | 83.9 | 6.2 | 80.80 | 0.15 |
| 02 | Aisne | 76.9 | 83.4 | 6.5 | 80.15 | −0.35 | 76.7 | 82.9 | 6.2 | 79.80 | 0.90 | 77.5 | 83.9 | 6.4 | 80.70 | 0.55 |
| 62 | Pas-de-Calais | 76.7 | 83.7 | 7.0 | 80.20 | −0.20 | 76.6 | 83.4 | 6.8 | 80.00 | 0.55 | 77.3 | 83.8 | 6.5 | 80.55 | 0.35 |
| 58 | Nièvre | 77.1 | 83.9 | 6.8 | 80.50 | 0.35 | 77.3 | 84.4 | 7.1 | 80.85 | −0.30 | 77.1 | 84.0 | 6.9 | 80.55 | 0.05 |
| code | department | male | female | sex gap | arith. mean | 2019 →2022 | male | female | sex gap | arith. mean | 2022 →2023 | male | female | sex gap | arith. mean | 2019 →2023 |
The table is compiled only for departments in metropolitan France. Data source: INSEE[2][1][3]
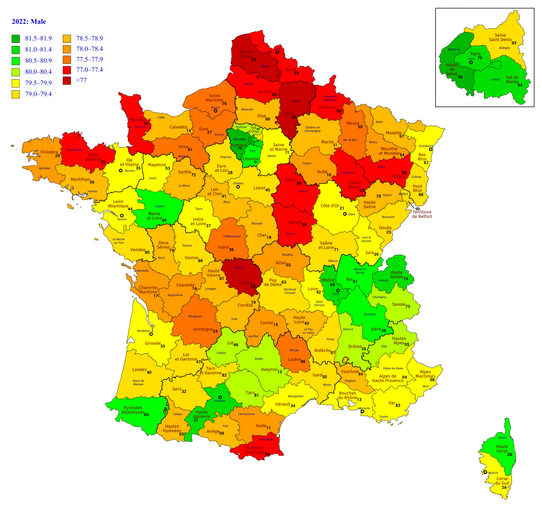

Life expectancy in the departments of metropolitan France in 2022 for male and female[1]
Eurostat (2019—2022)[edit]
By default the table is sorted by 2022.
| code | region | 2019 | 2019 →2021 | 2021 | 2021 →2022 | 2022 | 2019 →2022 | ||||||
|---|---|---|---|---|---|---|---|---|---|---|---|---|---|
| overall | male | female | F Δ M | overall | overall | male | female | F Δ M | |||||
| FR10 | Île-de-France (Paris Region) | 84.6 | 81.8 | 87.1 | 5.3 | −0.8 | 83.8 | 0.3 | 84.1 | 81.4 | 86.6 | 5.2 | −0.5 |
| FRK2 | Rhône-Alpes | 84.1 | 81.2 | 86.8 | 5.6 | −0.3 | 83.8 | −0.1 | 83.7 | 80.8 | 86.4 | 5.6 | −0.4 |
| FRJ2 | Midi-Pyrénées | 83.8 | 81.0 | 86.4 | 5.4 | −0.3 | 83.5 | −0.5 | 83.0 | 80.4 | 85.7 | 5.3 | −0.8 |
| FRM0 | Corsica | 84.0 | 81.5 | 86.5 | 5.0 | −0.6 | 83.4 | −0.5 | 82.9 | 80.2 | 85.5 | 5.3 | −1.1 |
| FRL0 | Provence-Alpes-Côte d'Azur | 83.4 | 80.5 | 86.2 | 5.7 | −1.0 | 82.4 | 0.4 | 82.8 | 79.9 | 85.5 | 5.6 | −0.6 |
| FRG0 | Pays de la Loire | 83.4 | 80.1 | 86.6 | 6.5 | −0.3 | 83.1 | −0.4 | 82.7 | 79.5 | 85.7 | 6.2 | −0.7 |
| FRI1 | Aquitaine | 83.4 | 80.3 | 86.3 | 6.0 | −0.3 | 83.1 | −0.5 | 82.6 | 79.9 | 85.2 | 5.3 | −0.8 |
| FRF1 | Alsace | 83.3 | 80.5 | 85.9 | 5.4 | −0.4 | 82.9 | −0.6 | 82.3 | 79.7 | 84.8 | 5.1 | −1.0 |
| FRC2 | Franche-Comté | 82.8 | 79.7 | 85.9 | 6.2 | −0.4 | 82.4 | −0.3 | 82.1 | 79.2 | 85.0 | 5.8 | −0.7 |
| FRJ1 | Languedoc-Roussillon | 83.1 | 80.1 | 86.0 | 5.9 | −0.8 | 82.3 | −0.2 | 82.1 | 79.1 | 85.0 | 5.9 | −1.0 |
| FRK1 | Auvergne | 82.5 | 79.3 | 85.7 | 6.4 | −0.4 | 82.1 | −0.1 | 82.0 | 78.9 | 85.0 | 6.1 | −0.5 |
| FRI2 | Limousin | 82.3 | 78.9 | 85.7 | 6.8 | −0.2 | 82.1 | −0.1 | 82.0 | 78.9 | 85.0 | 6.1 | −0.3 |
| FRB0 | Centre-Val de Loire (Centre Region) | 82.7 | 79.6 | 85.7 | 6.1 | −0.5 | 82.2 | −0.3 | 81.9 | 79.0 | 84.9 | 5.9 | −0.8 |
| FRH0 | Brittany | 82.5 | 79.0 | 85.9 | 6.9 | −0.1 | 82.4 | −0.5 | 81.9 | 78.7 | 85.1 | 6.4 | −0.6 |
| FRI3 | Poitou-Charentes | 82.8 | 79.6 | 85.9 | 6.3 | −0.5 | 82.3 | −0.4 | 81.9 | 78.5 | 85.2 | 6.7 | −0.9 |
| FRC1 | Burgundy | 82.4 | 79.3 | 85.6 | 6.3 | −0.1 | 82.3 | −0.6 | 81.7 | 78.6 | 84.8 | 6.2 | −0.7 |
| FRF2 | Champagne-Ardenne | 81.8 | 78.4 | 85.1 | 6.7 | −0.6 | 81.2 | 0.2 | 81.4 | 78.2 | 84.6 | 6.4 | −0.4 |
| FRD1 | Lower Normandy | 82.5 | 79.0 | 85.8 | 6.8 | −0.8 | 81.7 | −0.4 | 81.3 | 78.1 | 84.6 | 6.5 | −1.2 |
| FRF3 | Lorraine | 82.0 | 79.0 | 84.9 | 5.9 | −0.7 | 81.3 | −0.1 | 81.2 | 78.4 | 84.0 | 5.6 | −0.8 |
| FRD2 | Upper Normandy | 81.8 | 78.5 | 85.0 | 6.5 | −0.4 | 81.4 | −0.4 | 81.0 | 77.9 | 84.0 | 6.1 | −0.8 |
| FRE2 | Picardy | 81.4 | 78.3 | 84.5 | 6.2 | −0.7 | 80.7 | 0.2 | 80.9 | 77.8 | 83.9 | 6.1 | −0.5 |
| FRE1 | Nord-Pas-de-Calais | 81.1 | 77.6 | 84.4 | 6.8 | −0.7 | 80.4 | 0.1 | 80.5 | 77.1 | 83.8 | 6.7 | −0.6 |
| FRY1 | Guadeloupe (incl. Saint Martin, in the Caribbean) | 81.8 | 77.8 | 85.5 | 7.7 | −4.2 | 77.6 | 2.6 | 80.2 | 76.1 | 84.0 | 7.9 | −1.6 |
| FRY2 | Martinique (in the Caribbean) | 82.1 | 78.7 | 85.2 | 6.5 | −3.9 | 78.2 | 1.8 | 80.0 | 77.0 | 82.8 | 5.8 | −2.1 |
| FRY4 | Réunion (in the Indian Ocean) | 81.3 | 77.5 | 85.0 | 7.5 | −0.4 | 80.9 | −0.9 | 80.0 | 76.8 | 83.1 | 6.3 | −1.3 |
| FRY3 | French Guiana (in South America) | — | — | — | — | — | 77.2 | 1.4 | 78.6 | 75.3 | 82.0 | 6.7 | — |
| FRY5 | Mayotte (in the Indian Ocean) | 75.9 | 75.5 | 76.3 | 0.8 | −4.4 | 71.5 | 2.8 | 74.3 | 74.0 | 74.4 | 0.4 | −1.6 |
Charts[edit]
![Development of life expectancy in France according to estimation of the World Bank Group[6]](//upload.wikimedia.org/wikipedia/commons/thumb/f/fb/Life_expectancy_by_WBG_-France.png/431px-Life_expectancy_by_WBG_-France.png) Development of life expectancy in France according to estimation of the World Bank Group[6]
Development of life expectancy in France according to estimation of the World Bank Group[6]![Life expectancy with calculated sex gap[6]](//upload.wikimedia.org/wikipedia/commons/thumb/9/95/Life_expectancy_by_WBG_-France_-diff.png/360px-Life_expectancy_by_WBG_-France_-diff.png) Life expectancy with calculated sex gap[6]
Life expectancy with calculated sex gap[6]![Life expectancy in comparison to presidents of the country[6]](//upload.wikimedia.org/wikipedia/commons/thumb/6/6d/Life_expectancy_by_WBG_-France_-leader.png/352px-Life_expectancy_by_WBG_-France_-leader.png) Life expectancy in comparison to presidents of the country[6]
Life expectancy in comparison to presidents of the country[6]![Life expectancy in France according to estimation of Our World in Data[7]](//upload.wikimedia.org/wikipedia/commons/thumb/5/5d/Life_expectancy_in_France.svg/319px-Life_expectancy_in_France.svg.png) Life expectancy in France according to estimation of Our World in Data[7]
Life expectancy in France according to estimation of Our World in Data[7]![Development of life expectancy in France in comparison to some big countries of the world[6]](//upload.wikimedia.org/wikipedia/commons/thumb/f/f5/Life_expectancy_in_some_big_countries.png/355px-Life_expectancy_in_some_big_countries.png) Development of life expectancy in France in comparison to some big countries of the world[6]
Development of life expectancy in France in comparison to some big countries of the world[6]![Development of life expectancy in France in comparison to the largest by population European countries[6]](//upload.wikimedia.org/wikipedia/commons/thumb/2/24/Life_expectancy_in_the_largest_European_countries.png/355px-Life_expectancy_in_the_largest_European_countries.png) Development of life expectancy in France in comparison to the largest by population European countries[6]
Development of life expectancy in France in comparison to the largest by population European countries[6]
![Development of life expectancy in France according to estimation of the World Bank Group[6]](http://upload.wikimedia.org/wikipedia/commons/thumb/f/fb/Life_expectancy_by_WBG_-France.png/431px-Life_expectancy_by_WBG_-France.png)
![Life expectancy with calculated sex gap[6]](http://upload.wikimedia.org/wikipedia/commons/thumb/9/95/Life_expectancy_by_WBG_-France_-diff.png/360px-Life_expectancy_by_WBG_-France_-diff.png)
![Life expectancy in comparison to presidents of the country[6]](http://upload.wikimedia.org/wikipedia/commons/thumb/6/6d/Life_expectancy_by_WBG_-France_-leader.png/352px-Life_expectancy_by_WBG_-France_-leader.png)
![Life expectancy in France according to estimation of Our World in Data[7]](http://upload.wikimedia.org/wikipedia/commons/thumb/5/5d/Life_expectancy_in_France.svg/319px-Life_expectancy_in_France.svg.png)
![Development of life expectancy in France in comparison to some big countries of the world[6]](http://upload.wikimedia.org/wikipedia/commons/thumb/f/f5/Life_expectancy_in_some_big_countries.png/355px-Life_expectancy_in_some_big_countries.png)
![Development of life expectancy in France in comparison to the largest by population European countries[6]](http://upload.wikimedia.org/wikipedia/commons/thumb/2/24/Life_expectancy_in_the_largest_European_countries.png/355px-Life_expectancy_in_the_largest_European_countries.png)
![Life expectancy and healthy life expectancy in France on the background of other countries of the world in 2019[8]](//upload.wikimedia.org/wikipedia/commons/thumb/c/c2/Healthy_life_expectancy_bar_chart_-world.png/529px-Healthy_life_expectancy_bar_chart_-world.png) Life expectancy and healthy life expectancy in France on the background of other countries of the world in 2019[8]
Life expectancy and healthy life expectancy in France on the background of other countries of the world in 2019[8]![Life expectancy and healthy life expectancy for males and females separately[8]](//upload.wikimedia.org/wikipedia/commons/thumb/d/d0/Healthy_life_expectancy_bar_chart_-world_-sex.png/529px-Healthy_life_expectancy_bar_chart_-world_-sex.png) Life expectancy and healthy life expectancy for males and females separately[8]
Life expectancy and healthy life expectancy for males and females separately[8]
![Life expectancy and healthy life expectancy in France on the background of other countries of the world in 2019[8]](http://upload.wikimedia.org/wikipedia/commons/thumb/c/c2/Healthy_life_expectancy_bar_chart_-world.png/529px-Healthy_life_expectancy_bar_chart_-world.png)
![Life expectancy and healthy life expectancy for males and females separately[8]](http://upload.wikimedia.org/wikipedia/commons/thumb/d/d0/Healthy_life_expectancy_bar_chart_-world_-sex.png/529px-Healthy_life_expectancy_bar_chart_-world_-sex.png)
![Life expectancy and healthy life expectancy in France on the background of other countries of Europe in 2019[8]](//upload.wikimedia.org/wikipedia/commons/thumb/9/93/Healthy_life_expectancy_bar_chart_-Europe.png/530px-Healthy_life_expectancy_bar_chart_-Europe.png) Life expectancy and healthy life expectancy in France on the background of other countries of Europe in 2019[8]
Life expectancy and healthy life expectancy in France on the background of other countries of Europe in 2019[8]![Life expectancy and healthy life expectancy for males and females separately[8]](//upload.wikimedia.org/wikipedia/commons/thumb/1/13/Healthy_life_expectancy_bar_chart_-Europe_-sex.png/530px-Healthy_life_expectancy_bar_chart_-Europe_-sex.png) Life expectancy and healthy life expectancy for males and females separately[8]
Life expectancy and healthy life expectancy for males and females separately[8]
![Life expectancy and healthy life expectancy in France on the background of other countries of Europe in 2019[8]](http://upload.wikimedia.org/wikipedia/commons/thumb/9/93/Healthy_life_expectancy_bar_chart_-Europe.png/530px-Healthy_life_expectancy_bar_chart_-Europe.png)
![Life expectancy and healthy life expectancy for males and females separately[8]](http://upload.wikimedia.org/wikipedia/commons/thumb/1/13/Healthy_life_expectancy_bar_chart_-Europe_-sex.png/530px-Healthy_life_expectancy_bar_chart_-Europe_-sex.png)
See also[edit]
Wikimedia Commons has media related to Life expectancy charts for France.
- List of countries by life expectancy
- List of European countries by life expectancy
- Administrative divisions of France
- Demographics of France
References[edit]
- ^ Jump up to: Jump up to: a b c d "Espérance de vie en 2022: Comparaisons régionales et départementales" [Life expectancy in 2022: comparison of regions and departments]. National Institute of Statistics and Economic Studies (France) (in French). Retrieved 2024-02-01.
- ^ Jump up to: Jump up to: a b "Espérance de vie en 2019: Comparaisons régionales et départementales" [Life expectancy in 2019: comparison of regions and departments]. National Institute of Statistics and Economic Studies (France) (in French). Archived from the original on 2021-04-12. Retrieved 2024-03-29.
- ^ Jump up to: Jump up to: a b "Espérance de vie en 2023: Comparaisons régionales et départementales" [Life expectancy in 2023: comparison of regions and departments]. National Institute of Statistics and Economic Studies (France) (in French). Retrieved 2024-03-29.
- ^ Jump up to: Jump up to: a b "Life expectancy at birth by sex and NUTS 2 region". Eurostat. 14 March 2024. Retrieved 28 March 2024. — Dataset
- ^ Jump up to: Jump up to: a b "Life expectancy at birth by sex and NUTS 2 region". Eurostat. 14 March 2024. Retrieved 28 March 2024. — Table. For visualization use tab "Map"
- ^ Jump up to: Jump up to: a b c d e "Life expectancy at birth, total - France". World Bank Group.
- ^ "Life expectancy at birth: France". Our World in Data.
- ^ Jump up to: Jump up to: a b c d "Life expectancy and Healthy life expectancy, data by country". World Health Organization. 2020. Retrieved 1 February 2024.