Tropical cyclone

| Part of a series on |
| Tropical cyclones |
|---|
 |
| Outline Media coverage |
A tropical cyclone is a rapidly rotating storm system with a low-pressure center, a closed low-level atmospheric circulation, strong winds, and a spiral arrangement of thunderstorms that produce heavy rain and squalls. Depending on its location and strength, a tropical cyclone is called a hurricane (/ˈhʌrɪkən, -keɪn/), typhoon (/taɪˈfuːn/), tropical storm, cyclonic storm, tropical depression, or simply cyclone. A hurricane is a strong tropical cyclone that occurs in the Atlantic Ocean or northeastern Pacific Ocean. A typhoon occurs in the northwestern Pacific Ocean. In the Indian Ocean and South Pacific, comparable storms are referred to as "tropical cyclones". In modern times, on average around 80 to 90 named tropical cyclones form each year around the world, over half of which develop hurricane-force winds of 65 kn (120 km/h; 75 mph) or more.[1]
Tropical cyclones typically form over large bodies of relatively warm water. They derive their energy through the evaporation of water from the ocean surface, which ultimately condenses into clouds and rain when moist air rises and cools to saturation. This energy source differs from that of mid-latitude cyclonic storms, such as nor'easters and European windstorms, which are powered primarily by horizontal temperature contrasts. Tropical cyclones are typically between 100 and 2,000 km (62 and 1,243 mi) in diameter.
The strong rotating winds of a tropical cyclone are a result of the conservation of angular momentum imparted by the Earth's rotation as air flows inwards toward the axis of rotation. As a result, cyclones rarely form within 5° of the equator.Tropical cyclones are very rare in the South Atlantic (although occasional examples do occur) due to consistently strong wind shear and a weak Intertropical Convergence Zone. In contrast, the African easterly jet and areas of atmospheric instability give rise to cyclones in the Atlantic Ocean and Caribbean Sea.
Heat energy from the ocean, acts as the accelerator for tropical cyclones. This causes inland regions to suffer far less damage from cyclones than coastal regions, although the impacts of flooding are felt across the board. Coastal damage may be caused by strong winds and rain, high waves (due to winds), storm surges (due to wind and severe pressure changes), and the potential of spawning tornadoes.
Tropical cyclones draw in air from a large area and concentrate the water content of that air into precipitation over a much smaller area. This replenishing of moisture-bearing air after rain may cause multi-hour or multi-day extremely heavy rain up to 40 km (25 mi) from the coastline, far beyond the amount of water that the local atmosphere holds at any one time. This in turn can lead to river flooding, overland flooding, and a general overwhelming of local water control structures across a large area.
Climate change can affect tropical cyclones in different ways due to its effects on the water cycle. Scientists theorize that climate change can exacerbate the impact of tropical cyclones by increasing their duration, occurrence, and intensity due to the warming of ocean waters.[2][3]
Definition and terminology
A tropical cyclone is the generic term for a warm-cored, non-frontal synoptic-scale low-pressure system over tropical or subtropical waters around the world.[4][5] The systems generally have a well-defined center which is surrounded by deep atmospheric convection and a closed wind circulation at the surface.[4] A tropical cyclone is generally deemed to have formed once mean surface winds in excess of 35 kn (65 km/h; 40 mph) are observed.[1] It is assumed at this stage that a tropical cyclone has become self-sustaining and can continue to intensify without any help from its environment.[1]
Depending on its location and strength, a tropical cyclone is referred to by different names, including hurricane, typhoon, tropical storm, cyclonic storm, tropical depression, or simply cyclone. A hurricane is a strong tropical cyclone that occurs in the Atlantic Ocean or northeastern Pacific Ocean, and a typhoon occurs in the northwestern Pacific Ocean. In the Indian Ocean and South Pacific, comparable storms are referred to as "tropical cyclones", and such storms in the Indian Ocean can also be called "severe cyclonic storms".
Tropical refers to the geographical origin of these systems, which form almost exclusively over tropical seas. Cyclone refers to their winds moving in a circle, whirling round their central clear eye, with their surface winds blowing counterclockwise in the Northern Hemisphere and clockwise in the Southern Hemisphere. The opposite direction of circulation is due to the Coriolis effect.
Formation

Tropical cyclones tend to develop during the summer, but have been noted in nearly every month in most tropical cyclone basins. Tropical cyclones on either side of the Equator generally have their origins in the Intertropical Convergence Zone, where winds blow from either the northeast or southeast.[6] Within this broad area of low-pressure, air is heated over the warm tropical ocean and rises in discrete parcels, which causes thundery showers to form.[6] These showers dissipate quite quickly; however, they can group together into large clusters of thunderstorms.[6] This creates a flow of warm, moist, rapidly rising air, which starts to rotate cyclonically as it interacts with the rotation of the earth.[6]
Several factors are required for these thunderstorms to develop further, including sea surface temperatures of around 27 °C (81 °F) and low vertical wind shear surrounding the system,[6][7] atmospheric instability, high humidity in the lower to middle levels of the troposphere, enough Coriolis force to develop a low-pressure center, and a pre-existing low-level focus or disturbance.[7]There is a limit on tropical cyclone intensity which is strongly related to the water temperatures along its path.[8] and upper-level divergence.[9]An average of 86 tropical cyclones of tropical storm intensity form annually worldwide. Of those, 47 reach strength higher than 119 km/h (74 mph), and 20 become intense tropical cyclones (at least Category 3 intensity on the Saffir–Simpson scale).[10]
Climate oscillations such as El Niño–Southern Oscillation (ENSO) and the Madden–Julian oscillation modulate the timing and frequency of tropical cyclone development.[11][12][13][14] Rossby waves can aid in the formation of a new tropical cyclone by disseminating the energy of an existing, mature storm.[15][16] Kelvin waves can contribute to tropical cyclone formation by regulating the development of the westerlies.[17] Cyclone formation is usually reduced 3 days prior to the wave's crest and increased during the 3 days after.[18]
Formation regions and warning centers
| Basin | Warning center | Area of responsibility | Notes |
|---|---|---|---|
| Northern Hemisphere | |||
| North Atlantic | United States National Hurricane Center (Miami) | Equator northward, African Coast – 140°W | [19] |
| Eastern Pacific | United States Central Pacific Hurricane Center (Honolulu) | Equator northward, 140–180°W | [19] |
| Western Pacific | Japan Meteorological Agency | Equator – 60°N, 180–100°E | [20] |
| North Indian Ocean | India Meteorological Department | Equator northwards, 100–40°E | [21] |
| Southern Hemisphere | |||
| South-West Indian Ocean | Météo-France Reunion | Equator – 40°S, African Coast – 90°E | [22] |
| Australian region | Indonesian Meteorology, Climatology, and Geophysical Agency (BMKG) | Equator – 10°S, 90–141°E | [23] |
| Papua New Guinea National Weather Service | Equator – 10°S, 141–160°E | [23] | |
| Australian Bureau of Meteorology | 10–40°S, 90–160°E | [23] | |
| Southern Pacific | Fiji Meteorological Service | Equator – 25°S, 160°E – 120°W | [23] |
| Meteorological Service of New Zealand | 25–40°S, 160°E – 120°W | [23] | |
The majority of tropical cyclones each year form in one of seven tropical cyclone basins, which are monitored by a variety of meteorological services and warning centres.[1] Ten of these warning centres worldwide are designated as either a Regional Specialized Meteorological Centre or a Tropical Cyclone Warning Centre by the World Meteorological Organization's (WMO) tropical cyclone programme.[1] These warning centres issue advisories which provide basic information and cover a systems present, forecast position, movement and intensity, in their designated areas of responsibility.[1] Meteorological services around the world are generally responsible for issuing warnings for their own country, however, there are exceptions, as the United States National Hurricane Center and Fiji Meteorological Service issue alerts, watches and warnings for various island nations in their areas of responsibility.[1][23] The United States Joint Typhoon Warning Center and Fleet Weather Center also publicly issue warnings, about tropical cyclones on behalf of the United States Government.[1] The Brazilian Navy Hydrographic Center names South Atlantic tropical cyclones, however the South Atlantic is not a major basin, and not an official basin according to the WMO.[24]
Intensity
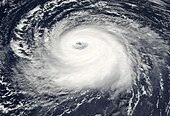
Tropical cyclone intensity is based on wind speeds and pressure; relationships between winds and pressure are often used in determining the intensity of a storm.[25] Tropical cyclone scales such as the Saffir-Simpson Hurricane Wind Scale and Australia's scale (Bureau of Meteorology) only use wind speed for determining the category of a storm.[26][27] The most intense storm on record is Typhoon Tip in the northwestern Pacific Ocean in 1979, which reached a minimum pressure of 870 hPa (26 inHg) and maximum sustained wind speeds of 165 kn (85 m/s; 305 km/h; 190 mph).[28] The highest maximum sustained wind speed ever recorded was 185 kn (95 m/s; 345 km/h; 215 mph) in Hurricane Patricia in 2015—the most intense cyclone ever recorded in the Western Hemisphere.[29]
Factors that influence intensity
Warm sea surface temperatures are required in order for tropical cyclones to form and strengthen. The commonly-accepted minimum temperature range for this to occur is 26–27 °C (79–81 °F), however, multiple studies have proposed a lower minimum of 25.5 °C (77.9 °F).[30][31] Higher sea surface temperatures result in faster intensification rates and sometimes even rapid intensification.[32] High ocean heat content, also known as Tropical Cyclone Heat Potential, allows storms to achieve a higher intensity.[33] Most tropical cyclones that experience rapid intensification are traversing regions of high ocean heat content rather than lower values.[34] High ocean heat content values can help to offset the oceanic cooling caused by the passage of a tropical cyclone, limiting the effect this cooling has on the storm.[35] Faster-moving systems are able to intensify to higher intensities with lower ocean heat content values. Slower-moving systems require higher values of ocean heat content to achieve the same intensity.[34]
The passage of a tropical cyclone over the ocean causes the upper layers of the ocean to cool substantially, a process known as upwelling,[36] which can negatively influence subsequent cyclone development. This cooling is primarily caused by wind-driven mixing of cold water from deeper in the ocean with the warm surface waters. This effect results in a negative feedback process that can inhibit further development or lead to weakening. Additional cooling may come in the form of cold water from falling raindrops (this is because the atmosphere is cooler at higher altitudes). Cloud cover may also play a role in cooling the ocean, by shielding the ocean surface from direct sunlight before and slightly after the storm passage. All these effects can combine to produce a dramatic drop in sea surface temperature over a large area in just a few days.[37] Conversely, the mixing of the sea can result in heat being inserted in deeper waters, with potential effects on global climate.[38]
Vertical wind shear decreases tropical cyclone predicability, with storms exhibiting wide range of responses in the presence of shear.[39] Wind shear often negatively affects tropical cyclone intensification by displacing moisture and heat from a system's center.[40] Low levels of vertical wind shear are most optimal for strengthening, while stronger wind shear induces weakening.[41][42] Dry air entraining into a tropical cyclone's core has a negative effect on its development and intensity by diminishing atmospheric convection and introducing asymmetries in the storm's structure.[43][44][45] Symmetric, strong outflow leads to a faster rate of intensification than observed in other systems by mitigating local wind shear.[46][47][48] Weakening outflow is associated with the weakening of rainbands within a tropical cyclone.[49] Tropical cyclones may still intensify, even rapidly, in the presence of moderate or strong wind shear depending on the evolution and structure of the storm's convection.[50][51]
The size of tropical cyclones plays a role in how quickly they intensify. Smaller tropical cyclones are more prone to rapid intensification than larger ones.[52] The Fujiwhara effect, which involves interaction between two tropical cyclones, can weaken and ultimately result in the dissipation of the weaker of two tropical cyclones by reducing the organization of the system's convection and imparting horizontal wind shear.[53] Tropical cyclones typically weaken while situated over a landmass because conditions are often unfavorable as a result of the lack of oceanic forcing.[54] The Brown ocean effect can allow a tropical cyclone to maintain or increase its intensity following landfall, in cases where there has been copious rainfall, through the release of latent heat from the saturated soil.[55] Orographic lift can cause an significant increase in the intensity of the convection of a tropical cyclone when its eye moves over a mountain, breaking the capped boundary layer that had been restraining it.[56] Jet streams can both enhance and inhibit tropical cyclone intensity by influencing the storm's outflow as well as vertical wind shear.[57][58]
Rapid intensification
On occasion, tropical cyclones may undergo a process known as rapid intensification, a period in which the maximum sustained winds of a tropical cyclone increase by 30 kn (56 km/h; 35 mph) or more within 24 hours.[59] Similarly, rapid deepening in tropical cyclones is defined as a minimum sea surface pressure decrease of 1.75 hPa (0.052 inHg) per hour or 42 hPa (1.2 inHg) within a 24-hour period; explosive deepening occurs when the surface pressure decreases by 2.5 hPa (0.074 inHg) per hour for at least 12 hours or 5 hPa (0.15 inHg) per hour for at least 6 hours.[60] For rapid intensification to occur, several conditions must be in place. Water temperatures must be extremely high (near or above 30 °C (86 °F)), and water of this temperature must be sufficiently deep such that waves do not upwell cooler waters to the surface. On the other hand, Tropical Cyclone Heat Potential is one of such non-conventional subsurface oceanographic parameters influencing the cyclone intensity. Wind shear must be low; when wind shear is high, the convection and circulation in the cyclone will be disrupted. Usually, an anticyclone in the upper layers of the troposphere above the storm must be present as well—for extremely low surface pressures to develop, air must be rising very rapidly in the eyewall of the storm, and an upper-level anticyclone helps channel this air away from the cyclone efficiently.[61] However, some cyclones such as Hurricane Epsilon have rapidly intensified despite relatively unfavorable conditions.[62][63]
Dissipation
There are a number of ways a tropical cyclone can weaken, dissipate, or lose its tropical characteristics. These include making landfall, moving over cooler water, encountering dry air, or interacting with other weather systems; however, once a system has dissipated or lost its tropical characteristics, its remnants could regenerate a tropical cyclone if environmental conditions become favorable.[64][65]
A tropical cyclone can dissipate when it moves over waters significantly cooler than 26.5 °C (79.7 °F). This will deprive the storm of such tropical characteristics as a warm core with thunderstorms near the center, so that it becomes a remnant low-pressure area. Remnant systems may persist for several days before losing their identity. This dissipation mechanism is most common in the eastern North Pacific. Weakening or dissipation can also occur if a storm experiences vertical wind shear which causes the convection and heat engine to move away from the center; this normally ceases the development of a tropical cyclone.[66] In addition, its interaction with the main belt of the Westerlies, by means of merging with a nearby frontal zone, can cause tropical cyclones to evolve into extratropical cyclones. This transition can take 1–3 days.[67]
Should a tropical cyclone make landfall or pass over an island, its circulation could start to break down, especially if it encounters mountainous terrain.[68] When a system makes landfall on a large landmass, it is cut off from its supply of warm moist maritime air and starts to draw in dry continental air.[68] This, combined with the increased friction over land areas, leads to the weakening and dissipation of the tropical cyclone.[68] Over a mountainous terrain, a system can quickly weaken; however, over flat areas, it may endure for two to three days before circulation breaks down and dissipates.[68]
Over the years, there have been a number of techniques considered to try to artificially modify tropical cyclones.[69] These techniques have included using nuclear weapons, cooling the ocean with icebergs, blowing the storm away from land with giant fans, and seeding selected storms with dry ice or silver iodide.[69] These techniques, however, fail to appreciate the duration, intensity, power or size of tropical cyclones.[69]
Methods for assessing intensity
A variety of methods or techniques, including surface, satellite, and aerial, are used to assess the intensity of a tropical cyclone. Reconnaissance aircraft fly around and through tropical cyclones, outfitted with specialized instruments, to collect information that can be used to ascertain the winds and pressure of a system.[1] Tropical cyclones possess winds of different speeds at different heights. Winds recorded at flight level can be converted to find the wind speeds at the surface.[70] Surface observations, such as ship reports, land stations, mesonets, coastal stations, and buoys, can provide information on a tropical cyclone's intensity or the direction it is traveling.[1] Wind-pressure relationships (WPRs) are used as a way to determine the pressure of a storm based on its wind speed. Several different methods and equations have been proposed to calculate WPRs.[71][72] Tropical cyclones agencies each use their own, fixed WPR, which can result in inaccuracies between agencies that are issuing estimates on the same system.[72] The ASCAT is a scatterometer used by the MetOp satellites to map the wind field vectors of tropical cyclones.[1] The SMAP uses an L-band radiometer channel to determine the wind speeds of tropical cyclones at the ocean surface, and has been shown to be reliable at higher intensities and under heavy rainfall conditions, unlike scatterometer-based and other radiometer-based instruments.[73]
The Dvorak technique plays a large role in both the classification of a tropical cyclone and the determination of its intensity. Used in warning centers, the method was developed by Vernon Dvorak in the 1970s, and uses both visible and infrared satellite imagery in the assessment of tropical cyclone intensity. The Dvorak technique uses a scale of "T-numbers", scaling in increments of 0.5 from T1.0 to T8.0. Each T-number has an intensity assigned to it, with larger T-numbers indicating a stronger system. Tropical cyclones are assessed by forecasters according to an array of patterns, including curved banding features, shear, central dense overcast, and eye, in order to determine the T-number and thus assess the intensity of the storm.[74] The Cooperative Institute for Meteorological Satellite Studies works to develop and improve automated satellite methods, such as the Advanced Dvorak Technique (ADT) and SATCON. The ADT, used by a large number of forecasting centers, uses infrared geostationary satellite imagery and an algorithm based upon the Dvorak technique to assess the intensity of tropical cyclones. The ADT has a number of differences from the conventional Dvorak technique, including changes to intensity constraint rules and the usage of microwave imagery to base a system's intensity upon its internal structure, which prevents the intensity from leveling off before an eye emerges in infrared imagery.[75] The SATCON weights estimates from various satellite-based systems and microwave sounders, accounting for the strengths and flaws in each individual estimate, to produce a consensus estimate of a tropical cyclone's intensity which can be more reliable than the Dvorak technique at times.[76][77]
Intensity metrics
Multiple intensity metrics are used, including accumulated cyclone energy (ACE), the Hurricane Surge Index, the Hurricane Severity Index, the Power Dissipation Index (PDI), and integrated kinetic energy (IKE). ACE is a metric of the total energy a system has exerted over its lifespan. ACE is calculated by summing the squares of a cyclone's sustained wind speed, every six hours as long as the system is at or above tropical storm intensity and either tropical or subtropical.[78] The calculation of the PDI is similar in nature to ACE, with the major difference being that wind speeds are cubed rather than squared.[79] The Hurricane Surge Index is a metric of the potential damage a storm may inflict via storm surge. It is calculated by squaring the dividend of the storm's wind speed and a climatological value (33 m/s or 74 mph), and then multiplying that quantity by the dividend of the radius of hurricane-force winds and its climatological value (96.6 km or 60.0 mi). This can be represented in equation form as:

where v is the storm's wind speed and r is the radius of hurricane-force winds.[80] The Hurricane Severity Index is a scale that can assign up to 50 points to a system; up to 25 points come from intensity, while the other 25 come from the size of the storm's wind field.[81] The IKE model measures the destructive capability of a tropical cyclone via winds, waves, and surge. It is calculated as:

where p is the density of air, u is a sustained surface wind speed value, and dv is the volume element.[81][82]
Classification and naming
Classification
Around the world, tropical cyclones are classified in different ways, based on the location (tropical cyclone basins), the structure of the system and its intensity. For example, within the Northern Atlantic and Eastern Pacific basins, a tropical cyclone with wind speeds of over 65 kn (120 km/h; 75 mph) is called a hurricane, while it is called a typhoon or a severe cyclonic storm within the Western Pacific or North Indian oceans.[19][20][21] When a hurricane passes west across the International Dateline in the Northern Hemisphere, it becomes known as a typhoon. This happened in 2014 for Hurricane Genevieve, which became Typhoon Genevieve.[83] Within the Southern Hemisphere, it is either called a hurricane, tropical cyclone or a severe tropical cyclone, depending on if it is located within the South Atlantic, South-West Indian Ocean, Australian region or the South Pacific Ocean.[22][23] The descriptors for tropical cyclones with wind speeds below 65 kn (120 km/h; 75 mph) also vary by tropical cyclone basin and may be further subdivided into categories such as "tropical storm", "cyclonic storm", "tropical depression", or "deep depression".[20][21][19]
Naming
The practice of using given names to identify tropical cyclones dates back to the late 1800s and early 1900s and gradually superseded the existing system—simply naming cyclones based on what they hit.[84][85] The system currently used provides positive identification of severe weather systems in a brief form, that is readily understood and recognized by the public.[84][85] The credit for the first usage of personal names for weather systems is generally given to the Queensland Government Meteorologist Clement Wragge who named systems between 1887 and 1907.[84][85] This system of naming weather systems subsequently fell into disuse for several years after Wragge retired, until it was revived in the latter part of World War II for the Western Pacific.[84][85] Formal naming schemes have subsequently been introduced for the North and South Atlantic, Eastern, Central, Western and Southern Pacific basins as well as the Australian region and Indian Ocean.[85]
At present, tropical cyclones are officially named by one of twelve meteorological services and retain their names throughout their lifetimes to provide ease of communication between forecasters and the general public regarding forecasts, watches, and warnings.[84] Since the systems can last a week or longer and more than one can be occurring in the same basin at the same time, the names are thought to reduce the confusion about what storm is being described.[84] Names are assigned in order from predetermined lists with one, three, or ten-minute sustained wind speeds of more than 65 km/h (40 mph) depending on which basin it originates.[19][21][22] However, standards vary from basin to basin with some tropical depressions named in the Western Pacific, while tropical cyclones have to have a significant amount of gale-force winds occurring around the center before they are named within the Southern Hemisphere.[22][23] The names of significant tropical cyclones in the North Atlantic Ocean, Pacific Ocean, and Australian region are retired from the naming lists and replaced with another name.[19][20][23] Tropical cyclones that develop around the world are assigned an identification code consisting of a two-digit number and suffix letter by the warning centers that monitor them.[23][86]
Related cyclone types
In addition to tropical cyclones, there are two other classes of cyclones within the spectrum of cyclone types. These kinds of cyclones, known as extratropical cyclones and subtropical cyclones, can be stages a tropical cyclone passes through during its formation or dissipation.[87] An extratropical cyclone is a storm that derives energy from horizontal temperature differences, which are typical in higher latitudes. A tropical cyclone can become extratropical as it moves toward higher latitudes if its energy source changes from heat released by condensation to differences in temperature between air masses; although not as frequently, an extratropical cyclone can transform into a subtropical storm, and from there into a tropical cyclone.[88] From space, extratropical storms have a characteristic "comma-shaped" cloud pattern.[89] Extratropical cyclones can also be dangerous when their low-pressure centers cause powerful winds and high seas.[90]
A subtropical cyclone is a weather system that has some characteristics of a tropical cyclone and some characteristics of an extratropical cyclone. They can form in a wide band of latitudes, from the equator to 50°. Although subtropical storms rarely have hurricane-force winds, they may become tropical in nature as their cores warm.[91]
Structure
Eye and center

At the center of a mature tropical cyclone, air sinks rather than rises. For a sufficiently strong storm, air may sink over a layer deep enough to suppress cloud formation, thereby creating a clear "eye". Weather in the eye is normally calm and free of convective clouds, although the sea may be extremely violent.[92] The eye is normally circular and is typically 30–65 km (19–40 mi) in diameter, though eyes as small as 3 km (1.9 mi) and as large as 370 km (230 mi) have been observed.[93][94]
The cloudy outer edge of the eye is called the "eyewall". The eyewall typically expands outward with height, resembling an arena football stadium; this phenomenon is sometimes referred to as the "stadium effect".[94] The eyewall is where the greatest wind speeds are found, air rises most rapidly, clouds reach their highest altitude, and precipitation is the heaviest. The heaviest wind damage occurs where a tropical cyclone's eyewall passes over land.[92]
In a weaker storm, the eye may be obscured by the central dense overcast, which is the upper-level cirrus shield that is associated with a concentrated area of strong thunderstorm activity near the center of a tropical cyclone.[95]
The eyewall may vary over time in the form of eyewall replacement cycles, particularly in intense tropical cyclones. Outer rainbands can organize into an outer ring of thunderstorms that slowly moves inward, which is believed to rob the primary eyewall of moisture and angular momentum. When the primary eyewall weakens, the tropical cyclone weakens temporarily. The outer eyewall eventually replaces the primary one at the end of the cycle, at which time the storm may return to its original intensity.[96]
Size
There are a variety of metrics commonly used to measure storm size. The most common metrics include the radius of maximum wind, the radius of 34-knot (17 m/s; 63 km/h; 39 mph) wind (i.e. gale force), the radius of outermost closed isobar (ROCI), and the radius of vanishing wind.[97][98] An additional metric is the radius at which the cyclone's relative vorticity field decreases to 1×10⁻⁵ s−1.[94]
| ROCI (Diameter) | Type |
|---|---|
| Less than 2 degrees latitude | Very small/minor |
| 2 to 3 degrees of latitude | Small |
| 3 to 6 degrees of latitude | Medium/average/normal |
| 6 to 8 degrees of latitude | Large |
| Over 8 degrees of latitude | Very large[99] |
On Earth, tropical cyclones span a large range of sizes, from 100–2,000 km (62–1,243 mi) as measured by the radius of vanishing wind. They are largest on average in the northwest Pacific Ocean basin and smallest in the northeastern Pacific Ocean basin.[100] If the radius of outermost closed isobar is less than two degrees of latitude (222 km (138 mi)), then the cyclone is "very small" or a "midget". A radius of 3–6 latitude degrees (333–670 km (207–416 mi)) is considered "average sized". "Very large" tropical cyclones have a radius of greater than 8 degrees (888 km (552 mi)).[99] Observations indicate that size is only weakly correlated to variables such as storm intensity (i.e. maximum wind speed), radius of maximum wind, latitude, and maximum potential intensity.[98][100] Typhoon Tip is the largest cyclone on record, with tropical storm-force winds 2,170 km (1,350 mi) in diameter. The smallest storm on record is Tropical Storm Marco of 2008, which generated tropical storm-force winds only 37 km (23 mi) in diameter.[101]
Movement
The movement of a tropical cyclone (i.e. its "track") is typically approximated as the sum of two terms: "steering" by the background environmental wind and "beta drift".[102] Some tropical cyclones can move across large distances, such as Hurricane John, the second longest-lasting tropical cyclone on record, which traveled 13,280 km (8,250 mi), the longest track of any Northern Hemisphere tropical cyclone, over its 31-day lifespan in 1994.[103][104][105]
Environmental steering
Environmental steering is the primary influence on the motion of tropical cyclones.[106] It represents the movement of the storm due to prevailing winds and other wider environmental conditions, similar to "leaves carried along by a stream".[107]
Physically, the winds, or flow field, in the vicinity of a tropical cyclone may be treated as having two parts: the flow associated with the storm itself, and the large-scale background flow of the environment.[106] Tropical cyclones can be treated as local maxima of vorticity suspended within the large-scale background flow of the environment.[108] In this way, tropical cyclone motion may be represented to first-order as advection of the storm by the local environmental flow.[109] This environmental flow is termed the "steering flow" and is the dominant influence on tropical cyclone motion.[106] The strength and direction of the steering flow can be approximated as a vertical integration of the winds blowing horizontally in the cyclone's vicinity, weighted by the altitude at which those winds are occurring. Because winds can vary with height, determining the steering flow precisely can be difficult.
The pressure altitude at which the background winds are most correlated with a tropical cyclone's motion is known as the "steering level".[108] The motion of stronger tropical cyclones is more correlated with the background flow averaged across a thicker portion of troposphere compared to weaker tropical cyclones whose motion is more correlated with the background flow averaged across a narrower extent of the lower troposphere.[110] When wind shear and latent heat release is present, tropical cyclones tend to move towards regions where potential vorticity is increasing most quickly.[111]
Climatologically, tropical cyclones are steered primarily westward by the east-to-west trade winds on the equatorial side of the subtropical ridge—a persistent high-pressure area over the world's subtropical oceans.[107] In the tropical North Atlantic and Northeast Pacific oceans, the trade winds steer tropical easterly waves westward from the African coast toward the Caribbean Sea, North America, and ultimately into the central Pacific Ocean before the waves dampen out.[112] These waves are the precursors to many tropical cyclones within this region.[113] In contrast, in the Indian Ocean and Western Pacific in both hemispheres, tropical cyclogenesis is influenced less by tropical easterly waves and more by the seasonal movement of the Intertropical Convergence Zone and the monsoon trough.[114] Other weather systems such as mid-latitude troughs and broad monsoon gyres can also influence tropical cyclone motion by modifying the steering flow.[110][115]
Beta drift
In addition to environmental steering, a tropical cyclone will tend to drift poleward and westward, a motion known as "beta drift".[116] This motion is due to the superposition of a vortex, such as a tropical cyclone, onto an environment in which the Coriolis force varies with latitude, such as on a sphere or beta plane.[117] The magnitude of the component of tropical cyclone motion associated with the beta drift ranges between 1–3 m/s (3.6–10.8 km/h; 2.2–6.7 mph) and tends to be larger for more intense tropical cyclones and at higher latitudes. It is induced indirectly by the storm itself as a result of feedback between the cyclonic flow of the storm and its environment.[118][116]
Physically, the cyclonic circulation of the storm advects environmental air poleward east of center and equatorial west of center. Because air must conserve its angular momentum, this flow configuration induces a cyclonic gyre equatorward and westward of the storm center and an anticyclonic gyre poleward and eastward of the storm center. The combined flow of these gyres acts to advect the storm slowly poleward and westward. This effect occurs even if there is zero environmental flow.[119][120] Due to a direct dependence of the beta drift on angular momentum, the size of a tropical cyclone can affect the influence of beta drift on its motion; beta drift imparts a greater influence on the movement of larger tropical cyclones than that of smaller ones.[121][122]
Multiple storm interaction
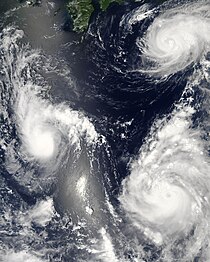
A third component of motion that occurs relatively infrequently involves the interaction of multiple tropical cyclones. When two cyclones approach one another, their centers will begin orbiting cyclonically about a point between the two systems. Depending on their separation distance and strength, the two vortices may simply orbit around one another, or else may spiral into the center point and merge. When the two vortices are of unequal size, the larger vortex will tend to dominate the interaction, and the smaller vortex will orbit around it. This phenomenon is called the Fujiwhara effect, after Sakuhei Fujiwhara.[123]
Interaction with the mid-latitude westerlies

Though a tropical cyclone typically moves from east to west in the tropics, its track may shift poleward and eastward either as it moves west of the subtropical ridge axis or else if it interacts with the mid-latitude flow, such as the jet stream or an extratropical cyclone. This motion, termed "recurvature", commonly occurs near the western edge of the major ocean basins, where the jet stream typically has a poleward component and extratropical cyclones are common.[124] An example of tropical cyclone recurvature was Typhoon Ioke in 2006.[125]
Effects
Natural phenomena caused or worsened by tropical cyclones
Tropical cyclones out at sea cause large waves, heavy rain, floods and high winds, disrupting international shipping and, at times, causing shipwrecks.[126] Tropical cyclones stir up water, leaving a cool wake behind them, which causes the region to be less favorable for subsequent tropical cyclones.[37] On land, strong winds can damage or destroy vehicles, buildings, bridges, and other outside objects, turning loose debris into deadly flying projectiles. The storm surge, or the increase in sea level due to the cyclone, is typically the worst effect from landfalling tropical cyclones, historically resulting in 90% of tropical cyclone deaths.[127] Cyclone Mahina produced the highest storm surge on record, 13 m (43 ft), at Bathurst Bay, Queensland, Australia, in March 1899.[128] Other ocean-based hazards that tropical cyclones produce are rip currents and undertow. These hazards can occur hundreds of kilometers (hundreds of miles) away from the center of a cyclone, even if other weather conditions are favorable.[129][130]The broad rotation of a landfalling tropical cyclone, and vertical wind shear at its periphery, spawns tornadoes. Tornadoes can also be spawned as a result of eyewall mesovortices, which persist until landfall.[131] Hurricane Ivan produced 120 tornadoes, more than any other tropical cyclone.[132] Lightning activity is produced within tropical cyclones; this activity is more intense within stronger storms and closer to and within the storm's eyewall.[133][134] Tropical cyclones can increase the amount of snowfall a region experiences by delivering additional moisture.[135] Wildfires can be worsened when a nearby storm fans their flames with its strong winds.[136][137]
Effect on property and human life

Tropical cyclones regularly affect the coastlines of most of Earth's major bodies of water along the Atlantic, Pacific, and Indian oceans. Tropical cyclones have caused significant destruction and loss of human life, resulting in about 2 million deaths since the 19th century.[139] Large areas of standing water caused by flooding lead to infection, as well as contributing to mosquito-borne illnesses. Crowded evacuees in shelters increase the risk of disease propagation.[127] Tropical cyclones significantly interrupt infrastructure, leading to power outages, bridge and road destruction, and the hampering of reconstruction efforts.[127][140][141] Winds and water from storms can damage or destroy homes, buildings, and other manmade structures.[142][143] Tropical cyclones destroy agriculture, kill livestock, and prevent access to marketplaces for both buyers and sellers; both of these result in financial losses.[144][145][146] Powerful cyclones that make landfall – moving from the ocean to over land – are some of the most powerful, although that is not always the case. An average of 86 tropical cyclones of tropical storm intensity form annually worldwide, with 47 reaching hurricane or typhoon strength, and 20 becoming intense tropical cyclones, super typhoons, or major hurricanes (at least of Category 3 intensity).[147]
In Africa, tropical cyclones can originate from tropical waves generated over the Sahara Desert,[148] or otherwise strike the Horn of Africa and Southern Africa.[149][150] Cyclone Idai in March 2019 hit central Mozambique, becoming the deadliest tropical cyclone on record in Africa, with 1,302 fatalities, and damage estimated at US$2.2 billion.[151][152] Réunion island, located east of Southern Africa, experiences some of the wettest tropical cyclones on record. In January 1980, Cyclone Hyacinthe produced 6,083 mm (239.5 in) of rain over 15 days, which was the largest rain total recorded from a tropical cyclone on record.[153][154][155] In Asia, tropical cyclones from the Indian and Pacific oceans regularly affect some of the most populated countries on Earth. In 1970, a cyclone struck Bangladesh, then known as East Pakistan, producing a 6.1 m (20 ft) storm surge that killed at least 300,000 people; this made it the deadliest tropical cyclone on record.[156] In October 2019, Typhoon Hagibis struck the Japanese island of Honshu and inflicted US$15 billion in damage, making it the costliest storm on record in Japan.[157] The islands that comprise Oceania, from Australia to French Polynesia, are routinely affected by tropical cyclones.[158][159][160] In Indonesia, a cyclone struck the island of Flores in April 1973, killing 1,653 people, making it the deadliest tropical cyclone recorded in the Southern Hemisphere.[161][162]
Atlantic and Pacific hurricanes regularly affect North America. In the United States, hurricanes Katrina in 2005 and Harvey in 2017 are the country's costliest ever natural disasters, with monetary damage estimated at US$125 billion. Katrina struck Louisiana and largely destroyed the city of New Orleans,[163][164] while Harvey caused significant flooding in southeastern Texas after it dropped 60.58 in (1,539 mm) of rainfall; this was the highest rainfall total on record in the country.[164] Europe is rarely affected by tropical cyclones; however, the continent regularly encounters storms after they transitioned into extratropical cyclones. Only one tropical depression – Vince in 2005 – struck Spain,[165] and only one subtropical cyclone – Subtropical Storm Alpha in 2020 – struck Portugal.[166] Occasionally, there are tropical-like cyclones in the Mediterranean Sea.[167] The northern portion of South America experiences occasional tropical cyclones, with 173 fatalities from Tropical Storm Bret in August 1993.[168][169] The South Atlantic Ocean is generally inhospitable to the formation of a tropical storm.[170] However, in March 2004, Hurricane Catarina struck southeastern Brazil as the first hurricane on record in the South Atlantic Ocean.[171]
Environmental effects
Although cyclones take an enormous toll in lives and personal property, they may be important factors in the precipitation regimes of places they affect, as they may bring much-needed precipitation to otherwise dry regions.[172] Their precipitation may also alleviate drought conditions by restoring soil moisture, though one study focused on the Southeastern United States suggested tropical cyclones did not offer significant drought recovery.[173][174][175] Tropical cyclones also help maintain the global heat balance by moving warm, moist tropical air to the middle latitudes and polar regions,[176] and by regulating the thermohaline circulation through upwelling.[177] Research on Pacific cyclones has demonstrated that deeper layers of the ocean receive a heat transfer from these powerful storms.[178][179] The storm surge and winds of hurricanes may be destructive to human-made structures, but they also stir up the waters of coastal estuaries, which are typically important fish breeding locales.[180] Ecosystems, such as saltmarshes and Mangrove forests, can be severely damaged or destroyed by tropical cyclones, which erode land and destroy vegetation.[181][182] Tropical cyclones can cause harmful algae blooms to form in bodies of water by increasing the amount of nutrients available.[183][184][185] Insect populations can decrease in both quantity and diversity after the passage of storms.[186] Strong winds associated with tropical cyclones and their remnants are capable of felling thousands of trees, causing damage to forests.[187]
When hurricanes surge upon shore from the ocean, salt is introduced to many freshwater areas and raises the salinity levels too high for some habitats to withstand. Some are able to cope with the salt and recycle it back into the ocean, but others can not release the extra surface water quickly enough or do not have a large enough freshwater source to replace it. Because of this, some species of plants and vegetation die due to the excess salt.[188] In addition, hurricanes can carry toxins and acids onshore when they make landfall. The floodwater can pick up the toxins from different spills and contaminate the land that it passes over. These toxins are harmful to the people and animals in the area, as well as the environment around them.[189] Tropical cyclones can cause oil spills by damaging or destroying pipelines and storage facilities.[190][183][191] Similarly, chemical spills have been reported when chemical and processing facilities were damaged.[191][192][193] Waterways have become contaminated with toxic levels of metals such as nickel, chromium, and mercury during tropical cyclones.[194][195]
Tropical cyclones can have an extensive effect on geography, such as creating or destroying land.[196][197] Cyclone Bebe increased the size of Tuvalu island, Funafuti Atoll, by nearly 20%.[196][198][199] Hurricane Walaka destroyed the small East Island in 2018,[197][200] which destroyed the habitat for the endangered Hawaiian monk seal, as well as, threatened sea turtles and seabirds.[201] Landslides frequently occur during tropical cyclones and can vastly alter landscapes; some storms are capable of causing hundreds to tens of thousands of landslides.[202][203][204][205] Storms can erode coastlines over an extensive area and transport the sediment to other locations.[195][206][207]
Climatology
Tropical cyclones have occurred around the world for millennia. Reanalyses and research are being undertaken to extend the historical record, through the usage of proxy data such as overwash deposits, beach ridges and historical documents such as diaries.[208] Major tropical cyclones leave traces in overwash records and shell layers in some coastal areas, which have been used to gain insight into hurricane activity over the past thousands of years.[209] Sediment records in Western Australia suggest an intense tropical cyclone in the 4th millennium BC.[208] Proxy records based on paleotempestological research have revealed that major hurricane activity along the Gulf of Mexico coast varies on timescales of centuries to millennia.[210][211] In the year 957, a powerful typhoon struck southern China, killing around 10,000 people due to flooding.[212] The Spanish colonization of Mexico described "tempestades" in 1730,[213] although the official record for Pacific hurricanes only dates to 1949.[214] In the south-west Indian Ocean, the tropical cyclone record goes back to 1848.[215] In 2003, the Atlantic hurricane reanalysis project examined and analyzed the historical record of tropical cyclones in the Atlantic back to 1851, extending the existing database from 1886.[216]
Before satellite imagery became available during the 20th century, many of these systems went undetected unless it impacted land or a ship encountered it by chance.[1] Often in part because of the threat of hurricanes, many coastal regions had sparse population between major ports until the advent of automobile tourism; therefore, the most severe portions of hurricanes striking the coast may have gone unmeasured in some instances. The combined effects of ship destruction and remote landfall severely limit the number of intense hurricanes in the official record before the era of hurricane reconnaissance aircraft and satellite meteorology. Although the record shows a distinct increase in the number and strength of intense hurricanes, therefore, experts regard the early data as suspect.[217] The ability of climatologists to make a long-term analysis of tropical cyclones is limited by the amount of reliable historical data.[218] During the 1940s, routine aircraft reconnaissance started in both the Atlantic and Western Pacific basin during the mid-1940s, which provided ground truth data, however, early flights were only made once or twice a day.[1] Polar-orbiting weather satellites were first launched by the United States National Aeronautics and Space Administration in 1960 but were not declared operational until 1965.[1] However, it took several years for some of the warning centres to take advantage of this new viewing platform and develop the expertise to associate satellite signatures with storm position and intensity.[1]
Each year on average, around 80 to 90 named tropical cyclones form around the world, of which over half develop hurricane-force winds of 65 kn (120 km/h; 75 mph) or more.[1] Worldwide, tropical cyclone activity peaks in late summer, when the difference between temperatures aloft and sea surface temperatures is the greatest. However, each particular basin has its own seasonal patterns. On a worldwide scale, May is the least active month, while September is the most active month. November is the only month in which all the tropical cyclone basins are in season.[219] In the Northern Atlantic Ocean, a distinct cyclone season occurs from June 1 to November 30, sharply peaking from late August through September.[219] The statistical peak of the Atlantic hurricane season is September 10. The Northeast Pacific Ocean has a broader period of activity, but in a similar time frame to the Atlantic.[220] The Northwest Pacific sees tropical cyclones year-round, with a minimum in February and March and a peak in early September.[219] In the North Indian basin, storms are most common from April to December, with peaks in May and November.[219] In the Southern Hemisphere, the tropical cyclone year begins on July 1 and runs all year-round encompassing the tropical cyclone seasons, which run from November 1 until the end of April, with peaks in mid-February to early March.[219][23]
Of various modes of variability in the climate system, El Niño–Southern Oscillation has the largest effect on tropical cyclone activity.[221] Most tropical cyclones form on the side of the subtropical ridge closer to the equator, then move poleward past the ridge axis before recurving into the main belt of the Westerlies.[222] When the subtropical ridge position shifts due to El Niño, so will the preferred tropical cyclone tracks. Areas west of Japan and Korea tend to experience much fewer September–November tropical cyclone impacts during El Niño and neutral years.[223] During La Niña years, the formation of tropical cyclones, along with the subtropical ridge position, shifts westward across the western Pacific Ocean, which increases the landfall threat to China and much greater intensity in the Philippines.[223] The Atlantic Ocean experiences depressed activity due to increased vertical wind shear across the region during El Niño years.[224] Tropical cyclones are further influenced by the Atlantic Meridional Mode, the Quasi-biennial oscillation and the Madden–Julian oscillation.[221][225]
| Basin | Season start | Season end | Tropical cyclones | Refs |
|---|---|---|---|---|
| North Atlantic | June 1 | November 30 | 14.4 | [226] |
| Eastern Pacific | May 15 | November 30 | 16.6 | [226] |
| Western Pacific | January 1 | December 31 | 26.0 | [226] |
| North Indian | January 1 | December 31 | 12 | [227] |
| South-West Indian | July 1 | June 30 | 9.3 | [226][22] |
| Australian region | November 1 | April 30 | 11.0 | [228] |
| Southern Pacific | November 1 | April 30 | 7.1 | [229] |
| Total: | 96.4 | |||
Influence of climate change


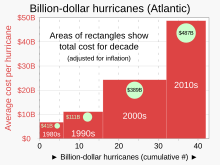
Climate change can affect tropical cyclones in a variety of ways: an intensification of rainfall and wind speed, a decrease in overall frequency, an increase in the frequency of very intense storms and a poleward extension of where the cyclones reach maximum intensity are among the possible consequences of human-induced climate change.[2] Tropical cyclones use warm, moist air as their fuel. As climate change is warming ocean temperatures, there is potentially more of this fuel available.[232] Between 1979 and 2017, there was a global increase in the proportion of tropical cyclones of Category 3 and higher on the Saffir–Simpson scale. The trend was most clear in the North Atlantic and in the Southern Indian Ocean. In the North Pacific, tropical cyclones have been moving poleward into colder waters and there was no increase in intensity over this period.[233] With 2 °C (3.6 °F) warming, a greater percentage (+13%) of tropical cyclones are expected to reach Category 4 and 5 strength.[2] A 2019 study indicates that climate change has been driving the observed trend of rapid intensification of tropical cyclones in the Atlantic basin. Rapidly intensifying cyclones are hard to forecast and therefore pose additional risk to coastal communities.[234]
Warmer air can hold more water vapor: the theoretical maximum water vapor content is given by the Clausius–Clapeyron relation, which yields ≈7% increase in water vapor in the atmosphere per 1 °C (1.8 °F) warming.[235][236] All models that were assessed in a 2019 review paper show a future increase of rainfall rates.[2] Additional sea level rise will increase storm surge levels.[237][238] It is plausible that extreme wind waves see an increase as a consequence of changes in tropical cyclones, further exacerbating storm surge dangers to coastal communities.[239] The compounding effects from floods, storm surge, and terrestrial flooding (rivers) are projected to increase due to global warming.[238]
There is currently no consensus on how climate change will affect the overall frequency of tropical cyclones.[2] A majority of climate models show a decreased frequency in future projections.[239] For instance, a 2020 paper comparing nine high-resolution climate models found robust decreases in frequency in the Southern Indian Ocean and the Southern Hemisphere more generally, while finding mixed signals for Northern Hemisphere tropical cyclones.[240] Observations have shown little change in the overall frequency of tropical cyclones worldwide,[241] with increased frequency in the North Atlantic and central Pacific, and significant decreases in the southern Indian Ocean and western North Pacific.[242] There has been a poleward expansion of the latitude at which the maximum intensity of tropical cyclones occurs, which may be associated with climate change.[243] In the North Pacific, there may also have been an eastward expansion.[237] Between 1949 and 2016, there was a slowdown in tropical cyclone translation speeds. It is unclear still to what extent this can be attributed to climate change: climate models do not all show this feature.[239]
A study review article published in 2021 concluded that the geographic range of tropical cyclones will probably expand poleward in response to climate warming of the Hadley circulation.[244]
Observation and forecasting
Observation


Historically, tropical cyclones have occurred around the world for thousands of years, with one of the earliest tropical cyclones on record estimated to have occurred in Western Australia in around 4000 BC.[208] However, before satellite imagery became available during the 20th century, there was no way to detect a tropical cyclone unless it impacted land or a ship encountered it by chance.[1]
Intense tropical cyclones pose a particular observation challenge, as they are a dangerous oceanic phenomenon, and weather stations, being relatively sparse, are rarely available on the site of the storm itself. In general, surface observations are available only if the storm is passing over an island or a coastal area, or if there is a nearby ship. Real-time measurements are usually taken in the periphery of the cyclone, where conditions are less catastrophic and its true strength cannot be evaluated. For this reason, there are teams of meteorologists that move into the path of tropical cyclones to help evaluate their strength at the point of landfall.[245]
Tropical cyclones are tracked by weather satellites capturing visible and infrared images from space, usually at half-hour to quarter-hour intervals. As a storm approaches land, it can be observed by land-based Doppler weather radar. Radar plays a crucial role around landfall by showing a storm's location and intensity every several minutes.[246] Other satellites provide information from the perturbations of GPS signals, providing thousands of snapshots per day and capturing atmospheric temperature, pressure, and moisture content.[247]
In situ measurements, in real-time, can be taken by sending specially equipped reconnaissance flights into the cyclone. In the Atlantic basin, these flights are regularly flown by United States government hurricane hunters.[248] These aircraft fly directly into the cyclone and take direct and remote-sensing measurements. The aircraft also launch GPS dropsondes inside the cyclone. These sondes measure temperature, humidity, pressure, and especially winds between flight level and the ocean's surface. A new era in hurricane observation began when a remotely piloted Aerosonde, a small drone aircraft, was flown through Tropical Storm Ophelia as it passed Virginia's eastern shore during the 2005 hurricane season. A similar mission was also completed successfully in the western Pacific Ocean.[249]
Forecasting

High-speed computers and sophisticated simulation software allow forecasters to produce computer models that predict tropical cyclone tracks based on the future position and strength of high- and low-pressure systems. Combining forecast models with increased understanding of the forces that act on tropical cyclones, as well as with a wealth of data from Earth-orbiting satellites and other sensors, scientists have increased the accuracy of track forecasts over recent decades.[250] However, scientists are not as skillful at predicting the intensity of tropical cyclones.[251] The lack of improvement in intensity forecasting is attributed to the complexity of tropical systems and an incomplete understanding of factors that affect their development. New tropical cyclone position and forecast information is available at least every six hours from the various warning centers.[252][253][254][255][256]
Geopotential height
In meteorology, geopotential heights are used when creating forecasts and analyzing pressure systems. Geopotential heights represent the estimate of the real height of a pressure system above the average sea level.[257] Geopotential heights for weather are divided up into several levels. The lowest geopotential height level is 850 hPa (25.10 inHg), which represents the lowest 1,500 m (5,000 ft) of the atmosphere. The moisture content, gained by using either the relative humidity or the precipitable water value, is used in creating forecasts for precipitation.[258] The next level, 700 hPa (20.67 inHg), is at a height of 2,300–3,200 m (7,700–10,500 ft); 700 hPa is regarded as the highest point in the lower atmosphere. At this layer, both vertical movement and moisture levels are used to locate and create forecasts for precipitation.[259] The middle level of the atmosphere is at 500 hPa (14.76 inHg) or a height of 4,900–6,100 m (16,000–20,000 ft). The 500 hPa level is used for measuring atmospheric vorticity, commonly known as the spin of air. The relative humidity is also analyzed at this height in order to establish where precipitation is likely to materialize.[260] The next level occurs at 300 hPa (8.859 inHg) or a height of 8,200–9,800 m (27,000–32,000 ft).[261] The top-most level is located at 200 hPa (5.906 inHg), which corresponds to a height of 11,000–12,000 m (35,000–41,000 ft). Both the 200 and 300 hPa levels are mainly used to locate the jet stream.[262]
Society and culture
Preparations
Ahead of the formal season starting, people are urged to prepare for the effects of a tropical cyclone by politicians and weather forecasters, amongst others. They prepare by determining their risk to the different types of weather, tropical cyclones cause, checking their insurance coverage and emergency supplies, as well as determining where to evacuate to if needed.[263][264][265] When a tropical cyclone develops and is forecast to impact land, each member nation of the World Meteorological Organization issues various watches and warnings to cover the expected effects.[266] However, there are some exceptions with the United States National Hurricane Center and Fiji Meteorological Service responsible for issuing or recommending warnings for other nations in their area of responsibility.[267][268][269]: 2–4
An important decision in individual preparedness is determining if and when to evacuate an area that will be affected by a tropical cyclone.[270] Tropical cyclone tracking charts allow people to track ongoing systems to form their own opinions regarding where the storms are going and whether or not they need to prepare for the system being tracked, including possible evacuation. This continues to be encouraged by the National Oceanic and Atmospheric Administration and National Hurricane Center.[271]
Response
This section needs expansion. You can help by adding to it. (October 2022) |

Hurricane response is the disaster response after a hurricane. Activities performed by hurricane responders include assessment, restoration, and demolition of buildings; removal of debris and waste; repairs to land-based and maritime infrastructure; and public health services including search and rescue operations.[272] Hurricane response requires coordination between federal, tribal, state, local, and private entities.[273] According to the National Voluntary Organizations Active in Disaster, potential response volunteers should affiliate with established organizations and should not self-deploy, so that proper training and support can be provided to mitigate the danger and stress of response work.[274]
Hurricane responders face many hazards. Hurricane responders may be exposed to chemical and biological contaminants including stored chemicals, sewage, human remains, and mold growth encouraged by flooding,[275][276][277] as well as asbestos and lead that may be present in older buildings.[276][278] Common injuries arise from falls from heights, such as from a ladder or from level surfaces; from electrocution in flooded areas, including from backfeed from portable generators; or from motor vehicle accidents.[275][278][279] Long and irregular shifts may lead to sleep deprivation and fatigue, increasing the risk of injuries, and workers may experience mental stress associated with a traumatic incident. Additionally, heat stress is a concern as workers are often exposed to hot and humid temperatures, wear protective clothing and equipment, and have physically difficult tasks.[275][278]
See also
- Cyclone
- Tropical cyclones by year
- Tropical cyclones in 2024
- 2024 Atlantic hurricane season
- 2024 Pacific hurricane season
- 2024 Pacific typhoon season
- 2024 North Indian Ocean cyclone season
- 2024–25 South-West Indian Ocean cyclone season
- 2024–25 Australian region cyclone season
- 2024–25 South Pacific cyclone season
References
- ^ Jump up to: a b c d e f g h i j k l m n o p q Global Guide to Tropical Cyclone Forecasting: 2017 (PDF) (Report). World Meteorological Organization. April 17, 2018. Archived (PDF) from the original on July 14, 2019. Retrieved September 6, 2020.
- ^ Jump up to: a b c d e Knutson, Thomas; Camargo, Suzana J.; Chan, Johnny C. L.; Emanuel, Kerry; Ho, Chang-Hoi; Kossin, James; Mohapatra, Mrutyunjay; Satoh, Masaki; Sugi, Masato; Walsh, Kevin; Wu, Liguang (August 6, 2019). "Tropical Cyclones and Climate Change Assessment: Part II. Projected Response to Anthropogenic Warming". Bulletin of the American Meteorological Society. 101 (3): BAMS–D–18–0194.1. doi:10.1175/BAMS-D-18-0194.1. ISSN 0003-0007.
- ^ "Major tropical cyclones have become '15% more likely' over past 40 years". Carbon Brief. May 18, 2020. Archived from the original on August 8, 2020. Retrieved August 31, 2020.
- ^ Jump up to: a b "Glossary of NHC Terms". United States National Hurricane Center. Archived from the original on February 16, 2021. Retrieved February 18, 2021.
- ^ "Tropical cyclone facts: What is a tropical cyclone?". United Kingdom Met Office. Archived from the original on February 2, 2021. Retrieved February 25, 2021.
- ^ Jump up to: a b c d e "Tropical cyclone facts: How do tropical cyclones form?". United Kingdom Met Office. Archived from the original on February 2, 2021. Retrieved March 1, 2021.
- ^ Jump up to: a b Landsea, Chris. "How do tropical cyclones form?". Frequently Asked Questions. Atlantic Oceanographic and Meteorological Laboratory, Hurricane Research Division. Archived from the original on August 27, 2009. Retrieved October 9, 2017.
- ^ Berg, Robbie. "Tropical cyclone intensity in relation to SST and moisture variability" (PDF). Rosenstiel School of Marine, Atmospheric, and Earth Science (University of Miami). Archived (PDF) from the original on June 10, 2011. Retrieved September 23, 2010.
- ^ Zhang, Da-Lin; Zhu, Lin (September 12, 2012). "Roles of upper-level processes in tropical cyclogenesis". Geophysical Research Letters. 39 (17). AGU. Bibcode:2012GeoRL..3917804Z. doi:10.1029/2012GL053140. ISSN 0094-8276. S2CID 53341455. Retrieved October 4, 2022.
- ^ Chris Landsea (January 4, 2000). "Climate Variability table — Tropical Cyclones". Atlantic Oceanographic and Meteorological Laboratory, National Oceanic and Atmospheric Administration. Archived from the original on October 2, 2012. Retrieved October 19, 2006.
- ^ Landsea, Christopher. "AOML Climate Variability of Tropical Cyclones paper". Atlantic Oceanographic and Meteorological Laboratory. Archived from the original on October 26, 2021. Retrieved September 23, 2010.
- ^ Aiyyer, Anantha; Molinari, John (August 1, 2008). "MJO and Tropical Cyclogenesis in the Gulf of Mexico and Eastern Pacific: Case Study and Idealized Numerical Modeling". Journal of the Atmospheric Sciences. 65 (8). American Meteorological Society: 2691–2704. Bibcode:2008JAtS...65.2691A. doi:10.1175/2007JAS2348.1. S2CID 17409876.
- ^ Zhao, Chen; Li, Tim (October 20, 2018). "Basin dependence of the MJO modulating tropical cyclone genesis". Climate Dynamics. 52 (9–10). Springer: 6081–6096. doi:10.1007/s00382-018-4502-y. S2CID 134747858. Archived from the original on October 2, 2022. Retrieved October 5, 2022.
- ^ Camargo, Suzana J.; Emanuel, Kerry A.; Sobel, Adam H. (October 1, 2007). "Use of a Genesis Potential Index to Diagnose ENSO Effects on Tropical Cyclone Genesis". Journal of Climate. 20 (19). American Meteorological Society: 4819–4834. Bibcode:2007JCli...20.4819C. doi:10.1175/JCLI4282.1. S2CID 17340459.
- ^ Molinari, John; Lombardo, Kelly; Vollaro, David (April 1, 2007). "Tropical Cyclogenesis within an Equatorial Rossby Wave Packet". Journal of the Atmospheric Sciences. 64 (4). American Meteorological Society: 1301–1317. Bibcode:2007JAtS...64.1301M. doi:10.1175/JAS3902.1. S2CID 12920242.
- ^ Li, Tim; Fu, Bing (May 1, 2006). "Tropical Cyclogenesis Associated with Rossby Wave Energy Dispersion of a Preexisting Typhoon. Part I: Satellite Data Analyses". Journal of the Atmospheric Sciences. 63 (5). American Meteorological Society: 1377–1389. Bibcode:2006JAtS...63.1377L. doi:10.1175/JAS3692.1. S2CID 15372289.
- ^ Schreck III, Carl J.; Molinari, John (September 1, 2011). "Tropical Cyclogenesis Associated with Kelvin Waves and the Madden–Julian Oscillation". Monthly Weather Review. 139 (9). American Meteorological Society: 2723–2734. Bibcode:2011MWRv..139.2723S. doi:10.1175/MWR-D-10-05060.1. S2CID 16983131.
- ^ Schreck III, Carl J. (October 1, 2015). "Kelvin Waves and Tropical Cyclogenesis: A Global Survey". Monthly Weather Review. 143 (10). American Meteorological Society: 3996–4011. Bibcode:2015MWRv..143.3996S. doi:10.1175/MWR-D-15-0111.1. S2CID 118859063.
- ^ Jump up to: a b c d e f RA IV Hurricane Committee (May 9, 2023). Hurricane Operational Plan for North America, Central America and the Caribbean 2023 (PDF) (Report). World Meteorological Organization. Retrieved July 29, 2023.
- ^ Jump up to: a b c d WMO/ESCAP Typhoon Committee (2023). Typhoon Committee Operational Manual: Meteorological Component 2023 (PDF) (Report). World Meteorological Organization.
- ^ Jump up to: a b c d Panel on Tropical Cyclones (2023). Tropical Cyclone Operational Plan for the Bay of Bengal and the Arabian Sea 2023 (PDF) (Report). World Meteorological Organization.
- ^ Jump up to: a b c d e RA I Tropical Cyclone Committee (2023). Tropical Cyclone Operational Plan for the South-West Indian Ocean (PDF) (Report). World Meteorological Organization.
- ^ Jump up to: a b c d e f g h i j k RA V Tropical Cyclone Committee (2023). Tropical Cyclone Operational Plan for the South-East Indian Ocean and the Southern Pacific Ocean 2023 (PDF) (Report). World Meteorological Organization. Retrieved October 23, 2023.
- ^ "Normas Da Autoridade Marítima Para As Atividades De Meteorologia Marítima" (PDF) (in Portuguese). Brazilian Navy. 2011. Archived from the original (PDF) on February 6, 2015. Retrieved October 5, 2018.
- ^ Knapp, Kenneth R.; Knaff, John A.; Sampson, Charles R.; Riggio, Gustavo M.; Schnapp, Adam D. (August 1, 2013). "A Pressure-Based Analysis of the Historical Western North Pacific Tropical Cyclone Intensity Record". Monthly Weather Review. 141 (8). American Meteorological Society: 2611–2631. Bibcode:2013MWRv..141.2611K. doi:10.1175/MWR-D-12-00323.1. S2CID 19031120.
- ^ "What is a Tropical Cyclone?". Bureau of Meteorology. Archived from the original on October 3, 2022. Retrieved October 7, 2022.
- ^ "Saffir-Simpson Hurricane Wind Scale". National Hurricane Center. Archived from the original on June 20, 2020. Retrieved October 7, 2022.
- ^ Dunnavan, G.M.; Diercks, J.W. (1980). "An Analysis of Super Typhoon Tip (October 1979)". Monthly Weather Review. 108 (11): 1915–1923. Bibcode:1980MWRv..108.1915D. doi:10.1175/1520-0493(1980)108<1915:AAOSTT>2.0.CO;2.
- ^ Pasch, Richard (October 23, 2015). "Hurricane Patricia Discussion Number 14". National Hurricane Center. Archived from the original on October 25, 2015. Retrieved October 23, 2015.
Data from three center fixes by the Hurricane Hunters indicate that the intensity, based on a blend of 700 mb-flight level and SFMR-observed surface winds, is near 175 kt. This makes Patricia the strongest hurricane on record in the National Hurricane Center's area of responsibility (AOR) which includes the Atlantic and the eastern North Pacific basins.
- ^ Tory, K. J.; Dare, R. A. (October 15, 2015). "Sea Surface Temperature Thresholds for Tropical Cyclone Formation". Journal of Climate. 28 (20). American Meteorological Society: 8171. Bibcode:2015JCli...28.8171T. doi:10.1175/JCLI-D-14-00637.1. Archived from the original on April 28, 2021. Retrieved April 28, 2021.
- ^ Lavender, Sally; Hoeke, Ron; Abbs, Deborah (March 9, 2018). "The influence of sea surface temperature on the intensity and associated storm surge of tropical cyclone Yasi: a sensitivity study". Natural Hazards and Earth System Sciences. 18 (3). Copernicus Publications: 795–805. Bibcode:2018NHESS..18..795L. doi:10.5194/nhess-18-795-2018. Archived from the original on April 28, 2021. Retrieved April 28, 2021.
- ^ Xu, Jing; Wang, Yuqing (April 1, 2018). "Dependence of Tropical Cyclone Intensification Rate on Sea SurfaceTemperature, Storm Intensity, and Size in the Western North Pacific". Weather and Forecasting. 33 (2). American Meteorological Society: 523–527. Bibcode:2018WtFor..33..523X. doi:10.1175/WAF-D-17-0095.1. Archived from the original on April 28, 2021. Retrieved April 28, 2021.
- ^ Brown, Daniel (April 20, 2017). "Tropical Cyclone Intensity Forecasting: Still a Challenging Proposition" (PDF). National Hurricane Center. p. 7. Archived (PDF) from the original on April 27, 2021. Retrieved April 27, 2021.
- ^ Jump up to: a b Chih, Cheng-Hsiang; Wu, Chun-Chieh (February 1, 2020). "Exploratory Analysis of Upper-Ocean Heat Content and Sea Surface Temperature Underlying Tropical Cyclone Rapid Intensification in the Western North Pacific". Journal of Climate. 33 (3): 1031–1033. Bibcode:2020JCli...33.1031C. doi:10.1175/JCLI-D-19-0305.1. S2CID 210249119. Archived from the original on April 27, 2021. Retrieved April 27, 2021.
- ^ Lin, I.; Goni, Gustavo; Knaff, John; Forbes, Cristina; Ali, M. (May 31, 2012). "Ocean heat content for tropical cyclone intensity forecasting and its impact on storm surge" (PDF). Journal of the International Society for the Prevention and Mitigation of Natural Hazards. 66 (3). Springer Science+Business Media: 3–4. doi:10.1007/s11069-012-0214-5. ISSN 0921-030X. S2CID 9130662. Archived (PDF) from the original on April 27, 2021. Retrieved April 27, 2021.
- ^ Hu, Jianyu; Wang, Xiao Hua (September 2016). "Progress on upwelling studies in the China seas". Reviews of Geophysics. 54 (3). AGU: 653–673. Bibcode:2016RvGeo..54..653H. doi:10.1002/2015RG000505. S2CID 132158526.
- ^ Jump up to: a b D'Asaro, Eric A. & Black, Peter G. (2006). "J8.4 Turbulence in the Ocean Boundary Layer Below Hurricane Dennis". University of Washington. Archived (PDF) from the original on March 30, 2012. Retrieved February 22, 2008.
- ^ Fedorov, Alexey V.; Brierley, Christopher M.; Emanuel, Kerry (February 2010). "Tropical cyclones and permanent El Niño in the early Pliocene epoch". Nature. 463 (7284): 1066–1070. Bibcode:2010Natur.463.1066F. doi:10.1038/nature08831. hdl:1721.1/63099. ISSN 0028-0836. PMID 20182509. S2CID 4330367.
- ^ Zhang, Fuqing; Tao, Dandan (March 1, 2013). "Effects of Vertical Wind Shear on the Predictability of Tropical Cyclones". Journal of the Atmospheric Sciences. 70 (3): 975–983. Bibcode:2013JAtS...70..975Z. doi:10.1175/JAS-D-12-0133.1.
- ^ Stovern, Diana; Ritchie, Elizabeth. "Modeling the Effect of Vertical Wind Shear on Tropical Cyclone Size and Structure" (PDF). American Meteorological Society. pp. 1–2. Archived (PDF) from the original on June 18, 2021. Retrieved April 28, 2021.
- ^ Wingo, Matthew; Cecil, Daniel (March 1, 2010). "Effects of Vertical Wind Shear on Tropical Cyclone Precipitation". Monthly Weather Review. 138 (3). American Meteorological Society: 645–662. Bibcode:2010MWRv..138..645W. doi:10.1175/2009MWR2921.1. S2CID 73622535.
- ^ Liang, Xiuji; Li, Qingqing (March 1, 2021). "Revisiting the response of western North Pacific tropical cyclone intensity change to vertical wind shear in different directions". Atmospheric and Oceanic Science Letters. 14 (3): 100041. Bibcode:2021AOSL...1400041L. doi:10.1016/j.aosl.2021.100041.
- ^ Shi, Donglei; Ge, Xuyang; Peng, Melinda (September 2019). "Latitudinal dependence of the dry air effect on tropical cyclone development". Dynamics of Atmospheres and Oceans. 87: 101102. Bibcode:2019DyAtO..8701102S. doi:10.1016/j.dynatmoce.2019.101102. S2CID 202123299. Retrieved May 14, 2022.
- ^ Wang, Shuai; Toumi, Ralf (June 1, 2019). "Impact of Dry Midlevel Air on the Tropical Cyclone Outer Circulation". Journal of the Atmospheric Sciences. 76 (6). American Meteorological Society: 1809–1826. Bibcode:2019JAtS...76.1809W. doi:10.1175/JAS-D-18-0302.1. hdl:10044/1/70065. S2CID 145965553.
- ^ Alland, Joshua J.; Tang, Brian H.; Corbosiero, Kristen L.; Bryan, George H. (February 24, 2021). "Combined Effects of Midlevel Dry Air and Vertical Wind Shear on Tropical Cyclone Development. Part II: Radial Ventilation". Journal of the Atmospheric Sciences. 78 (3). American Meteorological Society: 783–796. Bibcode:2021JAtS...78..783A. doi:10.1175/JAS-D-20-0055.1. S2CID 230602004. Archived from the original on May 14, 2022. Retrieved May 14, 2022.
- ^ Rappin, Eric D.; Morgan, Michael C.; Tripoli, Gregory J. (February 1, 2011). "The Impact of Outflow Environment on Tropical Cyclone Intensification and Structure". Journal of the Atmospheric Sciences. 68 (2). American Meteorological Society: 177–194. Bibcode:2011JAtS...68..177R. doi:10.1175/2009JAS2970.1. S2CID 123508815.
- ^ Shi, Donglei; Chen, Guanghua (December 10, 2021). "The Implication of Outflow Structure for the Rapid Intensification of Tropical Cyclones under Vertical Wind Shear". Monthly Weather Review. 149 (12). American Meteorological Society: 4107–4127. Bibcode:2021MWRv..149.4107S. doi:10.1175/MWR-D-21-0141.1. S2CID 244001444. Archived from the original on May 14, 2022. Retrieved May 15, 2022.
- ^ Ryglicki, David R.; Doyle, James D.; Hodyss, Daniel; Cossuth, Joshua H.; Jin, Yi; Viner, Kevin C.; Schmidt, Jerome M. (August 1, 2019). "The Unexpected Rapid Intensification of Tropical Cyclones in Moderate Vertical Wind Shear. Part III: Outflow–Environment Interaction". Monthly Weather Review. 147 (8). American Meteorological Society: 2919–2940. Bibcode:2019MWRv..147.2919R. doi:10.1175/MWR-D-18-0370.1. S2CID 197485216.
- ^ Дай, Йи; Маджумдар, Шаранья Дж.; Нолан, Дэвид С. (1 июля 2019 г.). «Взаимосвязь оттока и дождевых полос, вызванная экологическим потоком вокруг тропических циклонов» . Журнал атмосферных наук . 76 (7). Американское метеорологическое общество: 1845–1863 гг. Бибкод : 2019JAtS...76.1845D . doi : 10.1175/JAS-D-18-0208.1 . S2CID 146062929 .
- ^ Рыглицкий, Дэвид Р.; Коссут, Джошуа Х.; Ходисс, Дэниел; Дойл, Джеймс Д. (1 ноября 2018 г.). «Неожиданная быстрая интенсификация тропических циклонов при умеренном вертикальном сдвиге ветра. Часть I: Обзор и наблюдения» . Ежемесячный обзор погоды . 146 (11): 3773–3800. Бибкод : 2018MWRv..146.3773R . дои : 10.1175/MWR-D-18-0020.1 .
- ^ Риос-Берриос, Розимар; Финоккио, Питер М.; Алланд, Джошуа Дж.; Чен, Сяоминь; Фишер, Майкл С.; Стивенсон, Стефани Н.; Тао, Дандан (27 октября 2023 г.). «Обзор взаимодействия между тропическими циклонами и вертикальным сдвигом ветра в окружающей среде» . Журнал атмосферных наук . 81 (4): 713–741. doi : 10.1175/JAS-D-23-0022.1 .
- ^ Карраско, Кристина; Ландси, Кристофер; Линь, Ю-Ланг (1 июня 2014 г.). «Влияние размера тропического циклона на его усиление» . Погода и прогнозирование . 29 (3). Американское метеорологическое общество: 582–590. Бибкод : 2014WtFor..29..582C . дои : 10.1175/WAF-D-13-00092.1 . S2CID 18429068 .
- ^ Ландер, Марк; Холланд, Грег Дж. (октябрь 1993 г.). «О взаимодействии вихрей масштаба тропических циклонов. I: Наблюдения» . Ежеквартальный журнал Королевского метеорологического общества . 119 (514). Королевское метеорологическое общество : 1347–1361 гг. Бибкод : 1993QJRMS.119.1347L . дои : 10.1002/qj.49711951406 .
- ^ Андерсен, Тереза К.; Шеперд, Дж. Маршалл (21 марта 2013 г.). «Глобальный пространственно-временной анализ поддержания или усиления внутренних тропических циклонов» . Международный журнал климатологии . 34 (2). Королевское метеорологическое общество: 391–402. дои : 10.1002/joc.3693 . S2CID 129080562 . Проверено 7 октября 2022 г.
- ^ Андерсен, Тереза; Шеперд, Маршалл (17 февраля 2017 г.). «Внутренние тропические циклоны и концепция «коричневого океана» . Ураганы и изменение климата . Спрингер . стр. 117–134. дои : 10.1007/978-3-319-47594-3_5 . ISBN 978-3-319-47592-9 . Архивировано из оригинала 15 мая 2022 года . Проверено 20 мая 2022 г.
- ^ Хауз, Роберт А. младший (6 января 2012 г.). «Орографическое воздействие на выпадающие облака» . Обзоры геофизики . 50 (1). АГУ. Бибкод : 2012RvGeo..50.1001H . дои : 10.1029/2011RG000365 . S2CID 46645620 .
- ^ Ито, Косуке; Итикава, Хана (31 августа 2020 г.). «Теплый океан ускоряет тропический циклон Хагибис (2019) за счет взаимодействия с западной струей в средних широтах» . Научные онлайн-письма об атмосфере . 17А . Метеорологическое общество Японии: 1–6. дои : 10.2151/sola.17A-001 . S2CID 224874804 . Архивировано из оригинала 7 октября 2022 года . Проверено 7 октября 2022 г.
- ^ Делай, Гану; Ким, Хён Сог (18 августа 2021 г.). «Влияние реактивных течений в средних широтах на интенсивность тропических циклонов, воздействующих на Корею: наблюдательный анализ и последствия экспериментов с численной моделью тайфуна Чаба (2016)» . Атмосфера . 12 (8). MDPI: 1061. Бибкод : 2021Atmos..12.1061D . дои : 10.3390/atmos12081061 .
- ^ «Глоссарий терминов NHC» . Национальный центр ураганов Национального управления океанических и атмосферных исследований США. Архивировано из оригинала 12 сентября 2019 года . Проверено 2 июня 2019 г.
- ^ Оропеса, Фернандо; Рага, Грасиела Б. (январь 2015 г.). «Быстрое углубление тропических циклонов в северо-восточной части тропической части Тихого океана: связь с океаническими водоворотами» . Атмосфера . 28 (1): 27–42. Бибкод : 2015Атмо...28...27О . дои : 10.1016/S0187-6236(15)72157-0 .
- ^ Диана Энгл. «Структура ураганов и энергетика» . Научный центр ураганов Data Discovery. Архивировано из оригинала 27 мая 2008 года . Проверено 26 октября 2008 г.
- ^ Брэд Рейнхарт; Дэниел Браун (21 октября 2020 г.). «Обсуждение урагана Эпсилон номер 12» . nhc.noaa.gov . Майами, Флорида : Национальный центр ураганов. Архивировано из оригинала 21 марта 2021 года . Проверено 4 февраля 2021 г.
- ^ Капуччи, Мэтью (21 октября 2020 г.). «Эпсилон бьет рекорды, поскольку он быстро перерастает в сильный ураган возле Бермудских островов» . Вашингтон Пост . Архивировано из оригинала 10 декабря 2020 года . Проверено 4 февраля 2021 г.
- ^ Лам, Линда (4 сентября 2019 г.). «Почему восточная часть Карибского моря может стать «кладбищем ураганов» » . Погодный канал . Продукты и технологии TWC. Архивировано из оригинала 4 июля 2021 года . Проверено 6 апреля 2021 г.
- ^ Сэдлер, Джеймс С.; Килонски, Бернард Дж. (май 1977 г.). Регенерация тропических циклонов Южно-Китайского моря в Бенгальском заливе (PDF) (Отчет). Монтерей, Калифорния : Военно-морской научно-исследовательский центр по прогнозированию окружающей среды. Архивировано (PDF) из оригинала 22 июня 2021 г. Получено 6 апреля 2021 г. - через Центр технической информации Министерства обороны .
- ^ Чанг, Чи-Пей (2004). Восточноазиатский муссон . Всемирная научная . ISBN 978-981-238-769-1 . OCLC 61353183 . Архивировано из оригинала 14 августа 2021 года . Проверено 22 ноября 2020 г.
- ^ Лаборатория военно-морских исследований США (23 сентября 1999 г.). «Терминология интенсивности тропических циклонов» . Справочное руководство для прогнозистов тропических циклонов . Архивировано из оригинала 12 июля 2012 года . Проверено 30 ноября 2006 г.
- ^ Перейти обратно: а б с д «Анатомия и жизненный цикл шторма: каков жизненный цикл урагана и как они движутся?» . Отдел исследования ураганов США. 2020. Архивировано из оригинала 17 февраля 2021 года . Проверено 17 февраля 2021 г.
- ^ Перейти обратно: а б с «Попытки остановить ураган на его пути: что еще считалось, чтобы остановить ураган?» . Отдел исследования ураганов США. 2020. Архивировано из оригинала 17 февраля 2021 года . Проверено 17 февраля 2021 г.
- ^ Кнафф, Джон; Лонгмор, Скотт; ДеМария, Роберт; Моленар, Дебра (1 февраля 2015 г.). «Улучшенные оценки ветра на уровне полета тропических циклонов с использованием обычной инфракрасной спутниковой разведки» . Журнал прикладной метеорологии и климатологии . 54 (2). Американское метеорологическое общество: 464. Бибкод : 2015JApMC..54..463K . doi : 10.1175/JAMC-D-14-0112.1 . S2CID 17309033 . Архивировано из оригинала 24 апреля 2021 года . Проверено 23 апреля 2021 г.
- ^ Кнафф, Джон; Рид, Кевин; Чавас, Дэниел (8 ноября 2017 г.). «Физическое понимание взаимосвязи ветра и давления тропических циклонов» . Природные коммуникации . 8 (1360): 1360. Бибкод : 2017NatCo...8.1360C . дои : 10.1038/s41467-017-01546-9 . ПМЦ 5678138 . ПМИД 29118342 .
- ^ Перейти обратно: а б Куэ, Миен-Цзе (16 мая 2012 г.). «Многообразие отношений ветра и давления тропических циклонов в западной части северной части Тихого океана: расхождения между четырьмя лучшими архивами» . Письма об экологических исследованиях . 7 (2). Издательство IOP : 2–6. Бибкод : 2012ERL.....7b4015K . дои : 10.1088/1748-9326/7/2/024015 .
- ^ Мейснер, Томас; Риккардулли, Л.; Венц, Ф.; Сэмпсон, К. (18 апреля 2018 г.). «Интенсивность и размер сильных тропических циклонов в 2017 году по данным радиометра SMAP L-диапазона НАСА» . Американское метеорологическое общество . Архивировано из оригинала 21 апреля 2021 года . Проверено 21 апреля 2021 г.
- ^ ДеМария, Марк; Кнафф, Джон; Зер, Раймонд (2013). Спутниковые применения в области изменения климата (PDF) . Спрингер. стр. 152–154. Архивировано (PDF) из оригинала 22 апреля 2021 г. Проверено 21 апреля 2021 г.
- ^ Оландер, Тимоти; Велдан, Кристофер (1 августа 2019 г.). «Усовершенствованный метод Дворжака (ADT) для оценки интенсивности тропических циклонов: обновление и новые возможности» . Американское метеорологическое общество . 34 (4): 905–907. Бибкод : 2019WtFor..34..905O . дои : 10.1175/WAF-D-19-0007.1 . Архивировано из оригинала 21 апреля 2021 года . Проверено 21 апреля 2021 г.
- ^ Вельден, Кристофер; Херндон, Деррик (21 июля 2020 г.). «Консенсусный подход к оценке интенсивности тропических циклонов с помощью метеорологических спутников: SATCON» . Американское метеорологическое общество . 35 (4): 1645–1650. Бибкод : 2020WtFor..35.1645V . дои : 10.1175/WAF-D-20-0015.1 . Архивировано из оригинала 21 апреля 2021 года . Проверено 21 апреля 2021 г.
- ^ Чен, Буо-Фу; Чен, Бойо; Линь, Сюань-Тянь; Элсберри, Рассел (апрель 2019 г.). «Оценка интенсивности тропических циклонов по спутниковым снимкам с использованием сверточных нейронных сетей» . Американское метеорологическое общество . 34 (2): 448. Бибкод : 2019WtFor..34..447C . дои : 10.1175/WAF-D-18-0136.1 . hdl : 10945/62506 . Архивировано из оригинала 21 апреля 2021 года . Проверено 21 апреля 2021 г.
- ^ Дэвис, Кайл; Цзэн, Сюбинь (1 февраля 2019 г.). «Сезонный прогноз накопленной энергии циклонов в Северной Атлантике и активности крупных ураганов» . Погода и прогнозирование . 34 (1). Американское метеорологическое общество: 221–232. Бибкод : 2019WtFor..34..221D . дои : 10.1175/WAF-D-18-0125.1 . hdl : 10150/632896 . S2CID 128293725 .
- ^ Вилларини, Габриэле; Векки, Габриэль А. (15 января 2012 г.). «Индекс рассеиваемой мощности (PDI) в Северной Атлантике и накопленная энергия циклонов (ACE): статистическое моделирование и чувствительность к изменениям температуры поверхности моря». Журнал климата . 25 (2). Американское метеорологическое общество: 625–637. Бибкод : 2012JCli...25..625В . дои : 10.1175/JCLI-D-11-00146.1 . S2CID 129106927 .
- ^ Ислам, штат Мэриленд Резуанал; Ли, Цзя-Ин; Мандли, Кайл Т.; Такаги, Хироши (18 августа 2021 г.). «Новый индекс нагонов тропических циклонов, учитывающий влияние геометрии побережья, батиметрии и информации о штормах» . Научные отчеты . 11 (1): 16747. Бибкод : 2021NatSR..1116747I . дои : 10.1038/s41598-021-95825-7 . ПМЦ 8373937 . ПМИД 34408207 .
- ^ Перейти обратно: а б Резапур, Мехди; Бэлдок, Том Э. (1 декабря 2014 г.). «Классификация опасностей ураганов: важность осадков» . Погода и прогнозирование . 29 (6). Американское метеорологическое общество: 1319–1331. Бибкод : 2014WtFor..29.1319R . дои : 10.1175/WAF-D-14-00014.1 . S2CID 121762550 .
- ^ Козар, Майкл Э; Мишра, Васубандху (16 февраля 2019 г.). «Комплексная кинетическая энергия в тропических циклонах Северной Атлантики: климатология, анализ и сезонные применения». Ураганный риск . Том. 1. Спрингер. стр. 43–69. дои : 10.1007/978-3-030-02402-4_3 . ISBN 978-3-030-02402-4 . S2CID 133717045 .
- ^ «Узнайте разницу между ураганами, циклонами и тайфунами» , ABC , Inc., KGO-TV Сан-Франциско, Новости канала 7. Проверено 25 мая 2023 г.
- ^ Перейти обратно: а б с д и ж Смит, Рэй (1990). «Что в имени?» (PDF) . Погода и климат . 10 (1). Метеорологическое общество Новой Зеландии : 24–26. дои : 10.2307/44279572 . JSTOR 44279572 . S2CID 201717866 . Архивировано из оригинала (PDF) 29 ноября 2014 года . Проверено 25 августа 2014 г.
- ^ Перейти обратно: а б с д и Дорст, Нил М. (23 октября 2012 г.). «Они называли Ветер Махина: История наименования циклонов» . Отдел исследования ураганов , Атлантическая океанографическая и метеорологическая лаборатория . Национальное управление океанических и атмосферных исследований . п. Слайды 8–72.
- ^ Офис федерального координатора метеорологического обслуживания и поддержки исследований (май 2017 г.). Национальный план действий при ураганах (PDF) (Отчет). Национальное управление океанических и атмосферных исследований . стр. 26–28. Архивировано (PDF) из оригинала 15 октября 2018 г. Проверено 14 октября 2018 г.
- ^ Ландер, Марк А.; и др. (3 августа 2003 г.). «Пятый международный семинар по тропическим циклонам» . Всемирная метеорологическая организация . Архивировано из оригинала 9 мая 2009 года . Проверено 6 мая 2009 г.
- ^ Атлантическая океанографическая и метеорологическая лаборатория, Отдел исследования ураганов. «Часто задаваемые вопросы: Что такое внетропический циклон?» . Национальное управление океанических и атмосферных исследований . Архивировано из оригинала 9 февраля 2007 года . Проверено 25 июля 2006 г.
- ^ «Урок 14: Предыстория: синоптическая шкала» . Университет Висконсина-Мэдисона . 25 февраля 2008 года. Архивировано из оригинала 20 февраля 2009 года . Проверено 6 мая 2009 г.
- ^ «Обзор потери прибрежных земель: с упором на юго-восток США» . Геологическая служба США . 2008. Архивировано из оригинала 12 февраля 2009 года . Проверено 6 мая 2009 г.
- ^ Атлантическая океанографическая и метеорологическая лаборатория, Отдел исследования ураганов. «Часто задаваемые вопросы: Что такое субтропический циклон?» . Национальное управление океанических и атмосферных исследований . Архивировано из оригинала 11 октября 2011 года . Проверено 25 июля 2006 г.
- ^ Перейти обратно: а б Национальная метеорологическая служба (19 октября 2005 г.). «Структура тропического циклона» . JetStream — онлайн-школа погоды . Национальное управление океанических и атмосферных исследований . Архивировано из оригинала 7 декабря 2013 года . Проверено 7 мая 2009 г.
- ^ Паш, Ричард Дж.; Эрик С. Блейк; Хью Д. Кобб III; Дэвид П. Робертс (28 сентября 2006 г.). «Отчет о тропическом циклоне: ураган Вильма: 15–25 октября 2005 г.» (PDF) . Национальный центр ураганов . Архивировано (PDF) из оригинала 4 марта 2016 г. Проверено 14 декабря 2006 г.
- ^ Перейти обратно: а б с Аннамалай, Х.; Слинго, Дж. М.; Спербер, КР; Ходжес, К. (1999). «Средняя эволюция и изменчивость летних муссонов в Азии: сравнение повторных анализов ECMWF и NCEP – NCAR» . Ежемесячный обзор погоды . 127 (6): 1157–1186. Бибкод : 1999MWRv..127.1157A . doi : 10.1175/1520-0493(1999)127<1157:TMEAVO>2.0.CO;2 . Архивировано из оригинала 1 августа 2020 года . Проверено 12 декабря 2019 г.
- ^ Американское метеорологическое общество . «Глоссарий AMS: C» . Словарь метеорологии . Аллен Пресс . Архивировано из оригинала 26 января 2011 года . Проверено 14 декабря 2006 г.
- ^ Отдел Атлантической океанографии и исследований ураганов. «Часто задаваемые вопросы: что такое «концентрические циклы глазных стенок» (или «циклы замены глазных стенок») и почему они вызывают ослабление максимального ветра урагана?» . Национальное управление океанических и атмосферных исследований . Архивировано из оригинала 6 декабря 2006 года . Проверено 14 декабря 2006 г.
- ^ «Глобальное руководство по прогнозированию тропических циклонов: глава 2: Структура тропических циклонов» . Бюро метеорологии . 7 мая 2009 года. Архивировано из оригинала 1 июня 2011 года . Проверено 6 мая 2009 г.
- ^ Перейти обратно: а б Чавас, ДР; Эмануэль, Калифорния (2010). «Климатология QuikSCAT размером с тропический циклон». Письма о геофизических исследованиях . 37 (18): н/д. Бибкод : 2010GeoRL..3718816C . дои : 10.1029/2010GL044558 . hdl : 1721.1/64407 . S2CID 16166641 .
- ^ Перейти обратно: а б «Вопрос: Каков средний размер тропического циклона?» . Объединенный центр предупреждения о тайфунах . 2009. Архивировано из оригинала 4 октября 2013 года . Проверено 7 мая 2009 г.
- ^ Перейти обратно: а б Меррилл, Роберт Т. (1984). «Сравнение больших и малых тропических циклонов». Ежемесячный обзор погоды . 112 (7): 1408–1418. Бибкод : 1984MWRv..112.1408M . doi : 10.1175/1520-0493(1984)112<1408:ACOLAS>2.0.CO;2 . HDL : 10217/200 . S2CID 123276607 .
- ^ Дорст, Нил; Отдел исследования ураганов (29 мая 2009 г.). «Часто задаваемые вопросы: Тема: E5) Какие тропические циклоны являются самыми большими и самыми маленькими в истории?» . Атлантическая океанографическая и метеорологическая лаборатория Национального управления океанических и атмосферных исследований. Архивировано из оригинала 22 декабря 2008 года . Проверено 12 июня 2013 г.
- ^ Холланд, Дж.Дж. (1983). «Движение тропического циклона: взаимодействие с окружающей средой плюс бета-эффект» . Журнал атмосферных наук . 40 (2): 328–342. Бибкод : 1983JAtS...40..328H . doi : 10.1175/1520-0469(1983)040<0328:TCMEIP>2.0.CO;2 . S2CID 124178238 .
- ^ Дорст, Нил; Отдел исследования ураганов (26 января 2010 г.). «Тема: E6) Часто задаваемые вопросы: Какой тропический циклон продержался дольше всех?» . Атлантическая океанографическая и метеорологическая лаборатория Национального управления океанических и атмосферных исследований. Архивировано из оригинала 6 мая 2009 года . Проверено 12 июня 2013 г.
- ^ Дорст, Нил; Дельгадо, Сэнди; Отдел исследования ураганов (20 мая 2011 г.). «Часто задаваемые вопросы: Тема: E7) На какое расстояние прошел тропический циклон?» . Атлантическая океанографическая и метеорологическая лаборатория Национального управления океанических и атмосферных исследований. Архивировано из оригинала 6 мая 2009 года . Проверено 12 июня 2013 г.
- ^ «Смертоносный циклон Фредди стал самым продолжительным тропическим штормом на Земле» . газета «Вашингтон Пост» . 7 марта 2023 г. . Проверено 27 сентября 2023 г.
- ^ Перейти обратно: а б с Галарно, Томас Дж.; Дэвис, Кристофер А. (1 февраля 2013 г.). «Диагностика ошибок прогноза движения тропических циклонов» . Ежемесячный обзор погоды . 141 (2). Американское метеорологическое общество: 405–430. Бибкод : 2013MWRv..141..405G . дои : 10.1175/MWR-D-12-00071.1 . S2CID 58921153 .
- ^ Перейти обратно: а б Атлантическая океанографическая и метеорологическая лаборатория, Отдел исследования ураганов. «Часто задаваемые вопросы: Что определяет движение тропических циклонов?» . Национальное управление океанических и атмосферных исследований . Архивировано из оригинала 16 июля 2012 года . Проверено 25 июля 2006 г.
- ^ Перейти обратно: а б Ву, Чун-Чье; Эмануэль, Керри А. (1 января 1995 г.). «Диагностика потенциальной завихренности движения урагана. Часть 1: Тематическое исследование урагана Боб (1991)» . Ежемесячный обзор погоды . 123 (1). Американское метеорологическое общество: 69–92. Бибкод : 1995MWRv..123...69W . doi : 10.1175/1520-0493(1995)123<0069:PVDOHM>2.0.CO;2 .
- ^ Карр, Ле; Элсберри, Рассел Л. (15 февраля 1990 г.). «Наблюдения за предсказаниями распространения тропических циклонов относительно управления окружающей средой» . Журнал атмосферных наук . 47 (4). Американское метеорологическое общество: 542–546. Бибкод : 1990JAtS...47..542C . doi : 10.1175/1520-0469(1990)047<0542:OEFPOT>2.0.CO;2 . S2CID 121754290 .
- ^ Перейти обратно: а б Велден, Кристофер С.; Лесли, Лэнс М. (1 июня 1991 г.). «Основная связь между интенсивностью тропических циклонов и глубиной управляющего слоя окружающей среды в австралийском регионе» . Погода и прогнозирование . 6 (2). Американское метеорологическое общество: 244–253. Бибкод : 1991WtFor...6..244V . doi : 10.1175/1520-0434(1991)006<0244:TBRBTC>2.0.CO;2 .
- ^ Чан, Джонни CL (январь 2005 г.). «Физика движения тропических циклонов». Ежегодный обзор механики жидкости . 37 (1). Годовые обзоры: 99–128. Бибкод : 2005АнРФМ..37...99С . doi : 10.1146/annurev.fluid.37.061903.175702 .
- ^ Атлантическая океанографическая и метеорологическая лаборатория, Отдел исследования ураганов. «Часто задаваемые вопросы: Что такое восточная волна?» . Национальное управление океанических и атмосферных исследований . Архивировано из оригинала 18 июля 2006 года . Проверено 25 июля 2006 г.
- ^ Авила, Луизиана; Паш, Р.Дж. (1995). «Атлантические тропические системы 1993 года» . Ежемесячный обзор погоды . 123 (3): 887–896. Бибкод : 1995MWRv..123..887A . doi : 10.1175/1520-0493(1995)123<0887:ATSO>2.0.CO;2 .
- ^ ДеКария, Алекс (2005). «Урок 5 – Тропические циклоны: климатология» . ESCI 344 – Тропическая метеорология . Миллерсвилльский университет . Архивировано из оригинала 7 мая 2008 года . Проверено 22 февраля 2008 г.
- ^ Карр, Лестер Э.; Элсберри, Рассел Л. (1 февраля 1995 г.). «Взаимодействие муссонов, приводящее к внезапным изменениям траектории тропических циклонов» . Ежемесячный обзор погоды . 123 (2). Американское метеорологическое общество: 265–290. Бибкод : 1995MWRv..123..265C . doi : 10.1175/1520-0493(1995)123<0265:MILTST>2.0.CO;2 .
- ^ Перейти обратно: а б Ван, Бин; Элсберри, Рассел Л.; Юцин, Ван; Лигуан, Ву (1998). «Динамика движения тропических циклонов: обзор» (PDF) . Китайский журнал атмосферных наук . 22 (4). Аллертон Пресс: 416–434. Архивировано (PDF) из оригинала 17 июня 2021 г. Получено 6 апреля 2021 г. - через Гавайский университет.
- ^ Холланд, Грег Дж. (1 февраля 1983 г.). «Движение тропического циклона: взаимодействие с окружающей средой плюс бета-эффект» . Журнал атмосферных наук . 40 (2). Американское метеорологическое общество: 328–342. Бибкод : 1983JAtS...40..328H . doi : 10.1175/1520-0469(1983)040<0328:TCMEIP>2.0.CO;2 .
- ^ Фиорино, Майкл; Элсберри, Рассел Л. (1 апреля 1989 г.). «Некоторые аспекты вихревой структуры, связанные с движением тропических циклонов» . Журнал атмосферных наук . 46 (7). Американское метеорологическое общество: 975–990. Бибкод : 1989JAtS...46..975F . doi : 10.1175/1520-0469(1989)046<0975:SAOVSR>2.0.CO;2 .
- ^ Ли, Сяофань; Ван, Бинь (1 марта 1994 г.). «Баротропная динамика бета-круговоротов и бета-дрейфа» . Журнал атмосферных наук . 51 (5). Американское метеорологическое общество: 746–756. Бибкод : 1994JAtS...51..746L . doi : 10.1175/1520-0469(1994)051<0746:BDOTBG>2.0.CO;2 .
- ^ Уиллоуби, HE (1 сентября 1990 г.). «Линейные нормальные моды движущегося мелководного баротропного вихря» . Журнал атмосферных наук . 47 (17). Американское метеорологическое общество: 2141–2148. Бибкод : 1990JAtS...47.2141W . doi : 10.1175/1520-0469(1990)047<2141:LNMOAM>2.0.CO;2 .
- ^ Хилл, Кевин А.; Лакманн, Гэри М. (1 октября 2009 г.). «Влияние влажности окружающей среды на размер тропического циклона» . Ежемесячный обзор погоды . 137 (10). Американское метеорологическое общество: 3294–3315. Бибкод : 2009MWRv..137.3294H . дои : 10.1175/2009MWR2679.1 .
- ^ Сунь, Юань; Чжун, Чжун; Йи, Лан; Ли, Тим; Чен, Мин; Ван, Хунчао; Ван, Юйсин; Чжун, Кай (27 ноября 2015 г.). «Зависимость взаимосвязи между траекторией тропических циклонов и высокой интенсивностью субтропических субтропиков западной части Тихого океана от начального размера шторма: численное исследование: ЧУВСТВИТЕЛЬНОСТЬ TC И WPSH К РАЗМЕРУ ШТОРМА» . Журнал геофизических исследований: Атмосфера . 120 (22). John Wiley & Sons: 11, 451–11, 467. doi : 10.1002/2015JD023716 .
- ^ «Эффект Фудживары описывает бурный вальс» . США сегодня . 9 ноября 2007 года. Архивировано из оригинала 5 ноября 2012 года . Проверено 21 февраля 2008 г.
- ^ «Раздел 2: Терминология движения тропических циклонов» . Лаборатория военно-морских исследований США. 10 апреля 2007. Архивировано из оригинала 12 февраля 2012 года . Проверено 7 мая 2009 г.
- ^ Пауэлл, Джефф; и др. (май 2007 г.). «Ураган Айок: 20–27 августа 2006 г.» . Тропические циклоны 2006 г. Центральная часть северной части Тихого океана . Центрально-Тихоокеанский центр ураганов . Архивировано из оригинала 6 марта 2016 года . Проверено 9 июня 2007 г.
- ^ Рот, Дэвид и Кобб, Хью (2001). «Ураганы Вирджинии восемнадцатого века» . НОАА. Архивировано из оригинала 1 мая 2013 года . Проверено 24 февраля 2007 г.
- ^ Перейти обратно: а б с Шульц, Дж. М.; Рассел, Дж.; Эспинель, З. (2005). «Эпидемиология тропических циклонов: динамика бедствий, болезней и развития» . Эпидемиологические обзоры . 27 : 21–35. дои : 10.1093/epirev/mxi011 . ПМИД 15958424 .
- ^ Нотт, Джонатан; Грин, Камилла; Таунсенд, Ян; Каллаган, Джеффри (9 июля 2014 г.). «Мировой рекордный штормовой нагон и самый интенсивный тропический циклон в южном полушарии: новые данные и моделирование» . Бюллетень Американского метеорологического общества . 5 (95): 757. Бибкод : 2014BAMS...95..757N . дои : 10.1175/BAMS-D-12-00233.1 .
- ^ Кэри, Венди; Роджерс, Спенсер (26 апреля 2012 г.). «Разрывные течения — координация прибрежных исследований, информационно-пропагандистской деятельности и методологий прогнозирования для повышения общественной безопасности» . Конференция «Решения прибрежных катастроф», 2005 г. Американское общество инженеров-строителей: 285–296. дои : 10.1061/40774(176)29 . ISBN 9780784407745 . Архивировано из оригинала 26 мая 2022 года . Проверено 25 мая 2022 г.
- ^ Раппапорт, Эдвард Н. (1 сентября 2000 г.). «Гибель людей в Соединенных Штатах, связанная с недавними атлантическими тропическими циклонами» . Бюллетень Американского метеорологического общества . 81 (9). Американское метеорологическое общество: 2065–2074 гг. Бибкод : 2000BAMS...81.2065R . doi : 10.1175/1520-0477(2000)081<2065:LOLITU>2.3.CO;2 . S2CID 120065630 . Архивировано из оригинала 26 мая 2022 года . Проверено 25 мая 2022 г.
- ^ Атлантическая океанографическая и метеорологическая лаборатория, Отдел исследования ураганов. «Часто задаваемые вопросы: торнадо TC слабее, чем торнадо в средних широтах?» . Национальное управление океанических и атмосферных исследований . Архивировано из оригинала 14 сентября 2009 года . Проверено 25 июля 2006 г.
- ^ Гразулис, Томас П.; Гразулис, Дорис (27 февраля 2018 г.). «25 крупнейших ураганов, вызывающих торнадо» . Проект Торнадо . Сент-Джонсбери, Вермонт : Экологические фильмы. Архивировано из оригинала 12 декабря 2013 года . Проверено 8 ноября 2021 г.
- ^ Бовало, К.; Барт, К.; Ю, Н.; Бег, Н. (16 июля 2014 г.). «Грозовая активность в тропических циклонах в юго-западной части Индийского океана» . Журнал геофизических исследований: Атмосфера . 119 (13). АГУ: 8231–8244. Бибкод : 2014JGRD..119.8231B . дои : 10.1002/2014JD021651 . S2CID 56304603 .
- ^ Самсури, Кристофер Э.; Орвилл, Ричард Э. (1 августа 1994 г.). «Молнии от облаков к земле в тропических циклонах: исследование ураганов Хьюго (1989) и Джерри (1989)» . Ежемесячный обзор погоды . 122 (8). Американское метеорологическое общество: 1887–1896 гг. Бибкод : 1994MWRv..122.1887S . doi : 10.1175/1520-0493(1994)122<1887:CTGLIT>2.0.CO;2 .
- ^ Кольер, Э.; Заутер, Т.; Мёлг, Т.; Харди, Д. (10 июня 2019 г.). «Влияние тропических циклонов на циркуляцию, перенос влаги и накопление снега на Килиманджаро в сезоне 2006–2007 гг.» . Журнал геофизических исследований: Атмосфера . 124 (13). АГУ: 6919–6928. Бибкод : 2019JGRD..124.6919C . дои : 10.1029/2019JD030682 . S2CID 197581044 . Проверено 25 мая 2022 г.
- ^ Осборн, Мартин; Малавель, Флоран Ф.; Адам, Мариана; Буксманн, Джоэль; Сюжье, Жаклин; Маренко, Франко (20 марта 2019 г.). «Сахарская пыль и аэрозоли, сжигающие биомассу, во время бывшего урагана Офелия: наблюдения новой сети британских лидаров и солнечных фотометров» . Химия и физика атмосферы . 19 (6). Публикации Коперника: 3557–3578. Бибкод : 2019ACP....19.3557O . дои : 10.5194/acp-19-3557-2019 . hdl : 10871/36358 . S2CID 208084167 . Архивировано из оригинала 24 января 2022 года . Проверено 25 мая 2022 г.
- ^ Мур, Пол (3 августа 2021 г.). «Анализ шторма Офелия, обрушившегося на Ирландию 16 октября 2017 года» . Погода . 76 (9). Королевское метеорологическое общество: 301–306. Бибкод : 2021Wthr...76..301M . дои : 10.1002/wea.3978 . S2CID 238835099 . Проверено 25 мая 2022 г.
- ^ Перейти обратно: а б Филбрик, Ян Пасад; Ву, Эшли (2 декабря 2022 г.). «Рост населения делает ураганы более дорогими» . Нью-Йорк Таймс . Архивировано из оригинала 6 декабря 2022 года. Газета указывает источник данных: NOAA.
- ^ Хак, Убидул; Хашизуме, Масахиро; Коливрас, Корин Н; Овергаард, Ханс Дж; Дас, Биваш; Ямамото, Таро (16 марта 2011 г.). «Снижение смертности от циклонов в Бангладеш: что еще нужно сделать?» . Бюллетень Всемирной организации здравоохранения . Архивировано из оригинала 5 октября 2020 года . Проверено 12 октября 2020 г.
- ^ «Отчет о ситуации с ураганом Катрина № 11» (PDF) . Управление поставок электроэнергии и энергетической надежности (OE) Министерства энергетики США . 30 августа 2005 г. Архивировано из оригинала (PDF) 8 ноября 2006 г. . Проверено 24 февраля 2007 г.
- ^ Адам, Кристофер; Беван, Дэвид (декабрь 2020 г.). «Тропические циклоны и восстановление общественной инфраструктуры в развивающихся странах после стихийных бедствий» . Экономическое моделирование . 93 : 82–99. дои : 10.1016/j.econmod.2020.07.003 . S2CID 224926212 . Проверено 25 мая 2022 г.
- ^ Куни, Фредерик К. (1994). Абрамс, Сьюзен (ред.). Бедствия и развитие (PDF) . ИНТЕРТЕКТ Пресс. п. 45. ИСБН 0-19-503292-6 . Архивировано (PDF) из оригинала 26 мая 2022 г. Проверено 25 мая 2022 г.
- ^ Ле Де, Лоик; Рей, Тони; Леоне, Фредерик; Гилберт, Дэвид (16 января 2018 г.). «Устойчивые средства к существованию и эффективность реагирования на стихийные бедствия: пример тропического циклона Пэм в Вануату» . Природные опасности . 91 (3). Спрингер: 1203–1221. Бибкод : 2018NatHa..91.1203L . дои : 10.1007/s11069-018-3174-6 . S2CID 133651688 . Архивировано из оригинала 26 мая 2022 года . Проверено 25 мая 2022 г.
- ^ Перес, Эдди; Томпсон, Пол (сентябрь 1995 г.). «Природные опасности: причины и следствия: Урок 5 — Тропические циклоны (ураганы, тайфуны, багиос, кордонасос, тайнос)» . Догоспитальная медицина и медицина катастроф . 10 (3). Издательство Кембриджского университета: 202–217. дои : 10.1017/S1049023X00042023 . ПМИД 10155431 . S2CID 36983623 . Архивировано из оригинала 26 мая 2022 года . Проверено 25 мая 2022 г.
- ^ Дебнат, Аджай (июль 2013 г.). «Состояние сельскохозяйственной продуктивности блока CD Госаба, Южный 24 Парганас, Западная Бенгалия, Индия, после сильного циклона Айла» . Международный журнал научных и исследовательских публикаций . 3 (7): 97–100. CiteSeerX 10.1.1.416.3757 . ISSN 2250-3153 . Архивировано из оригинала 26 мая 2022 года . Проверено 25 мая 2022 г.
- ^ Нидхэм, Хэл Ф.; Кейм, Барри Д.; Сатиарадж, Дэвид (19 мая 2015 г.). «Обзор штормовых нагонов, вызванных тропическими циклонами: глобальные источники данных, наблюдения и последствия» . Обзоры геофизики . 53 (2). АГУ: 545–591. Бибкод : 2015RvGeo..53..545N . дои : 10.1002/2014RG000477 . S2CID 129145744 .
- ^ Ландси, Крис . «Таблица изменчивости климата — Тропические циклоны» . Атлантическая океанографическая и метеорологическая лаборатория Национального управления океанических и атмосферных исследований . Архивировано из оригинала 2 октября 2012 года . Проверено 19 октября 2006 г.
- ^ Беллес, Джонатан (28 августа 2018 г.). «Почему тропические волны важны во время сезона ураганов» . Погода.com. Архивировано из оригинала 1 октября 2020 года . Проверено 2 октября 2020 г.
- ^ Шварц, Мэтью (22 ноября 2020 г.). «Самый сильный тропический циклон в Сомали, когда-либо зарегистрированный, может вызвать двухлетний дождь за 2 дня» . ЭНЕРГЕТИЧЕСКИЙ ЯДЕРНЫЙ РЕАКТОР. Архивировано из оригинала 23 ноября 2020 года . Проверено 23 ноября 2020 г.
- ^ Мутиге, Миссисипи; Малерб, Дж.; Энглбрехт, ФА; Граб, С.; Бераки, А.; Маиша, ТР; Ван дер Мерве, Дж. (2018). «Прогнозируемые изменения тропических циклонов над юго-западной частью Индийского океана при различной степени глобального потепления» . Письма об экологических исследованиях . 13 (6): 065019. Бибкод : 2018ERL....13f5019M . дои : 10.1088/1748-9326/aabc60 . S2CID 54879038 .
- ^ Мастерс, Джефф. «Ураган Катрина в Африке: тропический циклон Идай вызывает огромную катастрофу» . Погода под землей . Архивировано из оригинала 22 марта 2019 года . Проверено 23 марта 2019 г.
- ^ «Обзор глобальной катастрофы: первая половина 2019 года» (PDF) . Аон Бенфилд. Архивировано (PDF) из оригинала 12 августа 2019 г. Проверено 12 августа 2019 г.
- ^ Лайонс, Стив (17 февраля 2010 г.). "Династия дождей на острове Реюньон!" . Погодный канал. Архивировано из оригинала 10 февраля 2014 года . Проверено 4 февраля 2014 г.
- ^ Экстремальные осадки (Отчет). Метео Франция. Архивировано из оригинала 21 февраля 2014 года . Проверено 15 апреля 2013 г.
- ^ Рэндалл С. Червени; и др. (июнь 2007 г.). «Рекорды экстремальной погоды» . Бюллетень Американского метеорологического общества . 88 (6): 856, 858. Бибкод : 2007BAMS...88..853C . дои : 10.1175/BAMS-88-6-853 .
- ^ Фрэнк, Нил Л.; Хусейн, ЮАР (июнь 1971 г.). «Самый смертоносный тропический циклон в истории?» . Бюллетень Американского метеорологического общества . 52 (6): 438. Бибкод : 1971BAMS...52..438F . doi : 10.1175/1520-0477(1971)052<0438:TDTCIH>2.0.CO;2 . S2CID 123589011 .
- ^ Анализ погоды, климата и катастроф: Годовой отчет за 2019 год (PDF) (Отчет). АОН Бенфилд. 22 января 2020 г. Архивировано (PDF) из оригинала 22 января 2020 г. . Проверено 23 января 2020 г.
- ^ Шарп, Алан; Артур, Крейг; Боб Чечет; Марк Эдвардс (2007). Стихийные бедствия в Австралии: Определение требований к анализу рисков (PDF) (Отчет). Геонауки Австралии. п. 45. Архивировано (PDF) из оригинала 31 октября 2020 г. Проверено 11 октября 2020 г.
- ^ Климат Фиджи (PDF) (информационный лист: 35). Метеорологическая служба Фиджи. 28 апреля 2006 г. Архивировано (PDF) из оригинала 20 марта 2021 г. . Проверено 29 апреля 2021 г.
- ^ Республика Фиджи: Третий национальный доклад по Рамочной конвенции Организации Объединенных Наций об изменении климата (PDF) (Отчет). Рамочная конвенция ООН об изменении климата. 27 апреля 2020 г. с. 62. Архивировано (PDF) из оригинала 6 июля 2021 года . Проверено 23 августа 2021 г.
- ^ «Список погибших» . Канберра Таймс . Австралийское агентство Ассошиэйтед Пресс. 18 июня 1973 года. Архивировано из оригинала 27 августа 2020 года . Проверено 22 апреля 2020 г.
- ^ Мастерс, Джефф. «Ураган Катрина в Африке: тропический циклон Идай вызывает огромную катастрофу» . Погода под землей . Архивировано из оригинала 4 августа 2019 года . Проверено 23 марта 2019 г.
- ^ «Погодные и климатические катастрофы стоимостью в миллиарды долларов» . Национальные центры экологической информации. Архивировано из оригинала 11 августа 2021 года . Проверено 23 августа 2021 г.
- ^ Перейти обратно: а б Блейк, Эрик С.; Зеленский, Дэвид А. Отчет о тропическом циклоне: ураган Харви (PDF) (Отчет). Национальный центр ураганов. Архивировано (PDF) из оригинала 26 января 2018 г. Проверено 23 августа 2021 г.
- ^ Франклин, Джеймс Л. (22 февраля 2006 г.). Отчет о тропическом циклоне: ураган Винс (PDF) (Отчет). Национальный центр ураганов. Архивировано (PDF) из оригинала 2 октября 2015 г. Проверено 14 августа 2011 г.
- ^ Блейк, Эрик (18 сентября 2020 г.). Обсуждение субтропического шторма «Альфа» номер 2 (отчет). Национальный центр ураганов. Архивировано из оригинала 9 октября 2020 года . Проверено 18 сентября 2020 г.
- ^ Эмануэль, К. (июнь 2005 г.). «Происхождение и поддержание «средиземноморских ураганов» » . Достижения в области наук о Земле . 2 : 217–220. Бибкод : 2005AdG.....2..217E . дои : 10.5194/adgeo-2-217-2005 . Архивировано из оригинала 23 мая 2022 года . Проверено 23 мая 2022 г.
- ^ Пилке, Р.А. младший; Рубьера, Дж; Ландси, К; Фернандес, ML; Кляйн, Р. (2003). «Уязвимость к ураганам в Латинской Америке и Карибском бассейне» (PDF) . Национальный обзор опасностей. Архивировано (PDF) из оригинала 10 августа 2006 г. Проверено 20 июля 2006 г.
- ^ Раппапорт, Эд (9 декабря 1993 г.). Предварительный отчет о тропическом шторме Брет (GIF) (Отчет). Национальный центр ураганов. п. 3. Архивировано из оригинала 3 марта 2016 года . Проверено 11 августа 2015 г.
- ^ Ландси, Кристофер В. (13 июля 2005 г.). «Тема: Названия тропических циклонов: G6) Почему в южной части Атлантического океана не бывает тропических циклонов?» . Часто задаваемый вопрос о тропическом циклоне . Отдел исследования ураганов Национального управления океанических и атмосферных исследований США. Архивировано из оригинала 27 марта 2015 года . Проверено 7 февраля 2015 г.
- ^ МакТаггарт-Коуэн, Рон; Босарт, Лэнс Ф.; Дэвис, Кристофер А.; Аталлах, Эйад Х.; Гьякум, Джон Р.; Эмануэль, Керри А. (ноябрь 2006 г.). «Анализ урагана Катарина (2004 г.)» (PDF) . Ежемесячный обзор погоды . 134 (11). Американское метеорологическое общество: 3029–3053. Бибкод : 2006MWRv..134.3029M . дои : 10.1175/MWR3330.1 . Архивировано (PDF) из оригинала 30 августа 2021 г. Проверено 23 мая 2022 г.
- ^ Национальное управление океанических и атмосферных исследований . Прогноз ураганов в тропической восточной части северной части Тихого океана, 2005 г. Архивировано 12 июня 2015 года в Wayback Machine . Проверено 2 мая 2006 г.
- ^ «Летние тропические штормы не исправляют засуху» . ScienceDaily . 27 мая 2015 г. Архивировано из оригинала 9 октября 2021 г. Проверено 10 апреля 2021 г.
- ^ Ю, Джиён; Квон, Хён Хан; Итак, Бён Джин; Раджагопалан, Баладжи; Ким, Тэ Ун (28 апреля 2015 г.). «Определение роли тайфунов в борьбе с засухой в Южной Корее на основе скрытых моделей цепей Маркова: РОЛЬ ТАЙФУНОВ КАК разрушителей засухи» . Письма о геофизических исследованиях . 42 (8): 2797–2804. дои : 10.1002/2015GL063753 .
- ^ Кам, Джонхун; Шеффилд, Джастин; Юань, Син; Вуд, Эрик Ф. (15 мая 2013 г.). «Влияние атлантических тропических циклонов на засуху на востоке США (1980–2007 гг.)» . Журнал климата . 26 (10). Американское метеорологическое общество: 3067–3086. Бибкод : 2013JCli...26.3067K . дои : 10.1175/JCLI-D-12-00244.1 .
- ^ Национальная метеорологическая служба (19 октября 2005 г.). «Введение в тропический циклон» . JetStream — онлайн-школа погоды . Национальное управление океанических и атмосферных исследований . Архивировано из оригинала 14 июня 2012 года . Проверено 7 сентября 2010 г.
- ^ Эмануэль, Керри (июль 2001 г.). «Вклад тропических циклонов в меридиональный перенос тепла океанами» . Журнал геофизических исследований . 106 (Д14): 14771–14781. Бибкод : 2001JGR...10614771E . дои : 10.1029/2000JD900641 .
- ^ Алекс Фокс. (20 июня 2023 г.). «Новые измерения показывают, что тропические циклоны могут влиять на глобальный климат». Калифорнийский университет в Сан-Диего. Веб-сайт Океанографического института Скриппса Проверено 30 июня 2023 г.
- ^ Гутьеррес Брисуэла, Ноэль; Алфорд, Мэтью Х.; Се, Шан-Пин ; Спринталл, Джанет; Воэт, Гуннар; Уорнер, Салли Дж.; Хьюз, Кеннет; Моум, Джеймс Н. (2023). «Длительное потепление термоклина околоинерционными внутренними волнами в следах тропических циклонов» . Труды Национальной академии наук Соединенных Штатов Америки . 120 (26): e2301664120. Бибкод : 2023PNAS..12001664G . дои : 10.1073/pnas.2301664120 . ISSN 0027-8424 . ПМЦ 10293854 . ПМИД 37339203 .
- ^ Кристоферсон, Роберт В. (1992). Геосистемы: Введение в физическую географию . Нью-Йорк: Издательская компания Macmillan. стр. 222–224. ISBN 978-0-02-322443-0 .
- ^ Кханна, Шрути; Сантос, Мария Дж.; Колтунов, Александр; Шапиро, Кристен Д.; Лэй, Муи; Устин, Сьюзан Л. (17 февраля 2017 г.). «Потери болот из-за совокупного воздействия урагана Исаак и разлива нефти Deepwater Horizon в Луизиане» . Дистанционное зондирование . 9 (2). MDPI: 169. Бибкод : 2017RemS....9..169K . дои : 10.3390/rs9020169 .
- ^ Осланд, Майкл Дж.; Фехер, Лаура К.; Андерсон, Гордон Х.; Варваеке, Уильям К.; Краусс, Кен В.; Уилан, Кевин РТ; Балентайн, Карен М.; Тайлинг-Рейндж, Джинджер; Смит III, Томас Дж.; Кахун, Дональд Р. (26 мая 2020 г.). «Сдвиг экологического режима, вызванный тропическим циклоном: преобразование мангровых лесов в ил в национальном парке Эверглейдс (Флорида, США)» . Водно-болотные угодья и изменение климата . 40 (5). Спрингер: 1445–1458 гг. Бибкод : 2020Wetl...40.1445O . дои : 10.1007/s13157-020-01291-8 . S2CID 218897776 . Архивировано из оригинала 17 мая 2022 года . Проверено 27 мая 2022 г.
- ^ Перейти обратно: а б Ю, Зай-Джин (18 марта 2019 г.). «Опасности, вызванные тропическими циклонами, вызванные штормовыми нагонами и большими волнами на побережье Китая» . Геонауки . 9 (3): 131. Бибкод : 2019Geosc...9..131Y . doi : 10.3390/geosciences9030131 . ISSN 2076-3263 .
- ^ Занг, Чжэнчэнь; Сюэ, З. Джордж; Сюй, Кэхуэй; Бентли, Сэмюэл Дж.; Чен, Цинь; Д'Са, Эурико Дж.; Чжан, Ле; Оу, Янда (20 октября 2020 г.). «Роль ослабления света, вызванного отложениями, на первичное производство во время урагана Густав (2008 г.)» . Биогеонауки . 17 (20). Публикации Коперника: 5043–5055. Бибкод : 2020BGeo...17.5043Z . дои : 10.5194/bg-17-5043-2020 . hdl : 1912/26507 . S2CID 238986315 . Архивировано из оригинала 19 января 2022 года . Проверено 19 мая 2022 г.
- ^ Хуан, Венжуй; Мукерджи, Дебрадж; Чен, Шуйсен (март 2011 г.). «Оценка воздействия урагана Иван на хлорофилл-а в заливе Пенсакола с помощью дистанционного зондирования MODIS на расстоянии 250 м» . Бюллетень о загрязнении морской среды . 62 (3): 490–498. Бибкод : 2011MarPB..62..490H . дои : 10.1016/j.marpolbul.2010.12.010 . ПМИД 21272900 . Проверено 19 мая 2022 г.
- ^ Чен, Сюань; Адамс, Бенджамин Дж.; Платт, Уильям Дж.; Хупер-Бой, Линда М. (28 февраля 2020 г.). «Влияние тропического циклона на сообщества насекомых солончаков и процессы повторной сборки после циклона» . Экография . 43 (6). Интернет-библиотека Wiley: 834–847. Бибкод : 2020Экогр..43..834С . дои : 10.1111/ecog.04932 . S2CID 212990211 .
- ^ «Шторм Лесли сеет хаос в национальных лесах». Новости из Коимбры (на португальском языке). 17 октября 2018 года. Архивировано из оригинала 28 января 2019 года . Проверено 27 мая 2022 г.
- ^ Дойл, Томас (2005). «Ущерб от ветра и воздействие солености ураганов Катрина и Рита на прибрежные кипарисовые леса Луизианы» (PDF) . Архивировано (PDF) из оригинала 4 марта 2016 г. Проверено 13 февраля 2014 г.
- ^ Каппьело, Дина (2005). «Разливы от ураганов пятнают побережье Галереей» . Хьюстонские хроники . Архивировано из оригинала 25 апреля 2014 года . Проверено 12 февраля 2014 г.
- ^ Пайн, Джон К. (2006). «Ураган Катрина и разливы нефти: воздействие на прибрежную и океанскую среду» (PDF) . Океанография . 19 (2). Океанографическое общество: 37–39. дои : 10.5670/oceanog.2006.61 . Архивировано (PDF) из оригинала 20 января 2022 г. Проверено 19 мая 2022 г.
- ^ Перейти обратно: а б Сантелла, Николас; Стейнберг, Лаура Дж.; Сенгул, Хатидже (12 апреля 2010 г.). «Выбросы нефти и опасных материалов с промышленных объектов, связанных с ураганом Катрина» . Анализ рисков . 30 (4): 635–649. Бибкод : 2010РискА..30..635S . дои : 10.1111/j.1539-6924.2010.01390.x . ПМИД 20345576 . S2CID 24147578 . Проверено 21 мая 2022 г.
- ^ Цинь, Жуншуй; Хакзад, Нима; Чжу, Цзипин (май 2020 г.). «Обзор воздействия урагана Харви на химические и технологические предприятия в Техасе» . Международный журнал по снижению риска стихийных бедствий . 45 : 101453. Бибкод : 2020IJDRR..4501453Q . дои : 10.1016/j.ijdrr.2019.101453 . S2CID 214418578 . Проверено 19 мая 2022 г.
- ^ Мисури, Алессио; Морено, Валерия Кассон; Куддус, Нур; Коццани, Валерио (октябрь 2019 г.). «Уроки, извлеченные из воздействия урагана Харви на химическую и перерабатывающую промышленность» . Проектирование надежности и системная безопасность . 190 : 106521. doi : 10.1016/j.ress.2019.106521 . S2CID 191214528 . Проверено 19 мая 2022 г.
- ^ Каньедо, Сибели (29 марта 2019 г.). «После урагана Уилла уровень металлов в реке Балуарте повышается» (на испанском языке). Северо-восток. Архивировано из оригинала 30 сентября 2020 года . Проверено 19 мая 2022 г.
- ^ Перейти обратно: а б Деллапенна, Тимоти М.; Хельшер, Кристена; Хилл, Лиза; Аль Мукайми, Мохаммед Э.; Кнап, Энтони (15 декабря 2020 г.). «Как наводнение из тропических циклонов вызвало эрозию и рассеивание загрязненных ртутью отложений в городском устье: воздействие урагана Харви на залив Буффало и устье Сан-Хасинто, залив Галвестон, США» . Наука об общей окружающей среде . 748 : 141226. Бибкод : 2020ScTEn.74841226D . doi : 10.1016/j.scitotenv.2020.141226 . ПМК 7606715 . ПМИД 32818899 .
- ^ Перейти обратно: а б Вольто, Наташа; Дюват, Вирджиния, К.Э. (9 июля 2020 г.). «Применение направленных фильтров к спутниковым снимкам для оценки воздействия тропических циклонов на атоллы» . Прибрежные исследования . 36 (4). Меридиан Аллен Пресс: 732–740. doi : 10.2112/JCOASTRES-D-19-00153.1 . S2CID 220323810 . Архивировано из оригинала 25 января 2021 года . Проверено 21 мая 2022 г.
- ^ Перейти обратно: а б Буш, Мартин Дж. (9 октября 2019 г.). «Как положить конец климатическому кризису» . Изменение климата и возобновляемые источники энергии . Спрингер. стр. 421–475. дои : 10.1007/978-3-030-15424-0_9 . ISBN 978-3-030-15423-3 . S2CID 211444296 . Архивировано из оригинала 17 мая 2022 года . Проверено 21 мая 2022 г.
- ^ Онака, Сусуму; Итикава, Синго; Идзуми, Масатоши; Уда, Такааки; Хирано, Дзюнъити; Савада, Хидеки (2017). «Эффективность питания гравийных пляжей на острове в Тихом океане» . Азиатское и Тихоокеанское побережья . Всемирный научный: 651–662. дои : 10.1142/9789813233812_0059 . ISBN 978-981-323-380-5 . Архивировано из оригинала 16 мая 2022 года . Проверено 21 мая 2022 г.
- ^ Кенч, PS; Маклин, РФ; Оуэн, SD; Так, М.; Форд, MR (1 октября 2018 г.). «Отложившиеся штормом коралловые блоки: механизм островного генезиса, остров Тутага, атолл Фунафути, Тувалу» . Геология . 46 (10). Мир геонауки: 915–918. Бибкод : 2018Geo....46..915K . дои : 10.1130/G45045.1 . S2CID 135443385 . Проверено 21 мая 2022 г.
- ^ Бейкер, Джейсон Д.; Хартинг, Альберт Л.; Йоханос, Тея К.; Лондон, Джошуа М.; Барбьери, Мишель М.; Литнан, Чарльз Л. (август 2020 г.). «Утрата наземной среды обитания и долгосрочная жизнеспособность субпопуляции гавайских тюленей-монахов на мелководье французского фрегата» . Технический меморандум NOAA NMFS-PIFSC . НОАА по рыболовству. дои : 10.25923/76vx-ve75 . Архивировано из оригинала 12 мая 2022 года . Проверено 20 мая 2022 г.
- ^ Токар, Брайан; Гилбертсон, Тамра (31 марта 2020 г.). Климатическая справедливость и обновление сообщества: сопротивление и решения на низовом уровне . Рутледж. п. 70. ИСБН 9781000049213 . Архивировано из оригинала 17 мая 2022 года . Проверено 27 мая 2022 г.
- ^ Океан, Гром; Давать, Давать; Малавани, Мухамад Нгаинул; Мардиатно, Джати; Джахьяди, Ахмад; Нугрохо, Ферман Сетия (11 апреля 2020 г.). «Частота и величина оползней, пострадавших от тропического циклона Чемпака 27–29 ноября 2017 года в Пацитане, Восточная Ява» . Журнал горной науки . 17 (4). Спрингер: 773–786. Бибкод : 2020JMouS..17..773S . дои : 10.1007/s11629-019-5734-y . S2CID 215725140 . Архивировано из оригинала 17 мая 2022 года . Проверено 21 мая 2022 г.
- ^ Зинке, Лаура (28 апреля 2021 г.). «Ураганы и оползни» . Обзоры природы Земля и окружающая среда . 2 (5): 304. Бибкод : 2021NRvEE...2..304Z . дои : 10.1038/s43017-021-00171-x . S2CID 233435990 . Архивировано из оригинала 17 мая 2022 года . Проверено 21 мая 2022 г.
- ^ Тьен, Фам Ван; Луонг, Ле Хонг; Дюк, До Минь; Трин, Фан Чонг; Куинь, Динь Тхи; Лан, Нгуен Чау; Туй, Данг Тхи; Пхи, Нгуен Куок; Куонг, Чан Куок; Данг, Кханг; Лой, Доан Хай (9 апреля 2021 г.). «Катастрофический оползень, вызванный ливнями, в провинции Куангчи: самый смертоносный оползень во Вьетнаме в 2020 году» . Оползни . 18 (6). Спрингер: 2323–2327. Бибкод : 2021Земли..18.2323В . дои : 10.1007/s10346-021-01664-y . S2CID 233187785 . Архивировано из оригинала 17 мая 2022 года . Проверено 21 мая 2022 г.
- ^ Сантос, Джемма Дела Крус (20 сентября 2021 г.). «Тропические циклоны 2020 года на Филиппинах: обзор» . Исследование и обзор тропических циклонов . 10 (3): 191–199. Бибкод : 2021TCRR...10..191S . дои : 10.1016/j.tcrr.2021.09.003 . S2CID 239244161 .
- ^ Мишра, Маноранджан; Кар, Дипика; Дебнатх, Манаси; Саху, Нетрананда; Госвами, Шрируп (30 августа 2021 г.). «Быстрая эколого-физическая оценка воздействия тропических циклонов с использованием геопространственных технологий: случай сильных циклонических штормов Амфан» . Природные опасности . 110 (3). Спрингер: 2381–2395. дои : 10.1007/s11069-021-05008-w . S2CID 237358608 . Архивировано из оригинала 17 мая 2022 года . Проверено 21 мая 2022 г.
- ^ Тамура, Тору; Николас, Уильям А.; Оливер, Томас С.Н.; Брук, Брендан П. (14 июля 2017 г.). «Пляжные гряды с крупным песком в Коули-Бич, северо-восточная Австралия: процессы их формирования и потенциал как свидетельства истории тропических циклонов» . Седиментология . 65 (3). Библиотека Уайли: 721–744. дои : 10.1111/сед.12402 . S2CID 53403886 .
- ^ Перейти обратно: а б с Нотт, Джонатан (1 марта 2011 г.). «6000-летний рекорд тропического циклона в Западной Австралии» . Четвертичные научные обзоры . 30 (5): 713–722. Бибкод : 2011QSRv...30..713N . doi : 10.1016/j.quascirev.2010.12.004 . ISSN 0277-3791 . Архивировано из оригинала 21 декабря 2020 года . Проверено 13 марта 2021 г.
- ^ Мюллер, Джоанн; Коллинз, Дженнифер М.; Гибсон, Саманта; Пакстон, Лейлани (2017), Коллинз, Дженнифер М.; Уолш, Кевин (ред.), «Последние достижения в новой области палеотемпестологии», Ураганы и изменение климата: Том 3 , Чам: Springer International Publishing, стр. 1–33, номер документа : 10.1007/978-3-319-47594 -3_1 , ISBN 978-3-319-47594-3 , S2CID 133456333
- ^ Лю, Кам-биу (1999). Изменчивость в тысячелетнем масштабе катастрофических ураганов, выходящих на берег вдоль побережья Мексиканского залива . 23-я конференция по ураганам и тропической метеорологии. Даллас, Техас: Американское метеорологическое общество. стр. 374–377.
- ^ Лю, Кам-биу; Ферн, Мириам Л. (2000). «Реконструкция доисторических частот выхода на берег катастрофических ураганов на северо-западе Флориды по данным Lake Sediment Records». Четвертичные исследования . 54 (2): 238–245. Бибкод : 2000QuRes..54..238L . дои : 10.1006/qres.2000.2166 . S2CID 140723229 .
- ^ Г. Хуан; WWS Йим (январь 2001 г.). «Реконструкция 8000-летней записи тайфунов в устье Жемчужной реки, Китай» (PDF) . Университет Гонконга . Архивировано (PDF) из оригинала 20 июля 2021 г. Проверено 2 апреля 2021 г.
- ^ Арнольд Корт (1980). Воздействие тропического циклона на Калифорнию . Технический меморандум NOAA NWS WR; 159. Нортридж, Калифорния: Калифорнийский государственный университет. стр. 2, 4, 6, 8, 34. Архивировано из оригинала 1 октября 2018 года . Проверено 2 февраля 2012 г.
- ^ «Лучший трек урагана в Атлантике (HURDAT версия 2)» (База данных). США Национальный центр ураганов . 5 апреля 2023 г. . Проверено 4 августа 2024 г.
 В данную статью включен текст из этого источника, находящегося в свободном доступе .
 - ^ Филипп Карофф; и др. (июнь 2011 г.). Операционные процедуры спутникового анализа ТЦ в РСМЦ Ла Реюньон (Отчет). Всемирная метеорологическая организация. Архивировано из оригинала 27 апреля 2021 года . Проверено 22 апреля 2013 г.
- ^ Кристофер В. Ландси; и др. «Документация по изменениям и дополнениям к базе данных HURDAT за 1851–1910 годы» . Проект повторного анализа базы данных об ураганах в Атлантике. Отдел исследования ураганов. Архивировано из оригинала 15 июня 2021 года . Проверено 27 апреля 2021 г.
- ^ Нойманн, Чарльз Дж. «1.3: Глобальная климатология» . Глобальное руководство по прогнозированию тропических циклонов . Бюро метеорологии . Архивировано из оригинала 1 июня 2011 года . Проверено 30 ноября 2006 г.
- ^ Натсон, Томас; Камарго, Сюзана; Чан, Джонни; Эмануэль, Керри; Хо, Чанг-Хой; Коссин, Джеймс; Мохапатра, Мрутюнджай; Сато, Масаки; Суги, Масато; Уолш, Кевин; У, Лигуан (1 октября 2019 г.). «ТРОПИЧЕСКИЕ ЦИКЛОНЫ И ОЦЕНКА ИЗМЕНЕНИЯ КЛИМАТА. Часть I: Обнаружение и атрибуция» . Американское метеорологическое общество . 100 (10): 1988. Бибкод : 2019BAMS..100.1987K . дои : 10.1175/BAMS-D-18-0189.1 . hdl : 1721.1/125577 . S2CID 191139413 . Архивировано из оригинала 13 августа 2021 года . Проверено 17 апреля 2021 г.
- ^ Перейти обратно: а б с д и Атлантическая океанографическая и метеорологическая лаборатория , Отдел исследования ураганов. «Часто задаваемые вопросы: Когда сезон ураганов?» . Национальное управление океанических и атмосферных исследований . Архивировано из оригинала 6 мая 2009 года . Проверено 25 июля 2006 г.
- ^ МакЭди, Колин (10 мая 2007 г.). «Климатология тропических циклонов» . Национальный центр ураганов. Архивировано из оригинала 21 марта 2015 года . Проверено 9 июня 2007 г.
- ^ Перейти обратно: а б Рамзи, Хэмиш (2017). «Глобальная климатология тропических циклонов» . Оксфордская исследовательская энциклопедия наук о природных опасностях . Издательство Оксфордского университета. doi : 10.1093/acrefore/9780199389407.013.79 . ISBN 9780199389407 . Архивировано из оригинала 15 августа 2021 года.
- ^ Объединенный центр предупреждения о тайфунах (2006 г.). «3.3 Философия прогнозирования JTWC» (PDF) . ВМС США . Архивировано (PDF) из оригинала 29 ноября 2007 г. Проверено 11 февраля 2007 г.
- ^ Перейти обратно: а б Ву, MC; Чанг, WL; Люнг, WM (2004). «Влияние явлений Эль-Ниньо – Южного колебания на активность выхода тропических циклонов на берег в западной части северной части Тихого океана». Журнал климата . 17 (6): 1419–1428. Бибкод : 2004JCli...17.1419W . CiteSeerX 10.1.1.461.2391 . doi : 10.1175/1520-0442(2004)017<1419:IOENOE>2.0.CO;2 .
- ^ Клоцбах, Филип Дж. (2011). «Влияние Эль-Ниньо – Южного колебания на ураганы в Атлантическом бассейне и выходы на берег в США» . Журнал климата . 24 (4): 1252–1263. Бибкод : 2011JCli...24.1252K . дои : 10.1175/2010JCLI3799.1 . ISSN 0894-8755 .
- ^ Камарго, Сюзана Дж.; Собел, Адам Х.; Барнстон, Энтони Г.; Клоцбах, Филип Дж. (2010), «Влияние естественной изменчивости климата на тропические циклоны и сезонные прогнозы активности тропических циклонов» , Глобальные перспективы тропических циклонов , Всемирная научная серия по погоде и климату в Азиатско-Тихоокеанском регионе, том. 4, WORLD SCIENTIFIC, стр. 325–360, doi : 10.1142/9789814293488_0011 , ISBN. 978-981-4293-47-1 , заархивировано из оригинала 15 августа 2021 г.
- ^ Перейти обратно: а б с д Отдел исследования ураганов. «Часто задаваемые вопросы: какое среднее, наибольшее и наименьшее количество тропических циклонов происходит в каждом бассейне?» . Атлантическая океанографическая и метеорологическая лаборатория Национального управления океанических и атмосферных исследований . Проверено 5 декабря 2012 г.
- ^ «Отчет о циклонических возмущениях над северной частью Индийского океана в 2018 году» (PDF) . Архивировано из оригинала (PDF) 11 мая 2020 г.
- ^ «Прогноз тропических циклонов Австралии на 2019–2020 годы» . Австралийское бюро метеорологии. 11 октября 2019 года. Архивировано из оригинала 14 октября 2019 года . Проверено 14 октября 2019 г.
- ^ Прогноз сезона тропических циклонов на 2019–2020 гг. [в] Зона ответственности Регионального специализированного метеорологического центра Нади – Центра тропических циклонов (РСМЦ Нанди – ТСС) (ЗО) (PDF) (Отчет). Метеорологическая служба Фиджи. 11 октября 2019 г. Архивировано (PDF) из оригинала 11 октября 2019 г. . Проверено 11 октября 2019 г.
- ^ Леонхардт, Дэвид; Моисей, Клэр; Филбрик, Ян Прасад (29 сентября 2022 г.). «Иэн движется на север / Ураганы 4 и 5 категорий в Атлантике с 1980 года» . Нью-Йорк Таймс . Архивировано из оригинала 30 сентября 2022 года.
Источник: NOAA — графика Эшли Ву, The New York Times
( цитаты за 2022 год — данные ). - ^ Аджаса, Амудалат; Клемент, Скотт; Гаскин, Эмили (23 августа 2023 г.). «Партизаны по-прежнему расходятся во мнениях по поводу изменения климата, способствующего увеличению числа бедствий, и по поводу того, что погода становится все более суровой» . Вашингтон Пост . Архивировано из оригинала 23 августа 2023 года.
- ^ «За последние 40 лет вероятность возникновения крупных тропических циклонов стала на 15% выше» . Карбоновое резюме . 18 мая 2020 года. Архивировано из оригинала 8 августа 2020 года . Проверено 31 августа 2020 г.
- ^ Коссин, Джеймс П.; Кнапп, Кеннет Р.; Оландер, Тимоти Л.; Вельден, Кристофер С. (18 мая 2020 г.). «Глобальное увеличение вероятности превышения крупных тропических циклонов за последние четыре десятилетия» (PDF) . Труды Национальной академии наук . 117 (22): 11975–11980. Бибкод : 2020PNAS..11711975K . дои : 10.1073/pnas.1920849117 . ISSN 0027-8424 . ПМЦ 7275711 . ПМИД 32424081 . Архивировано (PDF) из оригинала 19 ноября 2020 г. Проверено 6 октября 2020 г.
- ^ Коллинз, М.; Сазерленд, М.; Бауэр, Л.; Чеонг, С.-М.; и др. (2019). «Глава 6: Крайности, резкие изменения и управление рисками» (PDF) . Специальный доклад МГЭИК об океане и криосфере в условиях меняющегося климата . п. 602. Архивировано (PDF) из оригинала 20 декабря 2019 года . Проверено 6 октября 2020 г.
- ^ Томас Р. Кнутсон; Джозеф Дж. Сирутис; Мин Чжао (2015). «Глобальные прогнозы интенсивной активности тропических циклонов на конец XXI века на основе динамического даунскейлинга сценариев CMIP5/RCP4.5» . Журнал климата . 28 (18): 7203–7224. Бибкод : 2015JCli...28.7203K . дои : 10.1175/JCLI-D-15-0129.1 . S2CID 129209836 . Архивировано из оригинала 5 января 2020 года . Проверено 6 октября 2020 г.
- ^ Кнутсон; и др. (2013). «Прогнозы динамического даунскейлинга активности ураганов в Атлантике в конце XXI века: сценарии, основанные на моделях CMIP3 и CMIP5» . Журнал климата . 26 (17): 6591–6617. Бибкод : 2013JCli...26.6591K . дои : 10.1175/JCLI-D-12-00539.1 . S2CID 129571840 . Архивировано из оригинала 5 октября 2020 года . Проверено 6 октября 2020 г.
- ^ Перейти обратно: а б Коллинз, М.; Сазерленд, М.; Бауэр, Л.; Чеонг, С.-М.; и др. (2019). «Глава 6: Крайности, резкие изменения и управление рисками» (PDF) . Специальный доклад МГЭИК об океане и криосфере в условиях меняющегося климата . п. 603. Архивировано (PDF) из оригинала 20 декабря 2019 г. . Проверено 6 октября 2020 г.
- ^ Перейти обратно: а б «Ураган Харви показывает, как мы недооцениваем риски наводнений в прибрежных городах, — говорят ученые» . Вашингтон Пост . 29 августа 2017 года. Архивировано из оригинала 30 августа 2017 года . Проверено 30 августа 2017 г.
- ^ Перейти обратно: а б с Уолш, KJE; Камарго, С.Дж.; Кнутсон, Т.Р.; Коссин Дж.; Ли, Т.-К.; Мураками, Х.; Патрикола, К. (1 декабря 2019 г.). «Тропические циклоны и изменение климата» . Исследование и обзор тропических циклонов . 8 (4): 240–250. Бибкод : 2019TCRR....8..240Вт . дои : 10.1016/j.tcrr.2020.01.004 . hdl : 11343/192963 . ISSN 2225-6032 .
- ^ Робертс, Малкольм Джон; Кэмп, Джоан; Седдон, Джон; Видале, Пьер Луиджи; Ходжес, Кевин; Ваньер, Бенуа; Мекинг, Дженни; Хаарсма, Рейн; Беллуччи, Алессио; Скоччимарро, Энрико; Карон, Луи-Филипп (2020). «Прогнозируемые будущие изменения тропических циклонов с использованием мультимодельного ансамбля CMIP6 HighResMIP» . Письма о геофизических исследованиях . 47 (14): e2020GL088662. Бибкод : 2020GeoRL..4788662R . дои : 10.1029/2020GL088662 . ISSN 1944-8007 . ПМЦ 7507130 . ПМИД 32999514 . S2CID 221972087 .
- ^ «Ураганы и изменение климата» . Союз неравнодушных ученых . Архивировано из оригинала 24 сентября 2019 года . Проверено 29 сентября 2019 г.
- ^ Мураками, Хироюки; Делворт, Томас Л.; Кук, Уильям Ф.; Чжао, Мин; Сян, Баоцян; Сюй, Пан-Чи (2020). «Обнаружено климатическое изменение в глобальном распространении тропических циклонов» . Труды Национальной академии наук . 117 (20): 10706–10714. Бибкод : 2020PNAS..11710706M . дои : 10.1073/pnas.1922500117 . ISSN 0027-8424 . ПМК 7245084 . ПМИД 32366651 .
- ^ Джеймс П. Коссин; Керри А. Эмануэль; Габриэль А. Векки (2014). «Миграция к полюсу места максимальной интенсивности тропического циклона». Природа . 509 (7500): 349–352. Бибкод : 2014Natur.509..349K . дои : 10.1038/nature13278 . hdl : 1721.1/91576 . ПМИД 24828193 . S2CID 4463311 .
- ^ Стадхолм, Джошуа; Федоров Алексей Владимирович; Гулев Сергей К.; Эмануэль, Керри; Ходжес, Кевин (29 декабря 2021 г.). «Расширение широт тропических циклонов к полюсу в условиях потепления климата» . Природа Геонауки . 15 :14–28. дои : 10.1038/s41561-021-00859-1 . S2CID 245540084 . Архивировано из оригинала 4 января 2022 года . Проверено 4 января 2022 г.
- ^ Программа мониторинга побережья Флориды. «Обзор проекта» . Университет Флориды . Архивировано из оригинала 3 мая 2006 года . Проверено 30 марта 2006 г.
- ^ «Наблюдения» . Центрально-Тихоокеанский центр ураганов. 9 декабря 2006. Архивировано из оригинала 12 февраля 2012 года . Проверено 7 мая 2009 г.
- ^ «НОАА использует возможности новых спутниковых данных в этот сезон ураганов» . Национальное управление океанических и атмосферных исследований . 1 июня 2020 года. Архивировано из оригинала 18 марта 2021 года . Проверено 25 марта 2021 г.
- ^ «Охотники за ураганами (домашняя страница)» . Ассоциация охотников за ураганами. Архивировано из оригинала 30 мая 2012 года . Проверено 30 марта 2006 г.
- ^ Ли, Кристофер. «Дрон, датчики могут открыть путь в глаз бури» . Вашингтон Пост . Архивировано из оригинала 11 ноября 2012 года . Проверено 22 февраля 2008 г.
- ^ Национальный центр ураганов (22 мая 2006 г.). «Среднегодовые ошибки отслеживания моделей тропических циклонов Атлантического бассейна за период 1994–2005 годов для однородного отбора «ранних» моделей» . Проверка прогноза Национального центра ураганов . Национальное управление океанических и атмосферных исследований . Архивировано из оригинала 10 мая 2012 года . Проверено 30 ноября 2006 г.
- ^ Национальный центр ураганов (22 мая 2006 г.). «Среднегодовые официальные ошибки отслеживания тропических циклонов Атлантического бассейна за период 1989–2005 годов с наложением линий тренда наименьших квадратов» . Проверка прогноза Национального центра ураганов . Национальное управление океанических и атмосферных исследований . Архивировано из оригинала 10 мая 2012 года . Проверено 30 ноября 2006 г.
- ^ «Региональный специализированный метеорологический центр» . Программа тропических циклонов (TCP) . Всемирная метеорологическая организация . 25 апреля 2006. Архивировано из оригинала 14 августа 2010 года . Проверено 5 ноября 2006 г.
- ^ Метеорологическая служба Фиджи (2017 г.). "Услуги" . Архивировано из оригинала 18 июня 2017 года . Проверено 4 июня 2017 г.
- ^ Объединенный центр предупреждения о тайфунах (2017 г.). «Уведомление о продуктах и услугах» . ВМС США. Архивировано из оригинала 9 июня 2017 года . Проверено 4 июня 2017 г.
- ^ Национальный центр ураганов (март 2016 г.). «Документ с описанием продукта Национального центра ураганов: Руководство пользователя по продуктам для ураганов» (PDF) . Национальное управление океанических и атмосферных исследований. Архивировано (PDF) из оригинала 17 июня 2017 г. Проверено 3 июня 2017 г.
- ^ «Примечания к информации РСМЦ о тропических циклонах» . Японское метеорологическое агентство. 2017. Архивировано из оригинала 19 марта 2017 года . Проверено 4 июня 2017 г.
- ^ «Геопотенциальная высота» . Национальная метеорологическая служба. Архивировано из оригинала 24 марта 2022 года . Проверено 7 октября 2022 г.
- ^ «Графики постоянного давления: 850 мб» . Национальная метеорологическая служба. Архивировано из оригинала 4 мая 2022 года . Проверено 7 октября 2022 г.
- ^ «Графики постоянного давления: 700 мб» . Национальная метеорологическая служба. Архивировано из оригинала 29 июня 2022 года . Проверено 7 октября 2022 г.
- ^ «Графики постоянного давления: 500 мб» . Национальная метеорологическая служба. Архивировано из оригинала 21 мая 2022 года . Проверено 7 октября 2022 г.
- ^ «Графики постоянного давления: 300 мб» . Национальная метеорологическая служба. Архивировано из оригинала 7 октября 2022 года . Проверено 7 октября 2022 г.
- ^ «Графики постоянного давления: 200 мб» . Национальная метеорологическая служба. Архивировано из оригинала 5 августа 2022 года . Проверено 7 октября 2022 г.
- ^ «Цифровой инструментарий для обеспечения сезонной готовности к ураганам» . Готово.gov. 18 февраля 2021 года. Архивировано из оригинала 21 марта 2021 года . Проверено 6 апреля 2021 г.
- ^ Грей, Брайони; Уил, Марк; Мартин, Дэвид (2019). «Роль социальных сетей в сообществах малых островов: уроки сезона ураганов в Атлантике 2017 года». Материалы 52-й Гавайской международной конференции по системным наукам . 52-я Гавайская международная конференция по системным наукам. Гавайский университет. дои : 10.24251/HICSS.2019.338 . hdl : 10125/59718 . ISBN 978-0-9981331-2-6 .
- ^ Моррисси, Ширли А.; Резер, Джозеф П. (1 мая 2003 г.). «Оценка эффективности рекомендаций по психологической готовности в материалах по подготовке населения к циклонам» . Австралийский журнал по управлению чрезвычайными ситуациями . 18 (2): 46–61. Архивировано из оригинала 23 мая 2022 года . Проверено 6 апреля 2021 г.
- ^ «Тропические циклоны» . Всемирная метеорологическая организация. 8 апреля 2020 года. Архивировано из оригинала 18 декабря 2023 года . Проверено 6 апреля 2021 г.
- ^ «Метеорологическая служба Фиджи» . Министерство инфраструктуры и метеорологических служб . Министерство инфраструктуры и транспорта. Архивировано из оригинала 14 августа 2021 года . Проверено 6 апреля 2021 г.
- ^ «О Национальном центре ураганов» . Майами, Флорида: Национальный центр ураганов. Архивировано из оригинала 12 октября 2020 года . Проверено 6 апреля 2021 г.
- ^ Региональная ассоциация IV – Оперативный план борьбы с ураганами для Северной Америки, Центральной Америки и Карибского бассейна . Всемирная метеорологическая организация. 2017. ISBN 9789263111630 . Архивировано из оригинала 14 ноября 2020 года . Проверено 6 апреля 2021 г.
- ^ «Национальный центр ураганов – «Будь готов» » . Проверено 9 ноября 2023 г.
- ^ Национальная океаническая служба (7 сентября 2016 г.). "Следуй за этим ураганом!" (PDF) . Национальное управление океанических и атмосферных исследований . Проверено 2 июня 2017 г.
- ^ «Матрица подверженности опасностям и оценке рисков OSHA для работ по реагированию на ураган и восстановлению: список листов действий» . США Управление по охране труда . 2005. Архивировано из оригинала 29 сентября 2018 года . Проверено 25 сентября 2018 г.
- ^ «Прежде чем начать — Система управления инцидентами (ICS)» . Американская ассоциация промышленной гигиены . Архивировано из оригинала 29 сентября 2018 года . Проверено 26 сентября 2018 г.
- ^ «Волонтер» . Национальные добровольные организации, действующие в условиях стихийных бедствий . Архивировано из оригинала 29 сентября 2018 года . Проверено 25 сентября 2018 г.
- ^ Перейти обратно: а б с «Основные сообщения об урагане для работодателей, работников и волонтеров» . США Национальный институт охраны труда . 2017. Архивировано из оригинала 24 ноября 2018 года . Проверено 24 сентября 2018 г.
- ^ Перейти обратно: а б «Опасные материалы и условия» . Американская ассоциация промышленной гигиены . Архивировано из оригинала 29 сентября 2018 года . Проверено 26 сентября 2018 г.
- ^ «Плесень и другие микроорганизмы» . Американская ассоциация промышленной гигиены . Архивировано из оригинала 29 сентября 2018 года . Проверено 26 сентября 2018 г.
- ^ Перейти обратно: а б с «Матрица подверженности опасностям и оценке рисков OSHA для работ по реагированию на ураган и восстановлению: рекомендации в отношении общих опасностей, обычно встречающихся во время операций по реагированию на ураган и восстановлению» . Управление по охране труда США . 2005. Архивировано из оригинала 29 сентября 2018 года . Проверено 25 сентября 2018 г.
- ^ «Электрическая опасность» . Американская ассоциация промышленной гигиены . Архивировано из оригинала 29 сентября 2018 года . Проверено 26 сентября 2018 г.
Внешние ссылки
- Национальный центр ураганов США – Северная Атлантика, Восточная часть Тихого океана
- Центр ураганов в Центральной части Тихого океана США - Центральная часть Тихого океана
- Японское метеорологическое агентство – Западная часть Тихого океана
- Метеорологический департамент Индии – Индийский океан
- Метео-Франс – Реюньон – южная часть Индийского океана от 30° до 90° в.д.
- Индонезийский метеорологический департамент - южная часть Индийского океана от 90 ° до 125 ° в.д., к северу от 10 ° ю.ш.
- Австралийское метеорологическое бюро - южная часть Индийского океана и южная часть Тихого океана от 90 ° до 160 ° в.д.
- Национальная метеорологическая служба Папуа-Новой Гвинеи - южная часть Тихого океана к востоку от 160 ° в.д., к северу от 10 ° ю.ш.
- Метеорологическая служба Фиджи - южная часть Тихого океана к западу от 160 ° восточной долготы, к северу от 25 ° южной широты.
- MetService Новой Зеландии - южная часть Тихого океана к западу от 160 ° в.д., к югу от 25 ° ю.ш.

Элементы природы |
|---|