Jump to content

Всемирный доклад о счастье

Уровень счастья во всем мире по данным Доклада о мировом счастье (2023 г.).

World Happiness Report — это публикация, содержащая статьи и рейтинги национального счастья , основанные на оценках респондентами своей собственной жизни. [1] что в отчете также коррелирует с различными факторами (качества) жизни . [2] В отчете в основном используются данные опроса Gallup World Poll . По состоянию на март 2024 года Финляндия семь раз подряд была признана самой счастливой страной в мире. [3] [4] [5] [6] [7]

С 2024 года отчет публикуется в рамках партнерства между Gallup , Центром исследований благополучия и Оксфордского университета Сетью ООН решений в области устойчивого развития . [8] В состав редакционной группы входят три редактора-основателя: Джон Ф. Хелливелл , Ричард Лейард и Джеффри Д. Сакс , а также редакторы Ян-Эммануэль Де Неве , Лара Акнин и Шун Ван. [9]

В июле 2011 года Генеральная Ассамблея ООН приняла резолюцию 65/309 « Счастье: на пути к целостному определению развития». [10] приглашая страны-члены измерять счастье своего народа и использовать данные для определения государственной политики.

Первый «Доклад о мировом счастье» был опубликован 1 апреля 2012 года и стал основополагающим текстом для совещания высокого уровня ООН: «Благосостояние и счастье: определение новой экономической парадигмы» . [11] привлечение международного внимания. [12] 2 апреля 2012 года за этим последовала первая встреча ООН на высоком уровне под названием « Благосостояние и счастье: определение новой экономической парадигмы» . [13] под председательством генерального секретаря ООН Пан Ги Муна и премьер-министра Джигми Тинли из Бутана , страны, которая приняла валовое национальное счастье вместо валового внутреннего продукта в качестве основного показателя развития. [14]

В первом докладе излагалось состояние счастья в мире, причины счастья и несчастья, а также последствия для политики, выявленные в тематических исследованиях. В 2013 году вышел второй «Доклад о мировом счастье», а в 2015 году — третий. С 2016 года он выпускается ежегодно 20 марта, приуроченный к Международному дню счастья ООН. [15]

Методы и философия

[ редактировать ]

Рейтинги национального счастья основаны на опросе по измерению счастья, проведенном по всему миру опросной компанией Gallup, Inc. Репрезентативную на национальном уровне выборку респондентов просят придумать лестницу, где лучшая возможная жизнь для них равна 10, а худшая возможная жизнь — 0. Затем их просят оценить свою текущую жизнь по этой шкале от 0 до 10. [16] В отчете результаты оценки жизни соотносятся с различными жизненными факторами. [2]

Переменные факторов жизни, используемые в отчетах, отражают детерминанты, которые объясняют различия в оценках жизни на национальном уровне в исследовательской литературе. Однако некоторые переменные, такие как безработица или неравенство, не учитываются, поскольку сопоставимые данные еще не доступны по всем странам. Используемые переменные иллюстрируют важные корреляции, а не причинно-следственные оценки. [16]

Использование субъективных измерений благополучия представляет собой восходящий подход, который дает респондентам возможность оценивать свое собственное благополучие. [17] В этом контексте ценность лестницы Кантрила заключается в том, что респондент может закрепить себя на основе своей точки зрения. [18]

В отчетах эксперты в таких областях, как экономика , психология , анализ опросов и национальная статистика , описывают, как измерения благосостояния могут эффективно использоваться для оценки прогресса стран, а также по другим темам. Каждый отчет состоит из глав, в которых более глубоко рассматриваются вопросы, связанные со счастьем , включая психические заболевания, объективные преимущества счастья, важность этики, политические последствия и связи с подходом Организации экономического сотрудничества и развития (ОЭСР) к проблеме счастья. измерение субъективного благополучия и другие международные и национальные усилия.

С 2021 года в Докладе о мировом счастье предлагается использовать WELLBY (годы жизни с поправкой на благополучие); он утверждает, что QALY учитывает только качество жизни отдельного пациента, связанное со здоровьем, и вместо этого следует использовать WELLBY. Политики должны стремиться максимизировать WELLBY всех рожденных, а также учитывать WELLBY будущих поколений (при условии небольшой дисконтной ставки). [19] [20] [21]

Счастье молодых и старых

[ редактировать ]

Рейтинги стран для молодых и пожилых людей существенно различаются, причем систематически, что подчеркивает тот факт, что сближение двух половин Европы было обусловлено главным образом растущим уровнем счастья молодежи. Страны с самым высоким рейтингом для пожилых людей, как правило, имеют высокий общий рейтинг, но есть и несколько стран, в которых молодые в последнее время чувствуют себя очень плохо. [22]

Рейтинг стран для людей младше 30 лет
Overall rankCountry or regionLife evaluation
1 Lithuania7.795
2 Israel7.667
3 Iceland7.658
4 Serbia7.658
5 Denmark7.598
6 Luxembourg7.301
7 Finland7.319
8 Romania7.302
9 Netherlands7.122
10 Czechia7.060
11 Costa Rica7.057
12 Austria7.029
14  Switzerland6.955
15 Croatia6.951
16 Slovenia6.905
17 Kuwait6.900
18 El Salvador6.894
19 Sweden6.838
20 Australia6.822
21 Norway6.818
22 Ireland6.749
23 Mexico6.743
24 Kosovo6.733
25 Belgium6.725
26 Taiwan6.719
27 Panama6.678
28 New Zealand6.611
29 Nicaragua6.609
30 Moldova6.594
31 Uruguay6.561
32 Latvia6.523
33 United Kingdom6.503
34 Bosnia and Herzegovina6.491
35 Argentina6.469
36 United Arab Emirates6.448
37 Hungary6.442
38 Paraguay6.421
39 Slovakia6.411
40 Chile6.360
41 Bulgaria6.358
42 Italy6.346
43 Saudi Arabia6.324
44 Poland6.287
45 Estonia6.284
46 Thailand6.272
47 Portugal6.257
48 Germany6.234
49 France6.195
50 Guatemala6.188
51 Montenegro6.188
52 Cyprus6.068
53 South Korea6.060
54 Greece6.058
55 Singapore6.048
56 Spain6.043
57 Honduras6.030
58 Malta6.017
59 Canada5.977
60 Ecuador5.976
61 Brazil5.975
62 Dominican Republic5.973
63 United States5.968
64 Peru5.959
65 Malaysia5.942
66 Vietnam5.934
67 Albania5.877
68 North Macedonia5.866
69 Russia5.842
70 Kazakhstan5.841
71 Philippines5.823
72 Uzbekistan5.816
73 Armenia5.816
74 Japan5.785
75 Bolivia5.784
76 Indonesia5.725
77 Colombia5.714
78 Bahrain5.707
79 Georgia5.696
80 China5.695
81 Libya5.607
82 Kyrgyzstan5.568
83 Ukraine5.463
84 Venezuela5.455
85 Jamaica5.422
86 Mauritius5.369
87 Mongolia5.364
88 South Africa5.316
89 Congo5.304
90 Tajikistan5.281
91 Congo (Brazzaville)5.221
92 Iraq5.216
93 Gabon5.185
94   Nepal5.166
95 Algeria5.158
96 Laos5.139
97 Gabon5.106
98 Mozambique5.080
99 Azerbaijan5.023
100 Iran4.975
101 Hong Kong4.969
102 Morocco4.923
103 Senegal4.893
104 Ivory Coast4.881
105 Turkey4.879
106 Palestine4.874
107 Guinea4.873
108 Laos4.832
109 Namibia4.795
110 Cameroon4.657
111 Pakistan4.556
112 Nigeria4.548
113 Kenya4.505
114 Gambia4.485
115 Uganda4.471
116 Cambodia4.470
117 Liberia4.422
118 Jordan4.377
119 Benin4.372
120 Niger4.354
121 Burkina Faso4.341
122 Tunisia4.289
123 Mauritania4.269
124 Chad4.232
125 Myanmar4.228
126 Sri Lanka4.214
127 Madagascar4.186
128 Mali4.054
129 Togo3.977
130 India3.898
131 Bangladesh3.886
132 Tanzania3.861
133 Egypt3.781
134 Ethiopia3.566
135 Comoros3.561
136 Botswana3.502
137 Yemen3.502
138 Zambia3.421
139 Malawi3.383
140 Lesotho3.341
141 Zimbabwe3.295
142 Congo3.245
143 Sierra Leone3.186
144 Lebanon2.707
145 Afghanistan1.721

Темы годового отчета

[ редактировать ]

Доклад о мировом счастье публикуется ежегодно с 2012 года (кроме 2014 года).

Помимо ранжирования стран по уровню счастья и благосостояния, в каждом отчете есть авторы, и большинство из них посвящены определенной теме. Данные, используемые для ранжирования стран в каждом отчете, взяты из опроса Gallup World Poll. [23] а также другие источники, такие как World Values ​​Survey , в некоторых отчетах. Анкета Gallup World Poll [24] измеряет 14 областей в рамках своих основных вопросов: (1) бизнес и экономика, (2) вовлечение граждан, (3) коммуникации и технологии, (4) разнообразие (социальные вопросы), (5) образование и семьи, (6) эмоции (хорошо -бытие), (7) окружающая среда и энергия, (8) еда и жилье, (9) правительство и политика, (10) закон и порядок (безопасность), (11) здоровье, (12) религия и этика, (13) транспорт и (14) работа.

Доклад о мировом счастье 2024 года

[ редактировать ]
Описания

The 2024 World Happiness Report focused on happiness at different stages of life. Chapter 3 presents global data on child and adolescent wellbeing, whereas Chapters 4 and 5 focus on older age, covering the links between wellbeing and dementia and a deep dive into the wellbeing of older people in India.[25]

Доклад о мировом счастье 2023 года

[ редактировать ]
Описания

The 2023 World Happiness Report was a triannual analysis of 2020–2022, heavily influenced by COVID-19 and other significant challenges.[26]

For the sixth consecutive year, Finland was ranked on top, followed by Denmark, Iceland, Israel and the Netherlands. In the top-10 rankings, Israel jumped five places, while Switzerland fell four places. Lithuania was the only new country in the top-20.[27]

Доклад о мировом счастье 2022 года

[ редактировать ]
Описания

The 2022 World Happiness Report included a section looking at possible genetic effects on individual happiness.[28]

Finland is in the top position in the world happiness report in 2022. Followed by Denmark and Iceland in second and third place. Switzerland, Netherlands, Luxembourg, Sweden, Norway, Israel and New Zealand, were among the top 10 'happiest' countries in the world Happiness, Benevolence, and Trust During COVID-19 and Beyond.

Among 146 countries ranked by the report, Afghanistan scores the lowest point of 2.523 and was ranked as the least 'happy' country in the world in 2022.

Всемирный доклад о счастье за ​​2021 год

[ редактировать ]
Описания

The 2021 World Happiness Report, released on March 20, 2021, ranks 156 countries based on an average of three years of surveys between 2017 and 2019. The 2020 report especially focuses on the environment – social, urban, and natural, and includes links between happiness and sustainable development.[29]

Finland holds the rank of the happiest country in the world for the fourth consecutive year.[30] It is followed by Denmark, Switzerland, Iceland and Netherlands. Afghanistan received the lowest score, with South Sudan and Rwanda just above it. In addition to country rankings, this is the second year that the World Happiness Report ranks cities. The happiest city in the world is Helsinki, the capital of Finland. The report shows that the happiness ranking of cities is almost identical to that of the countries they are in.

Всемирный доклад о счастье за ​​2020 год

[ редактировать ]
Описания

The 2020 World Happiness Report, released on March 20, 2020, ranks 156 countries based on an average of three years of surveys between 2017 and 2019. The 2020 report especially focuses on the environment – social, urban, and natural, and includes links between happiness and sustainable development.[31]

Finland holds the rank of the happiest country in the world for the third consecutive year.[32] It is followed by Denmark, Switzerland, Iceland and Norway. Afghanistan received the lowest score, with South Sudan and Zimbabwe just above it.[33] In addition to country rankings, this is the first year that the World Happiness Report ranks cities. The happiest city in the world is Helsinki, the capital of Finland. The report shows that the happiness ranking of cities is almost identical to that of the countries they are in.

In 2020, the editorial team expanded and Jan-Emmanuel De Neve became a co-editor, joining John F. Helliwell, Richard Layard, Jeffrey D. Sachs, and the Oxford Wellbeing Research Centre became a fourth research pillar for the report. Associate editors were Lara Aknin, Haifang Huang and Shun Wang, and Sharon Paculor was recognized as production editor. From 2020, Gallup became a full data partner.

Всемирный доклад о счастье 2019 года

[ редактировать ]
Описания

The 2019 World Happiness Report focuses community. According to the 2019 Happiness Report, Finland is the happiest country in the world,[34] with Denmark, Norway, Iceland, and The Netherlands holding the next top positions.

The second chapter of the report, 'Changing World Happiness', measures year-to-year changes in happiness across countries. For this, changes are reported from 2005-2008 to 2016-2018. Of the 132 countries with data for 2005-2008 and 2016-2018, 106 had significant changes: 64 were significant increases and 42 were significant decreases. Benin was the top gainer, while Venezuela showed the greatest decrease. The chapter also considers how happiness has been affected by changes in the quality of government. The third chapter considers happiness and voting behaviour, with data suggesting that happier people are more likely to vote, and to vote for incumbents.

The fourth chapter is an examination of happiness and pro-social behaviour, finding that people are more likely to derive happiness from helping others when they feel free to choose whether or how to help, when they feel connected to the people they are helping, and when they can see how their help is making a difference.

The final topic of the report, digital and information technologies and happiness, is covered in the remaining chapters.

The editorial team for the 2019 report was expanded to include Lara Aknin as associate editor.

Всемирный доклад о счастье 2018 года

[ редактировать ]
Описания

The 2018 iteration was released on 20 March and focused on the relation between happiness and migration.

Всемирный доклад о счастье 2017 года

[ редактировать ]
Описания

The fifth World Happiness Report emphasizes the importance of the social foundations of happiness, which are analysed by comparing the life experiences between the top and bottom ten countries in the year’s happiness rankings. Norway topped the global happiness rankings in this report, jumping from fourth place in 2016 to first in 2017. It was followed by Denmark, Iceland and Switzerland. The second chapter of the report focuses on the global rankings and calculates that bringing the social foundations from the lowest levels up to world average levels in 2014-2016 would increase life evaluations by almost two points. This means that social foundations effects are together larger than those of GDP per capita and healthy life expectancy.

The third chapter focuses on economic growth and wellbeing in China, and shows that unemployment and changes in the social safety nets explain both the post-1990 fall in happiness levels and the subsequent recovery since 2005. The fourth chapter discusses the reasons why countries in Africa are generally lagging behind others in life evaluations. The fifth chapter analyses key determinants of happiness, including income, mental health, and physical health. The sixth chapter considers the determinant of employment and work in particular, emphasising the importance of employment for happiness across the world. The final chapter uses happiness history over the past ten years, analysing the case of the United States through the lens of social foundations of happiness.

Всемирный доклад о счастье 2016 года

[ редактировать ]
Описания

The 2016 World Happiness Report -Rome Addition was issued in two parts as an update. Part one had four chapters: (1) Setting the Stage, (2) The Distribution of World Happiness, (3) Promoting Secular Ethics, and (4) Happiness and Sustainable Development: Concepts and Evidence. Part two has six chapters: (1) Inside the Life Satisfaction Blackbox, (2) Human Flourishing, the Common Good, and Catholic Social Teaching, (3) The Challenges of Public Happiness: An Historical-Methodological Reconstruction, (4) The Geography of Parenthood and Well-Being: Do Children Make Us Happy, Where and Why?, and (5) Multidimensional Well-Being in Contemporary Europe: An Analysis of the Use of a Self-Organizing Map Applied to Share Data.

Chapter 1, Setting the Stage is written by John F. Helliwell, Richard Layard, and Jeffrey Sachs. This chapter briefly surveys the happiness movement ("Increasingly, happiness is considered to be the proper measure of social progress and the goal of public policy.") gives an overview of the 2016 reports and synopsis of both parts of the 2016 Update Rome Addition.

Chapter 2, The Distribution of World Happiness is written by John F. Helliwell, Hailing Huang, and Shun Wang. This chapter reports happiness levels of countries and proposes the use of inequalities of happiness among individuals as a better measure for inequality than income inequality, and that all people in a population fare better in terms of happiness when there is less inequality in happiness in their region. It includes data from the World Health Organization and World Development Indicators, as well as Gallup World Poll. It debunks the notion that people rapidly adapt to changes in life circumstances and quickly return to an initial life satisfaction baseline, finding instead that changes in life circumstances such as government policies, major life events (unemployment, major disability) and immigration change people's baseline life satisfaction levels. This chapter also addresses the measure for affect (feelings), finding that positive affect (happiness, laughter, enjoyment) has much "large and highly significant impact" on life satisfaction than negative affect (worry, sadness, anger). The chapter also examines differences in happiness levels explained by the factors of (1) social support, (2) income, (3) healthy life, (4) trust in government and business, (5) perceived freedom to make life decisions and (6) generosity.

Chapter 3, Promoting Secular Ethics is written by Richard Layard, This chapter argues for a revival of an ethical life and world, harkening to times when religious organizations were a dominant force. It calls on secular non-profit organizations to promote "ethical living in a way that provides inspiration, uplift, joy and mutual respect", and gives examples of implementation by a non-profit founded by Richard Layard,[35] the chapter author, Action for Happiness, which offers online information from positive psychology and Buddhist teachings.

Chapter 4, Happiness and Sustainable Development: Concepts and Evidence is written by Jeffrey Sachs. This chapter identifies ways that sustainable development indicators (economic, social and environmental factors) can be used to explain variations in happiness. It concludes with a report about an appeal to include subjective well-being indicators into the UN Sustainable Development Goals (SDGs).

Part Two 2016 Special Rome Edition was edited by Jeffrey Sacks, Leonardo Becchetti and Anthony Arnett.

Chapter 1, Inside the Life Satisfaction Blackbox is written by Leonardo Becchetti, Luisa Carrado,[36] and Paolo Sama. This chapter proposes using quality of life measurements (a broader range of variables that life evaluation) in lieu of or in addition to overall life evaluations in future World Happiness Reports.

Chapter 2, Human Flourishing, the Common Good, and Catholic Social Teaching is written by Anthony Annett. This chapter contains explanations for three theories: (1) It is human nature to broadly define happiness and understand the connection between happiness and the common good, (2) that the current understanding of individuality is stripped of ties to the common good, and (3) that there is a need to restore the common good as central value for society. The chapter also proposes Catholic school teachings as a model for restoring the common good as a dominant value.

Chapter 3, The Challenges of Public Happiness: An Historical-Methodological Reconstruction is written by Luigino Bruni and Stefano Zemagni. This chapter contemplates Aristotelian concepts of happiness and virtue as they pertain to and support the findings in the World Happiness Reports regarding the impact of social support, trust in government, and equality of happiness.

Chapter 4, The Geography of Parenthood and Well-Being. Do Children Make Us Happy, Where and Why? is written by Luca Stanca.[37] This chapter examines other research findings that children do not add happiness to parents. Using data from the World Values Survey, it finds that, with the exception of widowed parents, having children has a negative effect on life satisfaction for parents in 2/3 of the 105 countries studied, with parents in richer countries suffering more. Once parents are old, life satisfaction increases. The chapter concludes that "existing evidence is not conclusive" and a statement that the causes for the low life satisfaction levels may be that for richer countries, having children is valued less, and in poorer countries, people suffer in financial and time costs when they have children.

Chapter 5, Multidimensional Well-Being in Contemporary Europe: Analysis of the Use of Self-Organizing Map Allied to SHARE Data is written by Mario Lucchini, Luca Crivelli[38] and Sara della Bella. This chapter contains a study of well-being data from older European adults. It finds that this chapter's study results were consistent with the World Happiness Report 2016 update: positive affect (feelings) have a stronger impact on a person's satisfaction with life than do negative affect (feelings).

Всемирный доклад о счастье 2015 года

[ редактировать ]
Описания

The 2015 World Happiness Report has eight chapters: (1) Setting the Stage, (2) The Geography of World Happiness, (3) How Does Subjective Well-being Vary Around the World by Gender and Age?, (4) How to Make Policy When Happiness is the Goal, (5) Neuroscience of Happiness, (6) Healthy Young Minds Transforming the Mental Health of Children, (7) Human Values, Civil Economy, and Subjective Well-being, and (8) Investing in Social Capital.

Chapter 1, Setting the Stage is written by John F. Helliwell, Richard Layard and Jeffrey Sachs. This chapter celebrates the success of the happiness movement ("Happiness is increasingly considered a proper means of social progress and public policy."), citing the OECD Guidelines on Measuring Subjective Well-being, a referendum in the EU requiring member nations to measure happiness, and the success of the World Happiness reports (with readership at about 1.5 million), and the adoption of happiness by the government of the United Arab Emirates, and other areas. It sets an aspiration of the inclusion of subjective well-being into the 2015 Sustainable Development Goals (not fulfilled), and outlines the 2015 report. It also address the use of the term Happiness, identifying the cons (narrowness of the term, breath of the term, flakiness), and defining the use of the term for the reasons that the 2011 UN General Assembly Resolution 65/309 Happiness Towards A Holistic Approach to Development[39] and April 2012 UN High Level Meeting: Well-being and Happiness: Defining a New Economic Paradigm,[40] Bhutan's Gross National Happiness[41] philosophy, the term's "convening and attention attracting power", and the asset in a "double usage of happiness" as an emotional report and life evaluation.

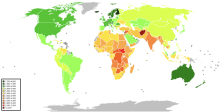
Chapter 2, The Geography of Happiness is written by John F. Helliwell, Hailing Huang and Shun Wang. This chapter reports the happiness of nations measured by life evaluations. It includes color coded maps and an analysis of six factors the account for the differences: (1) social support in terms of someone to count on in times of need, (2) GDP per capita (income), (3) life expectancy (in terms of healthy years), (4) sense of corruption in government and business (trust), (5) perceived freedom to make life decisions, and (6) generosity. The first three factors were found to have the biggest impact on a population's happiness. Crisis (natural disasters and economic crisis) the quality of governance, and social support were found to be the key drivers for changes in national happiness levels, with the happiness of nations undergoing a crisis in which people have a strong sense of social support falling less than nations where people do not have a strong sense of social support.

Chapter 3, How Does Subjective Well-being Vary Around the Globe by Gender and Age? is written by Nicole Fortin, John F. Helliwell and Shun Wang. This chapter uses data for 12 experiences: happiness (the emotion), smiling or laughing, enjoyment, feeling safe at night, feeling well rested, and feeling interested, as well as anger, worry, sadness, depression, stress and pain to examine differences by gender and age. Findings reported include that there is not a lot of difference in life evaluations between men and women across nations or within ages in a nation (women have slightly higher life evaluations than men: 0.09 on a ten-point scale). It reports that overall happiness falls into a U shape with age on the x axis and happiness on the y, with the low point being middle age (45-50) for most nations (in some happiness does not go up much in later life, so the shape is more of a downhill slide), and that the U shape holds for feeling well rested in all regions. It finds that men generally feel safer at night than women but, when comparing countries, people in Latin America have the lowest sense of safety at night, while people in East Asia and Western Europe have the highest sense of safety at night. It also finds that as women age their sense of happiness declines and stress increases but worry decreases, as all people age their laughter, enjoyment and finding something of interest also declines, that anger is felt everywhere almost equally by men and women, stress peaks in the Middle Ages, and women experience depression more than men. It finds that where older people are happier, there is a sense of social support, freedom to make life choices and generosity (and income does not factor in as heavily as these three factors).

Chapter 4, How to Make Policy When Happiness is the Goal is written by Richard Layard and Gus O'Donnell. This chapter advocates for a "new form of cost-benefit analysis" for government expenditures in which a "critical level of extra happiness" yielded by a project is established. It contemplates the prioritization of increasing happiness of the happy vs. reducing misery of the miserable, as well as the issues of discount rate (weight) for the happiness of future generations. It includes a technical annex with equations for calculating the maximization for happiness in public expenditure, tax policy, regulations, the distribution of happiness and a discount rate.

Chapter 5, Neuroscience of Happiness is written by Richard J. Dawson and Brianna S. Schuyler. This chapter reports on research in brain science and happiness, identifying four aspects that account for happiness: (1) sustained positive emotion, (2) recovery of negative emotion (resilience), (3) empathy, altruism and pro-social behavior, and (4) mindfulness (mind-wandering/affective sickness). It concludes that the brain's elasticity indicates that one can change one's sense of happiness and life satisfaction (separate but overlapping positive consequences) levels by experiencing and practicing mindfulness, kindness, and generosity; and calls for more research on these topics.

Chapter 6, Healthy Young Minds: Transforming the Mental Health of Children is written by Richard Layard and Ann Hagell.[42] This chapter identifies emotional development as of primary importance, (compared to academic and behavioral factors) in a child's development and determination of whether a child will be a happy and well-functioning adult. It then focuses on the issue of mental illness in children, citing the statistic that while worldwide 10% of the world's children (approximately 200 million) suffer from diagnosable mental health problems, even in the richest nations, only one quarter of these children of them are in treatment. It identifies the action steps to treating children with mental health problems: local community-lead child well-being programs, training health care professions to identify mental health problems in children, parity of esteem for mental and physical problems and treatment, access to evidence-based mental health treatment for families and children, promotion of well-being in schools with well-being codes that inform the organizational behavior of schools, training teachers to identify mental health in children, teachings of life skills, measuring of children's well-being by schools, development of free apps available internationally to treat mental illness in teens, and inclusion of mental health with the goal of physical health in the Sustainable Development goals. The chapter lists the benefits of treating children's mental health: improved educational performance, reduction in youth crimes, improved earnings and employment in adulthood, and better parenting of the next generation.

Chapter 7, Human Values, Civil Economy and Subjective Well-being is written by Leonardo Bechhetti,[43] Luigino Bruni and Stefano Zamagni. This chapter begins with a critique of the field of economics ("Economics today looks like physics before the discovery of electrons"), identifying reductionism in which humans are conceived of as 100% self-interested individuals (economic reductionism), profit maximization is prioritized over all other interests (corporate reductionism), and societal values are narrowly identified with GDP and ignore environmental, cultural, spiritual and relational aspects (value reductionism). The chapter them focuses on a theoretical approach termed "Civil Economy paradigm", and research about it demonstrating that going beyond reductionism leads to greater socialization for people and communities, and a rise in priority of the values of reciprocity, friendship, trustworthiness, and benevolence. It makes the argument that positive social relationships (trust, benevolence, shared social identities) yield happiness and positive economic outcomes. It ends with recommendations for move from the dominant model of elite-competitive democracy to a participatory/deliberative model of democracy with bottom-up political and economic participation and incentives for non-selfish actions (altruistic people) and corporations with wider goals than pure profit (ethical and environmentally responsible corporations).

Chapter 8, Investing in Social Capital is written by Jeffrey Sachs. This chapter focuses on "pro-sociality" ("individuals making decisions for the common good that may conflict with short-run egoistic incentives"). It identifies pro-social behaviors: honesty, benevolence, cooperation and trustworthiness. It recommends investment in social capital through education, moral instruction, professional codes of conduct, public censure and condemnation of violators of public trust, and public policies to narrow income inequalities for countries where there is generalized distrust of government and business, pervasive corruption and lawless behavior (such as tax evasion).

Всемирный доклад о счастье 2013 года

[ редактировать ]
Описания

The 2013 World Happiness Report has eight chapters: (1) Introduction, (2) World Happiness: Trends, Explanations and Distribution, (3) Mental Illness and Unhappiness, (4) The Objective Benefits of Subjective Well-being, (5) Restoring Virtue Ethics in the Quest for Happiness, (6) Using Well-being as a Guide to Policy, (7) The OECD Approach to Measuring Subjective Well-being, and (8) From Capabilities to Contentment: Testing the Links between Human Development and Life Satisfaction.

Chapter 1, Introduction is written by John F. Helliwell, Richard Layard and Jeffrey Sachs. It synopsizes the chapters and gives a discussion of the term happiness.

Chapter 2, World Happiness: Trends, Explanations and Distributions is written by John F. Helliwell and Shun Wang. It provides ratings among countries and regions for satisfaction with life using the Cantril Ladder, positive and negative affect (emotions), and log of GDP per capita, years of healthy life expectancy, having someone to count on in times of trouble, perceptions of corruption, prevalence of generosity, and freedom to make life choices.

Chapter 3, Mental Illness and Unhappiness is written by Richard Layard, Dan Chisholm, Vikram Patel, and Shekhar Saxel. It identifies the far ranging prevalence of mental illness around the world (10% of the world's population at one time) and provides the evidence showing that "mental illness is a highly influential - and...the single biggest - determinant of misery". It concludes with examples of interventions implemented by countries around the world.

Chapter 4, The Objective Benefits of Subjective Well-being is written by Jan-Emmanuel de Neve, Ed Diener, Louis Tay and Cody Xuereb. It provides an explanation of the benefits of subjective well-being (happiness) on health & longevity, income, productivity & organizational behavior, and individual & social behavior. It touches on the role of happiness in human evolution through rewarding behaviors that increase evolutionary success and beneficial to survival.

Chapter 5, Restoring Virtue Ethics in the Quest for Happiness is written by Jeffrey Sachs. It argues that "a renewed focus on the role of ethics, and in particular of virtuous behavior, in happiness could lead us to new and effective strategies for raising individual, national and global well-being", looking to the eightfold noble path (the teachings of the dharma handed down in the Buddhist tradition that encompass wise view/understanding, wise intention, wise speech, wise action, wise livelihood, and effort, concentration and mindfulness), Aristotelian philosophy (people are social animals, "with individual happiness secured only within a political community...[which] should organize its institutions to promote virtuous behavior), and Christian doctrine of St. Thomas Aquinas ("placing happiness in the context of servicing God's will"). It gives an explanation of the evolution of the field of economics up t the "failures of hyper-commercialism" and suggests an antidote based on four global ethical values: (1) non-violence and respect for life, (2) justice and solidarity, (3) honesty and tolerance, and (4) mutual esteem and partnership.

Chapter 6, Using Well-being as Guide to Public Policy is written by Gus O'Donnell. This chapter gives a status report on the issues governments grapple with in adopting well-being and happiness measures and goals for policy, from understanding the data or establishing whether a specific policy improves well-being, to figuring out how to "incorporate well-being into standard policy making". It provides examples of efforts to measure happiness and well-being from Bhutan, New Zealand, South Africa, the UK, and cities and communities in the US, Canada, Australia and Tasmania. It identifies the key policy areas of health, transport and education for policy makers to focus on and includes discussions about interpersonal comparability (concentrating on "getting people out of misery" instead of making happy people happier), discount rate (do we invest more in happiness for people today or in the future?) and putting a monetary value on happiness for policy trade off decisions (e.g. If "a 10% reduction in noise increase SWB by one unit, then we can infer that a 10% reduction is "worth" $1,000" when $1,000 would increase a person's SWB by one unit).

Chapter 7, The OECD Approach to Measuring Subjective Well-being is written by Martine Durand and Conal Smith. This chapter was written the same year the OECD issued its Guidelines on Measuring Subjective Well-being,[44] and is a synopsis of such. It includes a definition for subjective well-being: life evaluation (a person's reflection on their life and life circumstances), affect (positive and negative emotions) and eudaimonia; core measures, a discussion on data collection processes, survey and sample design, other aspects of using subjective well-being metrics, and ideas on how policy-makers can use subjective well-being data. It surveys the status of wealthy countries subjective well-being data collection process, and identifies future directions of experimentation and better income measures, citing the Easterlin Paradox as the basis for this call.

Chapter 8, From Capabilities to Contentment: Testing the Links between Human Development and Life Satisfaction is written by Jon Hall.[45] This chapter explains the components of human development using objective metrics: (1) education, health and command over income and nutrition resources, (2) participation and freedom, (3) human security, (4) equity, and (5) sustainability; key findings of the Human Development Index (HDI) ("weak relationship between economic growth and changes in health and education" as well as life expectancy), and examines the relationship between the HDI and happiness, finding that (1) components of the HDI "correlate strongly with better life evaluations", and (2) there is a strong relationship between life evaluation and the "non-income HDI". It contemplates measurement of conditions of life beyond the HDI that are important to well-being: (1) better working conditions, (2) security against crime and physical violence, (3) participation in economic and political activities, (4) freedom and (5) inequality. The concludes with the statements that the HDI and SWB have similar approaches and importantly connected, with the two disciplines offering alternative and complementary views of development.

Всемирный доклад о счастье 2012 года

[ редактировать ]
Описания

The 2012 World Happiness Report was issued at the UN High Level Meeting Well-being and Happiness: Defining a New Economic Paradigm[46] by editors John F. Helliwell, Richard Layard and Jeffrey Sachs. Part one has an introduction (chapter 1) and three chapters: (2) the State of World Happiness, (3) Causes of Happiness and Misery, Some Policy Implications. Part two has three chapters, each a case study, of Bhutan, the United Kingdom Office of National Statistics, and the OECD.

Chapter 1, The Introduction is by Jeffrey Sachs and references Buddha and Aristotle, identifies today's era as the anthropocene, and identifies the reasons GDP is not a sufficient measure to guide governments and society.

Chapter 2, The State of World Happiness, is written by John F. Helliwell and Shun Wang,[47] and contains a discussion of subjective well-being measures that ranges from the validity of subjective well-being measures to the seriousness of happiness, happiness set points and cultural comparisons, and it includes data from the Gallup World Poll, European Social Survey, and the World Values Survey.[48]

Chapter 3, The Causes of Happiness and Misery is written by Richard Layard, Andrew Clark,[49] and Claudia Senik,[50] and contemplates research on the impact on happiness of the external factors of income, work, community and governance, values and religion, as well as the internal factors of mental health, physical health, family experience, education, and gender and age.

Chapter 4, Some Policy Implications, written by John F. Helliwell, Richard Layard and Jeffrey Sachs, calls for a greater understanding on how governments can measure happiness, the determinants of happiness, and use of happiness data and findings about determinants for policy purposes. It also highlights the role of GDP ("GDP is important but not all that is important") as a guide to policy makers, the importance that policy makers should place on providing opportunities for employment; the role of happiness in policy making ("Making happiness an objective of governments would not therefore lead to the "servile society", and indeed quite the contrary...Happiness comes from an opportunity to mold one's own future, and thus depends on a robust level of freedom."); the role of values and religion ("In well-functioning societies there is widespread support for the universal value that we should treat others as we would like them to treat us. We need to cultivate social norms so that the rich and powerful are never given a feeling of impunity vis-à-vis the rest of society."); calls for wider access to psychological therapies in a section on mental health citing the fact that one third of all families are affected by mental illness; identifies improvements in physical health as "probably the single most important factor that has improved human happiness" and calls out the rich-poor gap in health care between rich and poor countries; calls on workplace and governmental policies that encourage work–life balance and reduce stress, including family support and child care; and states that "Universal access to education is widely judged to be a basic human right..." The chapter concludes with a philosophical discussion.

Chapter 5, Case Study: Bhutan Gross National Happiness and the GNH Index is written by Karma Ura,[51] Sabine Alkire,[52] and Tsoki Zangmo. It gives a short history of the development of the Gross National Happiness (GNH) concept in Bhutan, and an explanation of the GNH index, data collection and data analysis process, including the rating methodology to determine if an individual experiences happiness sufficiency levels, as well as the policy and lifestyle implications

Chapter 6, Case Study: ONS Measuring Subjective Well-being: The UK Office of National Statistics Experience is written by Stephen Hicks. It covers the basis for the creation of the Measuring National Well-being Programme[53] in the UK's Office of National Statistics[54] (ONS), and the development of their methodology for measuring well-being.

Chapter 5, Case Study OECD Guidelines on Measuring Subjective Well-being is an explanation about the process and rationale the OECD was undertaking to develop its Guidelines on Measuring Subjective Well-being,[55] which it issued in 2013.

Международные рейтинги

[ редактировать ]

Данные собираются от людей в более чем 150 странах. Каждая измеряемая переменная показывает средневзвешенный балл по шкале от 0 до 10, который отслеживается с течением времени и сравнивается с другими странами. Эти переменные в настоящее время включают в себя:

Каждую страну также сравнивают с гипотетической нацией под названием Антиутопия . Дистопия представляет собой самые низкие национальные средние значения для каждой ключевой переменной и вместе с остаточной ошибкой используется в качестве эталона регрессии. Шесть показателей используются для объяснения предполагаемой степени, в которой каждый из этих факторов способствует повышению удовлетворенности жизнью по сравнению с гипотетической нацией Антиутопия, но сами по себе они не влияют на общий балл, сообщаемый для каждой страны. [56]

отчет за 2024 год

[ редактировать ]

В отчете за 2024 год представлен средний показатель счастья за 2021–2023 годы. [57]

Стол
Overall rankCountry or regionLife evaluation
1 Finland7.741
2 Denmark7.583
3 Iceland7.525
4 Sweden7.344
5 Israel7.341
6 Netherlands7.319
7 Norway7.302
8 Luxembourg7.122
9  Switzerland7.060
10 Australia7.057
11 New Zealand7.029
12 Costa Rica6.955
13 Kuwait6.951
14 Austria6.905
15 Canada6.900
16 Belgium6.894
17 Ireland6.838
18 Czechia6.822
19 Lithuania6.818
20 United Kingdom6.749
21 Slovenia6.743
22 United Arab Emirates6.733
23 United States6.725
24 Germany6.719
25 Mexico6.678
26 Uruguay6.611
27 France6.609
28 Saudi Arabia6.594
29 Kosovo6.561
30 Singapore6.523
31 Taiwan6.503
32 Romania6.491
33 El Salvador6.469
34 Estonia6.448
35 Poland6.442
36 Spain6.421
37 Serbia6.411
38 Chile6.360
39 Panama6.358
40 Malta6.346
41 Italy6.324
42 Guatemala6.287
43 Nicaragua6.284
44 Brazil6.272
45 Slovakia6.257
46 Latvia6.234
47 Uzbekistan6.195
48 Argentina6.188
49 Kazakhstan6.188
50 Cyprus6.068
51 Japan6.060
52 South Korea6.058
53 Philippines6.048
54 Vietnam6.043
55 Portugal6.030
56 Hungary6.017
57 Paraguay5.977
58 Thailand5.976
59 Malaysia5.975
60 China5.973
61 Honduras5.968
62 Bahrain5.959
63 Croatia5.942
64 Greece5.934
65 Bosnia and Herzegovina5.877
66 Libya5.866
67 Jamaica5.842
68 Peru5.841
69 Dominican Republic5.823
70 Mauritius5.816
71 Moldova5.816
72 Russia5.785
73 Bolivia5.784
74 Ecuador5.725
75 Kyrgyzstan5.714
76 Montenegro5.707
77 Mongolia5.696
78 Colombia5.695
79 Venezuela5.607
80 Indonesia5.568
81 Bulgaria5.463
82 Armenia5.455
83 South Africa5.422
84 North Macedonia5.369
85 Algeria5.364
86 Hong Kong5.316
87 Albania5.304
88 Tajikistan5.281
89 Congo (Brazzaville)5.221
90 Mozambique5.216
91 Georgia5.185
92 Iraq5.166
93   Nepal5.158
94 Laos5.139
95 Gabon5.106
96 Ivory Coast5.080
97 Guinea5.023
98 Turkey4.975
99 Senegal4.969
100 Iran4.923
101 Azerbaijan4.893
102 Nigeria4.881
103 State of Palestine4.879
104 Cameroon4.874
105 Ukraine4.873
106 Namibia4.832
107 Morocco4.795
108 Pakistan4.657
109 Niger4.556
110 Burkina Faso4.548
111 Mauritania4.505
112 Gambia4.485
113 Chad4.471
114 Kenya4.470
115 Tunisia4.422
116 Benin4.377
117 Uganda4.372
118 Myanmar4.354
119 Cambodia4.341
120 Ghana4.289
121 Liberia4.269
122 Mali4.232
123 Madagascar4.228
124 Togo4.214
125 Jordan4.186
126 India4.054
127 Egypt3.977
128 Sri Lanka3.898
129 Bangladesh3.886
130 Ethiopia3.861
131 Tanzania3.781
132 Comoros3.566
133 Yemen3.561
134 Zambia3.502
135 Eswatini3.502
136 Malawi3.421
137 Botswana3.383
138 Zimbabwe3.341
139 Congo (Kinshasa)3.295
140 Sierra Leone3.245
141 Lesotho3.186
142 Lebanon2.707
143 Afghanistan1.721

отчет за 2023 год

[ редактировать ]

В отчете за 2023 год представлены средние показатели счастья за 2020–2022 годы.

Стол
Overall rankCountry or region
1 Finland
2 Denmark
3 Iceland
4 Israel
5 Netherlands
6 Sweden
7 Norway
8  Switzerland
9 Luxembourg
10 New Zealand
11 Austria
12 Australia
13 Canada
14 Ireland
15 United States
16 Germany
17 Belgium
18 Czech Republic
19 United Kingdom
20 Lithuania
21 France
22 Slovenia
23 Costa Rica
24 Romania
25 Singapore*
26 United Arab Emirates
27 Taiwan
28 Uruguay
29 Slovakia*
30 Saudi Arabia
31 Estonia
32 Spain
33 Italy
34 Kosovo
35 Chile
36 Mexico
37 Malta
38 Panama
39 Poland
40 Nicaragua
41 Latvia
42 Bahrain*
43 Guatemala
44 Kazakhstan
45 Serbia*
46 Cyprus
47 Japan
48 Croatia
49 Brazil
50 El Salvador
51 Hungary
52 Argentina
53 Honduras
54 Uzbekistan
55 Malaysia*
56 Portugal
57 South Korea
58 Greece
59 Mauritius
60 Thailand
61 Mongolia
62 Kyrgyzstan
63 Moldova
64 China*
65 Vietnam
66 Paraguay
67 Montenegro*
68 Jamaica
69 Bolivia
70 Russia
71 Bosnia and Herzegovina*
72 Colombia
73 Dominican Republic
74 Ecuador
75 Peru
76 Philippines*
77 Bulgaria
78   Nepal
79 Armenia
80 Tajikistan*
81 Algeria*
82 Hong Kong
83 Albania
84 Indonesia
85 South Africa*
86 Congo, Republic of
87 North Macedonia
88 Venezuela
89 Laos*
90 Georgia
91 Guinea
92 Ukraine
93 Ivory Coast
94 Gabon
95 Nigeria*
96 Cameroon
97 Mozambique
98 Iraq*
99 Palestine
100 Morocco
101 Iran
102 Senegal
103 Mauritania
104 Burkina Faso*
105 Namibia
106 Turkey*
107 Ghana
108 Pakistan
109 Niger
110 Tunisia
111 Kenya
112 Sri Lanka*
113 Uganda*
114 Chad
115 Cambodia
116 Benin
117 Myanmar*
118 Bangladesh
119 Gambia
120 Mali
121 Egypt
122 Togo
123 Jordan
124 Ethiopia
125 Liberia
126 India
127 Madagascar
128 Zambia*
129 Tanzania
130 Comoros
131 Malawi
132 Botswana
133 Congo, Democratic Republic of
134 Zimbabwe
135 Sierra Leone
136 Lebanon
137 Afghanistan
* indicates the country does not have survey information in 2022. Their averages are based on the 2020 and 2021 surveys.

отчет за 2022 год

[ редактировать ]

В отчете за 2022 год представлен средний показатель счастья за 2019–2021 годы.

Стол
Overall rankCountry or region
1 Finland
2 Denmark
3 Iceland
4  Switzerland
5 Netherlands
6 Luxembourg
7 Sweden
8 Norway
9 Israel
10 New Zealand
11 Austria
12 Australia
13 Ireland
14 Germany
15 Canada
16 United States
17 United Kingdom
18 Czech Republic
19 Belgium
20 France

отчет за 2020 год

[ редактировать ]

В отчете за 2020 год представлен средний показатель счастья за 2017–2019 годы. Финляндия — самая «счастливая» страна в мире, за ней следуют Дания, Швейцария, Исландия и Норвегия. Данные взяты из опроса Gallup World Poll, полностью основанного на результатах опросов и ответах на главный вопрос об оценке жизни, заданный в опросе.

Стол
Overall rankCountry or regionScoreGDP per capitaSocial supportHealthy life expectancyFreedom to make life choicesGenerosityPerceptions of corruption
1 Finland7.8091.2851.5000.9610.6620.1600.478
2 Denmark7.6461.3271.5030.9790.6650.2430.495
3  Switzerland7.5601.3911.4721.0410.6290.2690.408
4 Iceland7.5041.3271.5481.0010.6620.3620.145
5 Norway7.4881.4241.4951.0080.6700.2880.434
6 Netherlands7.4491.3391.4640.9760.6140.3360.369
7 Sweden7.3531.3221.4330.9860.6500.2730.442
8 New Zealand7.3001.2421.4871.0080.6470.3260.461
9 Austria7.2941.3171.4371.0010.6030.2560.281
10 Luxembourg7.2381.5371.3880.9860.6100.1960.367
11 Canada7.2321.3021.4351.0230.6440.2820.352
12 Australia7.2231.3101.4771.0230.6220.3250.336
13 United Kingdom7.1651.2731.4580.9760.5250.3730.323
14 Israel7.1291.2161.4031.0080.4210.2670.100
15 Costa Rica7.1210.9811.3750.9400.6450.1310.096
16 Ireland7.0941.4471.4710.9760.5880.2950.373
17 Germany7.0761.3141.3690.9720.5640.2520.309
18 United States6.9401.3741.4050.8320.5350.2980.152
19 Czech Republic6.9111.2121.4050.8950.5060.0460.050
20 Belgium6.8641.2961.3990.9650.5000.1470.209
21 United Arab Emirates6.7911.4311.2510.7880.6530.2810.220
22 Malta6.7731.2531.4430.9720.6330.3410.179
23 France6.6641.2681.4591.0300.5140.1130.227
24 Mexico6.4651.0241.2260.8320.5540.0830.083
25 Taiwan6.4551.3271.3580.8780.4490.1510.132
26 Uruguay6.4401.0711.4250.8570.5940.1320.193
27 Saudi Arabia6.4061.3341.3100.7600.5480.0870.163
28 Spain6.4011.2311.4211.0510.4260.1650.110
29 Guatemala6.3990.7541.1740.7060.6130.1710.098
30 Italy6.3871.2361.3471.0230.3210.1700.040
31 Singapore6.3771.5201.3951.1380.6350.2190.533
32 Brazil6.3760.9531.3630.7660.4830.1320.107
33 Slovenia6.3631.2091.4650.9330.6470.1460.077
34 El Salvador6.3480.7491.1490.7530.5240.1190.117
35 Kosovo6.3250.8401.1840.6730.5570.3250.009
36 Panama6.3051.0981.3760.8790.5800.0970.054
37 Slovakia6.2811.1951.4240.8530.4240.1170.011
38 Uzbekistan6.2580.6971.4340.7170.6930.3630.280
39 Chile6.2281.0971.3230.8890.4170.1560.063
40 Bahrain6.2271.2971.3150.8390.6100.2870.127
41 Lithuania6.2151.1941.4330.7950.4200.0540.081
42 Trinidad and Tobago6.1921.1681.4070.6590.5530.1990.015
43 Poland6.1861.1691.3100.8680.5580.0630.161
44 Colombia6.1630.9321.3340.8100.5270.0920.046
45 Cyprus6.1591.2131.1491.0260.4590.2280.051
46 Nicaragua6.1370.6201.2710.8030.5600.2130.174
47 Romania6.1241.1201.1940.7920.5350.0680.001
48 Kuwait6.1021.4251.2450.7760.5700.1330.113
49 Mauritius6.1011.0741.3960.7630.5910.1870.084
50 Kazakhstan6.0581.1231.4530.6990.4970.1540.110
51 Estonia6.0221.1921.4530.8430.5770.1250.202
52 Philippines6.0060.7751.2450.6020.6220.1290.130
53 Hungary6.0001.1641.4230.8070.3860.0700.028
54 Thailand5.9991.0071.3480.7940.6090.3770.032
55 Argentina5.9751.0281.3730.8500.5210.0700.060
56 Honduras5.9530.5991.1870.7920.5680.2570.087
57 Latvia5.9501.1411.4140.7780.3290.0750.090
58 Ecuador5.9250.8531.2210.8390.5550.1150.087
59 Portugal5.9111.1691.3400.9790.5900.0530.028
60 Jamaica5.8900.7791.4080.7880.5530.1160.030
61 South Korea5.8721.2451.1341.0230.2590.1700.095
62 Japan5.8711.2671.3321.0730.4950.0360.181
63 Peru5.7970.9191.2080.8240.5130.0920.027
64 Serbia5.7780.9881.3270.8280.3950.1500.059
65 Bolivia5.7470.7311.1420.6620.5740.1380.073
66 Pakistan5.6930.6170.8730.4700.4050.2290.123
67 Paraguay5.6920.8981.3680.7360.5870.2040.065
68 Dominican Republic5.6890.9831.3290.7420.5630.1120.116
69 Bosnia and Herzegovina5.6740.9181.2040.8140.3050.2640.001
70 Moldova5.6080.7081.2370.7130.3900.1740.014
71 Tajikistan5.5560.4751.2180.6810.5210.1820.222
72 Montenegro5.5461.0101.2660.8390.3030.1490.098
73 Russia5.5461.1271.3790.6800.3990.0990.046
74 Kyrgyzstan5.5420.5131.3410.6810.6150.3010.030
75 Belarus5.5401.0191.3870.7530.2910.0900.194
76 North Cyprus5.5361.2131.1831.0260.4780.1990.200
77 Greece5.5151.1281.1690.9790.1740.0000.049
78 Hong Kong5.5101.3771.2441.1370.4590.2880.332
79 Croatia5.5051.1091.3110.9010.3810.1140.012
80 Libya5.4891.0221.1960.6160.4510.1430.172
81 Mongolia5.4560.9051.4590.6160.3560.2640.047
82 Malaysia5.3841.1681.1740.7890.5970.2750.062
83 Vietnam5.3530.7181.2530.8190.6510.1360.090
84 Indonesia5.2860.8921.1550.6100.5680.5430.038
85 Ivory Coast5.2330.5370.8000.1550.3970.1700.093
86 Benin5.2160.3660.3520.3280.4060.1970.126
87 Maldives5.1980.9381.4020.9140.5480.2240.072
88 Congo (Brazzaville)5.1940.6340.7580.4580.3870.1170.119
89 Azerbaijan5.1650.9901.1810.7310.4680.0400.247
90 North Macedonia5.1600.9351.1830.8030.4100.1860.025
91 Ghana5.1480.5760.9660.4320.4770.2610.057
92   Nepal5.1370.4441.1010.6690.4810.3010.128
93 Turkey5.1321.1271.1970.7810.2540.0860.121
94 China5.1240.9911.1320.8670.6020.0790.117
95 Turkmenistan5.1191.0091.5100.6120.5150.3230.034
96 Bulgaria5.1021.0471.4610.7780.4180.1040.000
97 Morocco5.0950.7590.6450.7450.4500.0400.077
98 Cameroon5.0850.5040.9000.2700.4390.1980.054
99 Venezuela5.0530.7701.3490.7670.2720.0870.064
100 Algeria5.0050.9441.1430.7450.0840.1190.129
101 Senegal4.9810.5040.9550.5180.3520.1640.082
102 Guinea4.9490.3900.7510.3340.3720.2490.112
103 Niger4.9100.1080.7040.2990.4350.2080.138
104 Laos4.8890.7150.9870.4860.6120.2730.194
105 Albania4.8830.9070.8300.8460.4620.1710.025
106 Cambodia4.8480.5451.0710.5880.6750.2330.073
107 Bangladesh4.8330.5560.8690.6950.6040.1770.177
108 Gabon4.8290.9881.1060.5230.3690.0520.056
109 South Africa4.8140.9021.2590.4070.4350.1260.060
110 Iraq4.7850.9821.0110.5290.2840.1530.073
111 Lebanon4.7720.8891.1920.7890.1860.1590.022
112 Burkina Faso4.7690.3020.9290.3130.3220.1860.126
113 Gambia4.7510.2570.8830.3530.4030.4260.158
114 Mali4.7290.3520.9730.2350.3780.1700.062
115 Nigeria4.7240.6460.9870.1680.4350.2210.048
116 Armenia4.6770.8081.0350.7760.3780.1070.105
117 Georgia4.6730.8470.7310.6950.4850.0480.174
118 Iran4.6721.0290.8860.7490.3010.2770.143
119 Jordan4.6330.7851.1400.7780.4250.0910.152
120 Mozambique4.6240.1790.9550.3240.5610.2200.163
121 Kenya4.5830.4760.9050.5360.5190.3940.067
122 Namibia4.5710.8401.2460.4070.4450.0760.054
123 Ukraine4.5610.7801.3210.6990.3190.1790.010
124 Liberia4.5580.1740.9210.3920.4060.2270.051
125 Palestine4.5530.5881.1950.6140.2990.0920.072
126 Uganda4.4320.3121.0520.3780.4020.2650.064
127 Chad4.4230.3020.7390.1090.2290.2110.086
128 Tunisia4.3920.8750.8720.7810.2360.0560.044
129 Mauritania4.3750.5401.1130.4250.1860.1290.122
130 Sri Lanka4.3270.8981.1950.7920.5290.2530.049
131 Congo (Kinshasa)4.3110.0620.8330.2770.3650.2540.081
132 Eswatini4.3080.8281.0650.2160.3000.0670.147
133 Myanmar4.3080.6781.0980.4950.5970.5700.188
134 Comoros4.2890.4160.7230.4370.1810.2590.100
135 Togo4.1870.2680.5480.3430.3040.2010.115
136 Ethiopia4.1860.3151.0010.4840.4130.2280.117
137 Madagascar4.1660.2450.8240.5010.1930.1910.076
138 Egypt4.1510.8750.9830.5970.3740.0690.095
139 Sierra Leone3.9260.2410.7480.2040.3820.2580.048
140 Burundi3.7750.0000.4040.2950.2750.1870.212
141 Zambia3.7590.5370.8960.3640.4910.2510.087
142 Haiti3.7210.2850.6470.3740.1690.4640.162
143 Lesotho3.6530.4551.0890.1010.4090.1030.050
144 India3.5730.7310.6440.5410.5810.2370.106
145 Malawi3.5380.1770.5300.4460.4870.2130.132
146 Yemen3.5270.3931.1770.4150.2440.0950.087
147 Botswana3.4790.9981.0860.4940.5090.0330.102
148 Tanzania3.4760.4570.8730.4430.5090.2720.204
149 Central African Republic3.4760.0410.0000.0000.2930.2540.028
150 Rwanda3.3120.3430.5230.5720.6040.2360.486
151 Zimbabwe3.2990.4261.0480.3750.3770.1510.081
152 South Sudan2.8170.2890.5530.2090.0660.2100.111
153 Afghanistan2.5670.3010.3560.2660.0000.1350.001

отчет за 2019 год

[ редактировать ]

В отчете за 2019 год представлен средний показатель счастья за 2016–2018 годы. Согласно Индексу счастья 2019 года, Финляндия является самой счастливой страной в мире. Дания , Норвегия , Исландия и Нидерланды Следующие лидирующие позиции занимают . Отчет был опубликован ООН 20 марта 2019 года. Полный отчет можно прочитать на странице «Отчет за 2019 год» . «Доклад о мировом счастье» — это знаковое исследование состояния глобального счастья.

Стол
Overall rankCountry or regionScoreGDP per capitaSocial supportHealthy life expectancyFreedom to make life choicesGenerosityPerceptions of corruption
1 Finland7.7691.3401.5870.9860.5960.1530.393
2 Denmark7.6001.3831.5730.9960.5920.2520.410
3 Norway7.5541.4881.5821.0280.6030.2710.341
4 Iceland7.4941.3801.6241.0260.5910.3540.118
5 Netherlands7.4881.3961.5220.9990.5570.3220.298
6  Switzerland7.4801.4521.5261.0520.5720.2630.343
7 Sweden7.3431.3871.4871.0090.5740.2670.373
8 New Zealand7.3071.3031.5571.0260.5850.3300.380
9 Canada7.2781.3651.5051.0390.5840.2850.308
10 Austria7.2461.3761.4751.0160.5320.2440.226
11 Australia7.2281.3721.5481.0360.5570.3320.290
12 Costa Rica7.1671.0341.4410.9630.5580.1440.093
13 Israel7.1391.2761.4551.0290.3710.2610.082
14 Luxembourg7.0901.6091.4791.0120.5260.1940.316
15 United Kingdom7.0541.3331.5380.9960.4500.3480.278
16 Ireland7.0211.4991.5530.9990.5160.2980.310
17 Germany6.9851.3731.4540.9870.4950.2610.265
18 Belgium6.9231.3561.5040.9860.4730.1600.210
19 United States of America6.8921.4331.4570.8740.4540.2800.128
20 Czech Republic6.8521.2691.4870.9200.4570.0460.036
21 United Arab Emirates6.8251.5031.3100.8250.5980.2620.182
22 Malta6.7261.3001.5200.9990.5640.3750.151
23 Mexico6.5951.0701.3230.8610.4330.0740.073
24 France6.5921.3241.4721.0450.4360.1110.183
25 Taiwan6.4461.3681.4300.9140.3510.2420.097
26 Chile6.4441.1591.3690.9200.3570.1870.056
27 Guatemala6.4360.8001.2690.7460.5350.1750.078
28 Saudi Arabia6.3751.4031.3570.7950.4390.0800.132
29 Qatar6.3741.6841.3130.8710.5550.2200.167
30 Spain6.3541.2861.4841.0620.3620.1530.079
31 Panama6.3211.1491.4420.9100.5160.1090.054
32 Brazil6.3001.0041.4390.8020.3900.0990.086
33 Uruguay6.2931.1241.4650.8910.5230.1270.150
34 Singapore6.2621.5721.4631.1410.5560.2710.453
35 El Salvador6.2530.7941.2420.7890.4300.0930.074
36 Italy6.2231.2941.4881.0390.2310.1580.030
37 Bahrain6.1991.3621.3680.8710.5360.2550.110
38 Slovakia6.1981.2461.5040.8810.3340.1210.014
39 Trinidad & Tobago6.1921.2311.4770.7130.4890.1850.016
40 Poland6.1821.2061.4380.8840.4830.1170.050
41 Uzbekistan6.1740.7451.5290.7560.6310.3220.240
42 Lithuania6.1491.2381.5150.8180.2910.0430.042
43 Colombia6.1250.9851.4100.8410.4700.0990.034
44 Slovenia6.1181.2581.5230.9530.5640.1440.057
45 Nicaragua6.1050.6941.3250.8350.4350.2000.127
46 Kosovo6.1000.8821.2320.7580.4890.2620.006
47 Argentina6.0861.0921.4320.8810.4710.0660.050
48 Romania6.0701.1621.2320.8250.4620.0830.005
49 Cyprus6.0461.2631.2231.0420.4060.1900.041
50 Ecuador6.0280.9121.3120.8680.4980.1260.087
51 Kuwait6.0111.0501.4090.8280.5570.3590.028
52 Thailand6.0081.0501.4090.8280.5570.3590.028
53 Latvia5.9401.1871.4650.8120.2640.0750.064
54 South Korea5.8951.3011.2191.0360.1590.1750.056
55 Estonia5.8931.2371.5280.8740.4950.1030.161
56 Jamaica5.8900.8311.4780.8310.4900.1070.028
57 Mauritius5.8881.1201.4020.7980.4980.2150.060
58 Japan5.8861.3271.4191.0880.4450.0690.140
59 Honduras5.8600.6421.2360.8280.5070.2460.078
60 Kazakhstan5.8091.1731.5080.7290.4100.1460.096
61 Bolivia5.7790.7761.2090.7060.5110.1370.064
62 Hungary5.7581.2011.4100.8280.1990.0810.020
63 Paraguay5.7430.8551.4750.7770.5140.1840.080
64 Northern Cyprus5.7181.2631.2521.0420.4170.1910.162
65 Peru5.6970.9601.2740.8540.4550.0830.027
66 Portugal5.6931.2211.4310.9990.5080.0470.025
67 Pakistan5.6530.6770.8860.5350.3130.2200.098
68 Russia5.6481.1831.4520.7260.3340.0820.031
69 Philippines5.6310.8071.2930.6570.5580.1170.107
70 Serbia5.6031.0041.3830.8540.2820.1370.039
71 Moldova5.5290.6851.3280.7390.2450.1810.000
72 Libya5.5251.0441.3030.6730.4160.1330.152
73 Montenegro5.5231.0511.3610.8710.1970.1420.080
74 Tajikistan5.4670.4931.0980.7180.3890.2300.144
75 Croatia5.4321.1551.2660.9140.2960.1190.022
76 Hong Kong5.4301.4381.2771.1220.4400.2580.287
77 Dominican Republic5.4251.0151.4010.7790.4970.1130.101
78 Bosnia and Herzegovina5.3860.9451.2120.8450.2120.2630.006
79 Turkey5.3731.1831.3600.8080.1950.0830.106
80 Malaysia5.3391.2211.1710.8280.5080.2600.024
81 Belarus5.3231.0671.4650.7890.2350.0940.142
82 Greece5.2871.1811.1560.9990.0670.0000.034
83 Mongolia5.2850.9481.5310.6670.3170.2350.038
84 North Macedonia5.2740.9831.2940.8380.3450.1850.034
85 Nigeria5.2650.6961.1110.2450.4260.2150.041
86 Kyrgyzstan5.2610.5511.4380.7230.5080.3000.023
87 Turkmenistan5.2471.0521.5380.6570.3940.2440.028
88 Algeria5.2111.0021.1600.7850.0860.0730.114
89 Morocco5.2080.8010.7820.7820.4180.0360.076
90 Azerbaijan5.2081.0431.1470.7690.3510.0350.182
91 Lebanon5.1970.9871.2240.8150.2160.1660.027
92 Indonesia5.1920.9311.2030.6600.4910.4980.028
93 China5.1911.0291.1250.8930.5210.0580.100
94 Vietnam5.1750.7411.3460.8510.5430.1470.073
95 Bhutan5.0820.8131.3210.6040.4570.3700.167
96 Cameroon5.0440.5490.9100.3310.3810.1870.037
97 Bulgaria5.0111.0921.5130.8150.3110.0810.004
98 Ghana4.9960.6110.8680.4860.3810.2450.040
99 Ivory Coast4.9440.5690.8080.2320.3520.1540.090
100   Nepal4.9130.4461.2260.6770.4390.2850.089
101 Jordan4.9060.8371.2250.8150.3830.1100.130
102 Benin4.8830.3930.4370.3970.3490.1750.082
103 Congo (Brazzaville)4.8120.6730.7990.5080.3720.1050.093
104 Gabon4.7991.0571.1830.5710.2950.0430.055
105 Laos4.7960.7641.0300.5510.5470.2660.164
106 South Africa4.7220.9601.3510.4690.3890.1300.055
107 Albania4.7190.9470.8480.8740.3830.1780.027
108 Venezuela4.7070.9601.4270.8050.1540.0640.047
109 Cambodia4.7000.5741.1220.6370.6090.2320.062
110 Palestinian Territories4.6960.6571.2470.6720.2250.1030.066
111 Senegal4.6810.4501.1340.5710.2920.1530.072
112 Somalia4.6680.0000.6980.2680.5590.2430.270
113 Namibia4.6390.8791.3130.4770.4010.0700.056
114 Niger4.6280.1380.7740.3660.3180.1880.102
115 Burkina Faso4.5870.3311.0560.3800.2550.1770.113
116 Armenia4.5590.8501.0550.8150.2830.0950.064
117 Iran4.5481.1000.8420.7850.3050.2700.125
118 Guinea4.5340.3800.8290.3750.3320.2070.086
119 Georgia4.5190.8860.6660.7520.3460.0430.164
120 Gambia4.5160.3080.9390.4280.3820.2690.167
121 Kenya4.5090.5120.9830.5810.4310.3720.053
122 Mauritania4.4900.5701.1670.4890.0660.1060.088
123 Mozambique4.4660.2040.9860.3900.4940.1970.138
124 Tunisia4.4610.9211.0000.8150.1670.0590.055
125 Bangladesh4.4560.5620.9280.7230.5270.1660.143
126 Iraq4.4371.0430.9800.5740.2410.1480.089
127 Congo (Kinshasa)4.4180.0941.1250.3570.2690.2120.053
128 Mali4.3900.3851.1050.3080.3270.1530.052
129 Sierra Leone4.3740.2680.8410.2420.3090.2520.045
130 Sri Lanka4.3660.9491.2650.8310.4700.2440.047
131 Myanmar4.3600.7101.1810.5550.5250.5660.172
132 Chad4.3500.3500.7660.1920.1740.1980.078
133 Ukraine4.3320.8201.3900.7390.1780.1870.010
134 Ethiopia4.2860.3361.0330.5320.3440.2090.100
135 Eswatini4.2120.8111.1490.0000.3130.0740.135
136 Uganda4.1890.3321.0690.4430.3560.2520.060
137 Egypt4.1660.9131.0390.6440.2410.0760.067
138 Zambia4.1070.5781.0580.4260.4310.2470.087
139 Togo4.0850.2750.5720.4100.2930.1770.085
140 India4.0150.7550.7650.5880.4980.2000.085
141 Liberia3.9750.0730.9220.4430.3700.2330.033
142 Comoros3.9730.2740.7570.5050.1420.2750.078
143 Madagascar3.9330.2740.9160.5550.1480.1690.041
144 Lesotho3.8020.4891.1690.1680.3590.1070.093
145 Burundi3.7750.0460.4470.3800.2200.1760.180
146 Zimbabwe3.6630.3661.1140.4330.3610.1510.089
147 Haiti3.5970.3230.6880.4490.0260.4190.110
148 Botswana3.4881.0411.1450.5380.4550.0250.100
149 Syria3.4620.6190.3780.4400.0130.3310.141
150 Malawi3.4100.1910.5600.4950.4430.2180.089
151 Yemen3.3800.2871.1630.4630.1430.1080.077
152 Rwanda3.3340.3590.7110.6140.5550.2170.411
153 Tanzania3.2310.4760.8850.4990.4170.2760.147
154 Afghanistan3.2030.3500.5170.3610.0000.1580.025
155 Central African Republic3.0830.0260.0000.1050.2250.2350.035
156 South Sudan2.8530.3060.5750.2950.0100.2020.091

отчет за 2018 год

[ редактировать ]

В отчете за 2018 год представлены средние показатели счастья за 2015–2017 годы. Согласно Индексу счастья 2018 года, Финляндия является самой счастливой страной в мире. Норвегия , Дания , Исландия и Швейцария Следующие лидирующие позиции занимают . Доклад был опубликован ООН 14 марта 2018 года. Полный отчет можно прочитать на странице «Отчет за 2018 год» . «Доклад о мировом счастье» — это знаковое исследование состояния глобального счастья. Доклад о мировом счастье за ​​2018 год, в котором оцениваются 156 стран по уровню счастья и 117 стран по уровню счастья их иммигрантов, был опубликован 14 марта на торжественном мероприятии в Папской академии наук в Ватикане.

Стол
Overall rankCountry or regionScoreGDP per capitaSocial supportFreedom to make life choicesGenerosityPerceptions of corruption
1 Finland7.6321.3051.5920.8740.6810.2020.393
2 Norway7.5941.4561.5820.8610.6860.2860.340
3 Denmark7.5551.3511.5900.8680.6830.2840.408
4 Iceland7.4951.3431.6440.9140.6770.3530.138
5  Switzerland7.4871.4201.5490.9270.6600.2560.357
6 Netherlands7.4411.3611.4880.8780.6380.3330.295
7 Canada7.3281.3301.5320.8960.6530.3210.291
8 New Zealand7.3241.2681.6010.8760.6690.3650.389
9 Sweden7.3141.3551.5010.9130.6590.2850.383
10 Australia7.2721.3401.5730.9100.6470.3610.302
11 United Kingdom7.1901.2441.4330.8880.4640.2620.082
12 Austria7.1391.3411.5040.8910.6170.2420.224
13 Costa Rica7.0721.0101.4590.8170.6320.1430.101
14 Ireland6.9771.4481.5830.8760.6140.3070.306
15 Germany6.9651.3401.4740.8610.5860.2730.280
16 Belgium6.9271.3241.4830.8940.5830.1880.240
17 Luxembourg6.9101.5761.5200.8960.6320.1960.321
18 United States6.8861.3981.4710.8190.5470.2910.133
19 Israel6.8141.3011.5590.8830.5330.3540.272
20 United Arab Emirates6.7742.0960.7760.6700.2840.186N/A
21 Czech Republic6.7111.2331.4890.8540.5430.0640.034
22 Malta6.6271.2701.5250.8840.6450.3760.142
23 France6.4891.2931.4660.9080.5200.0980.176
24 Mexico6.4881.0381.2520.7610.4790.0690.095
25 Chile6.4761.1311.3310.8080.4310.1970.061
26 Taiwan6.4411.3651.4360.8570.4180.1510.078
27 Panama6.4301.1121.4380.7590.5970.1250.063
28 Brazil6.4190.9861.4740.6750.4930.1100.088
29 Argentina6.3881.0731.4680.7440.5700.0620.054
30 Guatemala6.3820.7811.2680.6080.6040.1790.071
31 Uruguay6.3791.0931.4590.7710.6250.1300.155
32 Qatar6.3741.6491.3030.7480.6540.2560.171
33 Saudi Arabia6.3711.3791.3310.6330.5090.0980.127
34 Singapore6.3431.5291.4511.0080.6310.2610.457
35 Malaysia6.3221.1611.2580.6690.3560.3110.059
36 Spain6.3101.2511.5380.9650.4490.1420.074
37 Colombia6.2600.9601.4390.6350.5310.0990.039
38 Trinidad & Tobago6.1921.2231.4920.5640.5750.1710.019
39 Slovakia6.1731.2101.5370.7760.3540.1180.014
40 El Salvador6.1670.8061.2310.6390.4610.0650.082
41 Nicaragua6.1410.6681.3190.7000.5270.2080.128
42 Poland6.1231.1761.4480.7810.5460.1080.064
43 Bahrain6.1051.3381.3660.6980.5940.2430.123
44 Uzbekistan6.0960.7191.5840.6050.7240.3280.259
45 Kuwait6.0831.4741.3010.6750.5540.1670.106
46 Thailand6.0721.0161.4170.7070.6370.3640.029
47 Italy6.0001.2641.5010.9460.2810.1370.028
48 Ecuador5.9730.8891.3300.7360.5560.1140.120
49 Belize5.9560.8071.1010.4740.5930.1830.089
50 Lithuania5.9521.1971.5270.7160.3500.0260.006
51 Slovenia5.9481.2191.5060.8560.6330.1600.051
52 Romania5.9451.1161.2190.7260.5280.0880.001
53 Latvia5.9331.1481.4540.6710.3630.0920.066
54 Japan5.9151.2941.4620.9880.5530.0790.150
55 Mauritius5.8911.0901.3870.6840.5840.2450.050
56 Jamaica5.8900.8191.4930.6930.5750.0960.031
57 South Korea5.8751.2661.2040.9550.2440.1750.051
58 Northern Cyprus5.8351.2291.2110.9090.4950.1790.154
59 Russia5.8101.1511.4790.5990.3990.0650.025
60 Kazakhstan5.7901.1431.5160.6310.4540.1480.121
61 Cyprus5.7621.2291.1910.9090.4230.2020.035
62 Bolivia5.7520.7511.2230.5080.6060.1410.054
63 Estonia5.7391.2001.5320.7370.5530.0860.174
64 Paraguay5.6810.8351.5220.6150.5410.1620.074
65 Peru5.6630.9341.2490.6740.5300.0920.034
66 Kosovo5.6620.8551.2300.5780.4480.2740.023
67 Moldova5.6400.6571.3010.6200.2320.1710.000
68 Turkmenistan5.6361.0161.5330.5170.4170.1990.037
69 Hungary5.6201.1711.4010.7320.2590.0610.022
70 Libya5.5660.9851.3500.5530.4960.1160.148
71 Philippines5.5240.7751.3120.5130.6430.1200.105
72 Honduras5.5040.6201.2050.6220.4590.1970.074
73 Belarus5.4831.0391.4980.7000.3070.1010.154
74 Turkey5.4831.1481.3800.6860.3240.1060.109
75 Pakistan5.4720.6520.8100.4240.3340.2160.113
76 Hong Kong5.4301.4051.2901.0300.5240.2460.291
77 Portugal5.4101.1881.4290.8840.5620.0550.017
78 Serbia5.3980.9751.3690.6850.2880.1340.043
79 Greece5.3581.1541.2020.8790.1310.0000.044
80
Lebanon
5.3580.9651.1790.7850.5030.2140.136
81 Montenegro5.3471.0171.2790.7290.2590.1110.081
82 Croatia5.3211.1151.1610.7370.3800.1200.039
83 Dominican Republic5.3020.9821.4410.6140.5780.1200.106
84 Algeria5.2950.9791.1540.6870.0770.0550.135
85 Morocco5.2540.7790.7970.6690.4600.0260.074
86 China5.2460.9891.1420.7990.5970.0290.103
87 Azerbaijan5.2011.0241.1610.6030.4300.0310.176
88
Tajikistan
5.1990.4741.1660.5980.2920.1870.034
89 Macedonia5.1850.9591.2390.6910.3940.1730.052
90 Jordan5.1610.8221.2650.6450.4680.1300.134
91 Nigeria5.1550.6891.1720.0480.4620.2010.032
92 Kyrgyzstan5.1310.5301.4160.5940.5400.2810.035
93 Bosnia and Herzegovina5.1290.9151.0780.7580.2800.2160.000
94 Mongolia5.1250.9141.5170.5750.3950.2530.032
95 Vietnam5.1030.7151.3650.7020.6180.1770.079
96 Indonesia5.0930.8991.2150.5220.5380.4840.018
97 Bhutan5.0820.7961.3350.5270.5410.3640.171
98 Somalia4.9820.0000.7120.1150.6740.2380.282
99 Cameroon4.9750.5350.8910.1820.4540.1830.043
100 Bulgaria4.9331.0541.5150.7120.3590.0640.009
101   Nepal4.8800.4251.2280.5390.5260.3020.078
102 Venezuela4.8060.9961.4690.6570.1330.0560.052
103 Gabon4.7581.0361.1640.4040.3560.0320.052
104 Palestinian Territories4.7430.6421.2170.6020.2660.0860.076
105 South Africa4.7240.9401.4100.3300.5160.1030.056
106 Iran4.7071.0590.7710.6910.4590.2820.129
107 Ivory Coast4.6710.5410.8720.0800.4670.1460.103
108 Ghana4.6570.5920.8960.3370.4990.2120.029
109 Senegal4.6310.4291.1170.4330.4060.1380.082
110 Laos4.6230.7201.0340.4410.6260.2300.174
111 Tunisia4.5920.9000.9060.6900.2710.0400.063
112 Albania4.5860.9160.8170.7900.4190.1490.032
113 Sierra Leone4.5710.2560.8130.0000.3550.2380.053
114 Congo (Brazzaville)4.5590.6820.8110.3430.5140.0910.077
115 Bangladesh4.5000.5320.8500.5790.5800.1530.144
116 Sri Lanka4.4710.9181.3140.6720.5850.3070.050
117 Iraq4.4561.0100.9710.5360.3040.1480.095
118 Mali4.4470.3701.2330.1520.3670.1390.056
119 Namibia4.4410.8741.2810.3650.5190.0510.064
120 Cambodia4.4330.5491.0880.4570.6960.2560.065
121 Burkina Faso4.4240.3141.0970.2540.3120.1750.128
122 Egypt4.4190.8851.0250.5530.3120.0920.107
123 Mozambique4.4170.1980.9020.1730.5310.2060.158
124 Kenya4.4100.4931.0480.4540.5040.3520.055
125 Zambia4.3770.5621.0470.2950.5030.2210.082
126 Mauritania4.3560.5571.2450.2920.1290.1340.093
127 Ethiopia4.3500.3080.9500.3910.4520.2200.146
128 Georgia4.3400.8530.5920.6430.3750.0380.215
129 Armenia4.3210.8160.9900.6660.2600.0770.028
130 Myanmar4.3080.6821.1740.4290.5800.5980.178
131 Chad4.3010.3580.9070.0530.1890.1810.060
132 Congo (Kinshasa)4.2450.0691.1360.2040.3120.1970.052
133 India4.1900.7210.7470.4850.5390.1720.093
134 Niger4.1660.1310.8670.2210.3900.1750.099
135 Uganda4.1610.3221.0900.2370.4500.2590.061
136 Benin4.1410.3780.3720.2400.4400.1630.067
137 Sudan4.1390.6051.2400.3120.0160.1340.082
138 Ukraine4.1030.7931.4130.6090.1630.1870.011
139 Togo3.9990.2590.4740.2530.4340.1580.101
140 Guinea3.9640.3440.7920.2110.3940.1850.094
141 Lesotho3.8080.4721.2150.0790.4230.1160.112
142 Angola3.7950.7301.1250.2690.0000.0790.061
143 Madagascar3.7740.2620.9080.4020.2210.1550.049
144 Zimbabwe3.6920.3571.0940.2480.4060.1320.099
145 Afghanistan3.6320.3320.5370.2550.0850.1910.036
146 Botswana3.5901.0171.1740.4170.5570.0420.092
147 Malawi3.5870.1860.5410.3060.5310.2100.080
148 Haiti3.5820.3150.7140.2890.0250.3920.104
149 Liberia3.4950.0760.8580.2670.4190.2060.030
150 Syria3.4620.6890.3820.5390.0880.3760.144
151 Rwanda3.4080.3320.8960.4000.6360.2000.444
152 Yemen3.3550.4421.0730.3430.2440.0830.064
153 Tanzania3.3030.4550.9910.3810.4810.2700.097
154 South Sudan3.2540.3370.6080.1770.1120.2240.106
155 Central African Republic3.0830.0240.0000.0100.3050.2180.038
156 Burundi2.9050.0910.6270.1450.0650.1490.076

отчет за 2017 год

[ редактировать ]

В отчете за 2017 год представлен средний показатель счастья за 2014–2016 годы. За это время Норвегия была в целом «самой счастливой» страной в мире, хотя цены на нефть упали. Следом за ними шли Дания, Исландия и Швейцария. Четыре из пяти ведущих стран следуют скандинавской модели . Все десять стран, входящих в первую десятку, имели высокие баллы в шести категориях. Следующими странами в первой десятке рейтинга являются Финляндия, Нидерланды, Канада, Новая Зеландия, Австралия и Швеция.

Стол

Table of data for 2017:[58]

Overall RankChange in rankCountryScoreChange in scoreGDP per capitaSocial supportHealthy life expectancyFreedom to make life choicesGenerosityTrustResidual
1Increase 3 Norway7.537Increase 0.0391.6161.5340.7970.6350.3620.3162.277
2Decrease 1 Denmark7.522Decrease 0.0041.4821.5510.7930.6260.3550.4012.314
3Steady Iceland7.504Increase 0.0031.4811.6110.8340.6270.4760.1542.323
4Decrease 2  Switzerland7.494Decrease 0.0151.5651.5170.8580.6200.2910.3672.277
5Steady Finland7.469Increase 0.0561.4441.5400.8090.6180.2450.3832.430
6Increase 1 Netherlands7.377Increase 0.0381.5041.4290.8110.5850.4700.2832.295
7Decrease 1 Canada7.316Decrease 0.0881.4791.4810.8350.6110.4360.2872.187
8Steady New Zealand7.314Decrease 0.0201.4061.5480.8170.6140.5000.3832.046
9Steady Australia7.284Decrease 0.0291.4841.5100.8440.6020.4780.3012.065
10Steady Sweden7.284Decrease 0.0071.4941.4780.8310.6130.3850.3842.098
11Steady Israel7.213Decrease 0.0541.3751.3760.8380.4060.3300.0852.802
12Increase 2 Costa Rica7.079Decrease 0.0081.1101.4160.7600.5800.2150.1002.899
13Decrease 1 Austria7.006Decrease 0.1131.4871.4600.8150.5680.3160.2212.139
14Decrease 1 United States6.993Decrease 0.1111.5461.4200.7740.5060.3930.1362.218
15Increase 4 Ireland6.977Increase 0.0701.5361.5580.8100.5730.4280.2981.774
16Steady Germany6.951Decrease 0.0431.4881.4730.7990.5630.3360.2772.016
17Increase 1 Belgium6.891Decrease 0.0381.4641.4620.8180.5400.2320.2512.124
18Increase 2 Luxembourg6.863Decrease 0.0081.7421.4580.8450.5970.2830.3191.620
19Increase 4 United Kingdom6.714Decrease 0.0111.4421.4960.8050.5080.4930.2651.704
20Increase 4 Chile6.652Decrease 0.0531.2531.2840.8190.3770.3270.0822.510
21Increase 7 United Arab Emirates6.648Increase 0.0751.6261.2660.7270.6080.3610.3241.735
22Decrease 5 Brazil6.635Decrease 0.3171.1071.4310.6170.4370.1620.1112.769
23Increase 4 Czech Republic6.609Increase 0.0131.3531.4340.7540.4910.0880.0372.452
24Increase 2 Argentina6.599Decrease 0.0511.1851.4400.6950.4950.1090.0602.614
25Decrease 4 Mexico6.578Decrease 0.2001.1531.2110.7100.4130.1210.1332.837
26Decrease 4 Singapore6.572Decrease 0.1671.6921.3540.9490.5500.3460.4641.216
27Increase 3 Malta6.527Increase 0.0391.3431.4880.8220.5890.5750.1531.557
28Increase 1 Uruguay6.454Decrease 0.0911.2181.4120.7190.5790.1750.1782.172
29Increase 10 Guatemala6.454Increase 0.1300.8721.2560.5400.5310.2830.0772.894
30Decrease 5 Panama6.452Decrease 0.2491.2341.3730.7060.5500.2110.0712.307
31Increase 1 France6.442Decrease 0.0361.4311.3880.8440.4700.1300.1732.006
32Increase 1 Thailand6.424Decrease 0.0501.1281.4260.6470.5800.5720.0322.040
33Increase 2 Taiwan6.422Increase 0.0431.4341.3850.7940.3610.2580.0642.127
34Increase 3 Spain6.403Increase 0.0421.3841.5320.8890.4090.1900.0711.928
35Increase 1 Qatar6.375Steady1.8711.2740.7100.6040.3300.4391.145
36Decrease 5 Colombia6.357Decrease 0.1241.0711.4020.5950.4770.1490.0472.616
37Decrease 3 Saudi Arabia6.344Decrease 0.0351.5311.2870.5900.4500.1480.2732.065
38Increase 5 Trinidad and Tobago6.168Steady1.3611.3800.5200.5190.3250.0092.053
39Increase 2 Kuwait6.105Decrease 0.1341.6331.2600.6320.4960.2280.2151.640
40Increase 5 Slovakia6.098Increase 0.0201.3251.5050.7130.2960.1370.0242.098
41Increase 1 Bahrain6.087Decrease 0.1311.4881.3230.6530.5370.1730.2571.656
42Increase 5 Malaysia6.084Increase 0.0791.2911.2850.6190.4020.4170.0662.004
 Europe[a]6.080N/AN/AN/AN/AN/AN/AN/AN/A
43Increase 5 Nicaragua6.071Increase 0.0790.7371.2870.6530.4480.3020.1312.514
44Increase 7 Ecuador6.008Increase 0.0321.0011.2860.6860.4550.1500.1402.290
45Increase 1 El Salvador6.003Decrease 0.0650.9101.1820.5960.4320.0780.0902.715
46Increase 11 Poland5.973Increase 0.1381.2921.4460.6990.5200.1580.0591.798
47Increase 2 Uzbekistan5.971Decrease 0.0160.7861.5490.4980.6580.4160.2471.817
48Increase 2 Italy5.964Decrease 0.0131.3951.4450.8530.2560.1730.0281.813
49Increase 7 Russia5.963Increase 0.1071.2821.4690.5470.3740.0520.0332.206
50Increase 2 Belize5.956Steady0.9081.0810.4500.5480.2400.0972.632
51Increase 2 Japan5.920Decrease 0.0011.4171.4360.9130.5060.1210.1641.363
52Increase 8 Lithuania5.902Increase 0.0891.3151.4740.6290.2340.0100.0122.228
53Decrease 15 Algeria5.872Decrease 0.4831.0921.1460.6180.2330.0690.1462.568
54Increase 14 Latvia5.850Increase 0.2901.2611.4050.6390.3260.1530.0741.994
55Steady Moldova5.838Decrease 0.0590.7291.2520.5890.2410.2090.0102.808
56Increase 2 South Korea5.838Increase 0.0031.4021.1280.9000.2580.2070.0631.880
57Increase 14 Romania5.825Increase 0.2971.2181.1500.6850.4570.1340.0042.177
58Increase 1 Bolivia5.823Increase 0.0010.8341.2280.4740.5590.2260.0602.443
59Increase 6 Turkmenistan5.822Increase 0.1641.1311.4930.4380.4180.2500.2591.833
60Decrease 6 Kazakhstan5.819Decrease 0.1001.2851.3840.6060.4370.2020.1191.785
61Increase 1 North Cyprus5.810Increase 0.0391.3471.1860.8350.4710.2670.1551.549
62Increase 1 Slovenia5.758Decrease 0.0101.3411.4530.7910.5730.2430.0451.313
63Increase 1 Peru5.715Decrease 0.0281.0351.2190.6300.4500.1270.0472.207
64Increase 2 Mauritius5.629Decrease 0.0191.1891.2100.6380.4910.3610.0421.698
65Increase 4 Cyprus5.621Increase 0.0751.3561.1310.8450.3550.2710.0411.621
66Increase 6 Estonia5.611Increase 0.0941.3211.4770.6950.4790.0990.1831.358
67Decrease 6 Belarus5.569Decrease 0.2331.1571.4450.6380.2950.1550.1561.723
68Decrease 1 Libya5.525Decrease 0.0901.1021.3580.5200.4660.1520.0931.835
69Increase 9 Turkey5.500Increase 0.1111.1981.3380.6380.3010.0470.1001.879
70Steady Paraguay5.493Decrease 0.0450.9331.5070.5790.4740.2240.0911.685
71Increase 4 Hong Kong5.472Increase 0.0141.5521.2630.9430.4910.3740.2940.555
72Increase 10 Philippines5.430Increase 0.1510.8581.2540.4680.5850.1940.0991.973
73Increase 13 Serbia5.395Increase 0.2181.0691.2580.6510.2090.2200.0411.947
74Increase 6 Jordan5.336Increase 0.0330.9911.2390.6050.4180.1720.1201.791
75Increase 16 Hungary5.324Increase 0.1791.2861.3430.6880.1760.0780.0371.716
76Decrease 3 Jamaica5.311Decrease 0.1990.9261.3680.6410.4740.2340.0551.612
World5.305[b]N/AN/AN/AN/AN/AN/AN/AN/A
77Decrease 3 Croatia5.293Decrease 0.1951.2230.9680.7010.2560.2480.0431.854
78Decrease 1 Kosovo5.279Decrease 0.1220.9511.1380.5410.2600.3200.0572.011
79Increase 4 China5.273Increase 0.0281.0811.1610.7410.4730.0290.0231.765
80Increase 12 Pakistan5.269Increase 0.1370.7270.6730.4020.2350.3150.1242.792
81Decrease 2 Indonesia5.262Decrease 0.0520.9961.2740.4920.4430.6120.0151.429
82Decrease 38 Venezuela5.250Decrease 0.8341.1281.4310.6170.1540.0650.0641.789
83Increase 5 Montenegro5.237Increase 0.0761.1211.2380.6670.1950.1980.0881.729
84Increase 6 Morocco5.235Increase 0.0840.8780.7750.5980.4080.0320.0882.456
85Decrease 4 Azerbaijan7.342Decrease 0.0571.1541.1520.5410.3980.0450.1811.762
86Increase 3 Dominican Republic5.230Increase 0.0751.0791.4020.5750.5530.1870.1141.319
87Increase 12 Greece5.227Increase 0.1941.2891.2390.8100.0960.0000.0431.749
88Increase 5 Lebanon5.225Increase 0.0961.0751.1300.7350.2890.2640.0381.695
89Increase 5 Portugal5.195Increase 0.0721.3151.3670.7960.4980.0950.0161.108
90Decrease 3 Bosnia and Herzegovina5.182Increase 0.0190.9821.0690.7050.2040.3290.0001.892
91Increase 13 Honduras5.181Increase 0.3100.7311.1440.5830.3480.2360.0732.066
92Increase 3 Macedonia5.175Increase 0.0541.0651.2080.6450.3260.2540.0601.617
93Decrease 17 Somalia5.151Decrease 0.2890.0230.7210.1140.6020.2920.2823.117
94Increase 2 Vietnam5.074Increase 0.0130.7891.2770.6520.5710.2350.0881.462
95Increase 8 Nigeria5.074Increase 0.1990.7841.2160.0570.3950.2310.0262.365
96Increase 4 Tajikistan5.041Increase 0.0450.5251.2710.5290.4720.2490.1461.849
97Decrease 13 Bhutan5.011Decrease 0.1850.8851.3400.4960.5020.4740.1731.140
98Decrease 13 Kyrgyzstan5.004Decrease 0.1810.5961.3940.5530.4550.4290.0391.537
99Increase 8   Nepal4.962Increase 0.1690.4801.1790.5040.4400.3940.0731.891
100Increase 1 Mongolia4.955Increase 0.0481.0271.4930.5580.3940.3380.0331.111
101Increase 15 South Africa4.829Increase 0.3701.0551.3850.1870.4790.1390.0731.511
102Decrease 4 Tunisia4.805Decrease 0.2401.0070.8680.6130.2900.0500.0871.890
103Increase 5 Palestinian Territories4.775Increase 0.0210.7161.1560.5660.2550.1140.0891.879
104Increase 16 Egypt4.735Increase 0.3730.9900.9970.5200.2820.1290.1141.702
105Increase 24 Bulgaria4.714Increase 0.4971.1611.4340.7080.2890.1130.0110.996
106Increase 5 Sierra Leone4.709Increase 0.0740.3680.9840.0060.3190.2930.0712.668
107Increase 7 Cameroon4.695Increase 0.1820.5640.9460.1330.4300.2360.0512.334
108Decrease 3 Iran4.692Decrease 0.1211.1570.7120.6390.2490.3870.0491.499
109Steady Albania4.644Decrease 0.0110.9960.8040.7310.3810.2010.0401.490
110Steady Bangladesh4.608Decrease 0.0350.5870.7350.5330.4780.1720.1241.979
111Increase 2 Namibia4.574Steady0.9641.0980.3390.5200.0770.0931.482
112Increase 10 Kenya4.553Increase 0.1970.5601.0680.3100.4530.4450.0651.652
113N/A Mozambique4.550N/A0.2340.8710.1070.4810.3220.1792.356
114Increase 5 Myanmar4.545Increase 0.1500.3671.1230.3980.5140.8380.1891.115
115Increase 13 Senegal4.535Increase 0.3160.4791.1800.4090.3780.1830.1151.790
116Decrease 10 Zambia4.514Decrease 0.2810.6361.0030.2580.4620.2500.0781.827
117Decrease 5 Iraq4.497Decrease 0.0781.1030.9790.5010.2890.2000.1071.319
118Increase 16 Gabon4.465Increase 0.3441.1981.1560.3570.3120.0440.0761.323
119Decrease 4 Ethiopia4.460Decrease 0.0480.3390.8650.3530.4090.3130.1652.016
120Decrease 3 Sri Lanka4.440Increase 0.0251.0101.2600.6250.5610.4910.0740.419
121Steady Armenia4.376Increase 0.0160.9011.0070.6380.1980.0830.0271.521
122Decrease 4 India4.315Decrease 0.0890.7920.7540.4550.4700.2320.0921.519
123Increase 7 Mauritania4.292Increase 0.0910.6481.2720.2850.0960.2020.1371.652
124Increase 1 Congo (Brazzaville)4.291Increase 0.0190.8090.8320.2900.4350.1210.0801.724
125Increase 1 Georgia4.286Increase 0.0340.9510.5710.6500.3090.0540.2521.500
126Increase 1 Congo (Kinshasa)4.280Increase 0.0440.0921.2290.1910.2360.2460.0602.225
127Increase 8 Mali4.190Increase 0.1170.4761.2810.1690.3070.1830.1051.668
128Increase 11 Ivory Coast4.180Increase 0.2640.6030.9050.0490.4480.2010.1301.845
129Increase 11 Cambodia4.168Increase 0.2610.6021.0060.4300.6330.3860.0681.043
130Increase 3 Sudan4.139Steady0.6601.2140.2910.0150.1820.0901.687
131Decrease 7 Ghana4.120Decrease 0.1560.6670.8740.2960.4230.2570.0251.578
132Decrease 9 Ukraine4.096Decrease 0.2280.8951.3950.5760.1230.2700.0230.814
133Increase 13 Uganda4.081Increase 0.3420.3811.1300.2180.4430.3260.0571.526
134Increase 11 Burkina Faso4.032Increase 0.2930.3501.0430.2160.3240.2510.1201.727
135Increase 7 Niger4.028Increase 0.1720.1620.9930.2690.3640.2290.1391.874
136Decrease 4 Malawi3.970Decrease 0.1860.2330.5130.3150.4670.2870.0732.082
137Increase 7 Chad3.936Increase 0.1730.4380.9540.0410.1620.2160.0542.071
138Decrease 7 Zimbabwe3.875Decrease 0.3180.3761.0830.1970.3360.1890.0951.598
139N/A Lesotho3.808N/A0.5211.1900.0000.3910.1570.1191.430
140Increase 1 Angola3.795Decrease 0.0710.8581.1040.0500.0000.0980.0701.614
141Increase 13 Afghanistan3.794Increase 0.4340.4010.5820.1810.1060.3120.0612.151
142Decrease 5 Botswana3.766Decrease 0.2081.1221.2220.3420.5050.0990.0990.378
143Increase 10 Benin3.657Increase 0.1730.4310.4350.2100.4260.2080.0611.886
144Increase 4 Madagascar3.644Decrease 0.0510.3060.9130.3750.1890.2090.0671.585
145Decrease 9 Haiti3.603Decrease 0.4250.3690.6400.2770.0300.4890.1001.697
146Increase 1 Yemen3.593Decrease 0.1310.5920.9350.3100.2490.1040.0571.346
147Decrease 4 South Sudan3.591Decrease 0.2410.3970.6010.1630.1470.2860.1171.880
148Increase 2 Liberia3.533Decrease 0.0890.1190.8720.2300.3330.2670.0391.673
149Increase 2 Guinea3.507Decrease 0.1000.2450.7910.1940.3490.2650.1111.552
150Increase 5 Togo3.495Increase 0.1920.3050.4320.2470.3800.1970.0961.837
151Increase 1 Rwanda3.471Decrease 0.0440.3690.9460.3260.5820.2530.4550.540
152Increase 4 Syria3.462Increase 0.3930.7770.3960.5010.0820.4940.1511.062
153Decrease 4 Tanzania3.349Decrease 0.3170.5111.0420.3650.3900.3540.0660.621
154Increase 3 Burundi2.905Steady0.0920.6300.1520.0600.2040.0841.683
155N/A Central African Republic2.693N/A0.0000.0000.0190.2710.2810.0572.066

отчет за 2016 год

[ редактировать ]

В отчете за 2016 год представлены средние показатели счастья за 2013–2015 годы.

Стол

Legend:[59]

  Explained by: GDP per capita
  Explained by: Social support
  Explained by: Healthy life expectancy
  Explained by: Freedom to make life choices
  Explained by: Generosity
  Trust or absence of corruption, as explained by the publicly perceived absence of corruption in government and business[60]

Italics: States with limited recognition and disputed territories

Overall Rank
[61][62]
CountryScoreChange Over
Prior Year
GDP per capitaSocial supportHealthy life expectancyFreedom to make life choicesGenerosityTrust
1 Denmark7.526Decrease -0.401
2 Switzerland7.509Increase 0.035
3 Iceland7.501Steady 0.000
4 Norway7.498Increase 0.082
5 Finland7.413Decrease -0.259
6 Canada7.404Decrease -0.041
7 Netherlands7.339Decrease -0.119
8 New Zealand7.334Decrease -0.097
9 Australia7.313Increase 0.002
10 Sweden7.291Decrease -0.017
11 Israel7.267Increase 0.258
12 Austria7.119Decrease -0.003
13 United States7.104Decrease -0.261
14 Costa Rica7.087Decrease -0.171
15 Puerto Rico7.039Increase 0.446
16 Germany6.994Increase 0.486
17 Brazil6.952Increase 0.474
18 Belgium6.929Decrease -0.311
19 Ireland6.907Decrease -0.238
20 Luxembourg6.871Steady 0.000
21 Mexico6.778Increase 0.225
22 Singapore6.739Increase 0.099
23 United Kingdom6.725Decrease -0.161
24 Chile6.705Increase 0.826
25 Panama6.701Increase 0.191
26 Argentina6.650Increase 0.457
27 Czech Republic6.596Increase 0.126
28 United Arab Emirates6.573Decrease -0.161
29 Uruguay6.545Increase 0.804
30 Malta6.488Steady 0.000
31 Colombia6.481Increase 0.399
32 France6.478Decrease -0.336
33 Thailand6.474Increase 0.631
34 Saudi Arabia6.379Decrease -0.794
35 Taiwan6.379Increase 0.190
36 Qatar6.375Steady 0.000
37 Spain6.361Decrease -0.711
38 Algeria6.355Steady 0.000
39 Guatemala6.324Increase 0.211
40 Suriname6.269Steady 0.000
41 Kuwait6.239Increase 0.164
42 Bahrain6.218Steady 0.000
43 Trinidad and Tobago6.168Increase 0.336
44 Venezuela6.084Decrease -0.762
45 Slovakia6.078Increase 0.814
46 El Salvador6.068Increase 0.572
47 Malaysia6.005Decrease -0.132
48 Nicaragua5.992Increase 1.285
49 Uzbekistan5.987Increase 0.755
50 Italy5.977Decrease -0.735
51 Ecuador5.976Increase 0.966
52 Belize5.956Decrease -0.495
53 Japan5.921Decrease -0.446
54 Kazakhstan5.919Increase 0.322
55 Moldova5.897Increase 0.959
56 Russia5.856Increase 0.738
57 Poland5.835Increase 0.098
58 South Korea5.835Increase 0.295
59 Bolivia5.822Increase 0.322
60 Lithuania5.813Decrease -0.069
61 Belarus5.802Increase 0.165
62 Northern Cyprus5.771Steady 0.000
63 Slovenia5.768Decrease -0.044
64 Peru5.743Increase 0.730
65 Turkmenistan5.658Steady 0.000
66 Mauritius5.648Steady 0.000
67 Libya5.615Steady 0.000
68 Latvia5.560Increase 0.872
69 Cyprus5.546Decrease -0.692
70 Paraguay5.538Increase 0.536
71 Romania5.528Increase 0.310
72 Estonia5.517Increase 0.165
73 Jamaica5.510Decrease -0.698
74 Croatia5.488Decrease -0.333
75 Hong Kong5.458Decrease -0.053
76 Somalia5.440Steady 0.000
77Kosovo Kosovo5.401Increase 0.298
78 Turkey5.389Increase 0.216
79 Indonesia5.314Increase 0.295
80 Jordan5.303Decrease -0.638
81 Azerbaijan5.291Increase 0.642
82 Philippines5.279Increase 0.425
83 People's Republic of China5.245Increase 0.525
84 Bhutan5.196Steady 0.000
85 Kyrgyzstan5.185Increase 0.515
86 Serbia5.177Increase 0.426
87 Bosnia and Herzegovina5.163Increase 0.263
88 Montenegro5.161Decrease -0.035
89 Dominican Republic5.155Increase 0.070
90 Morocco5.151Steady 0.000
91 Hungary5.145Increase 0.070
92 Pakistan5.132Decrease -0.374
93 Lebanon5.129Increase 0.059
94 Portugal5.123Decrease -0.282
95 North Macedonia5.121Increase 0.627
96 Vietnam5.061Decrease -0.299
97Somaliland Somaliland region5.057Steady 0.000
98 Tunisia5.045Steady 0.000
99 Greece5.033Decrease -1.294
100 Tajikistan4.996Increase 0.474
101 Mongolia4.907Increase 0.298
102 Laos4.876Decrease -0.344
103 Nigeria4.875Increase 0.075
104 Honduras4.871Decrease -0.375
105 Iran4.813Decrease -0.507
106 Zambia4.795Increase 0.381
107 Nepal4.793Increase 0.135
108State of Palestine Palestinian Territories[63]4.754Increase 0.321
109 Albania4.655Increase 0.021
110 Bangladesh4.643Increase 0.170
111 Sierra Leone4.635Increase 1.028
112 Iraq4.575Steady 0.000
113 Namibia4.574Decrease -0.312
114 Cameroon4.513Increase 0.413
115 Ethiopia4.508Steady 0.000
116 South Africa4.459Decrease -0.686
117 Sri Lanka4.415Increase 0.037
118 India4.404Decrease -0.750
119 Myanmar4.395Steady 0.000
120 Egypt4.362Decrease -0.996
121 Armenia4.360Decrease -0.226
122 Kenya4.356Decrease -0.044
123 Ukraine4.324Decrease -0.701
124 Ghana4.276Decrease -0.600
125 Republic of the Congo4.272Steady 0.000
126 Georgia4.252Increase 0.561
127 Democratic Republic of the Congo4.236Steady 0.000
128 Senegal4.219Decrease -0.328
129 Bulgaria4.217Increase 0.373
130 Mauritania4.201Increase 0.052
131 Zimbabwe4.193Increase 0.639
132 Malawi4.156Decrease -0.205
133 Sudan4.139Steady 0.000
134 Gabon4.121Steady 0.000
135 Mali4.073Increase 0.059
136 Haiti4.028Increase 0.274
137 Botswana3.974Decrease -0.765
138 Comoros3.956Steady 0.000
139 Ivory Coast3.916Steady 0.000
140 Cambodia3.907Increase 0.045
141 Angola3.866Steady 0.000
142 Niger3.856Decrease -0.144
143 South Sudan3.832Steady 0.000
144 Chad3.763Decrease -0.025
145 Burkina Faso3.739Decrease -0.170
146 Uganda3.739Decrease -0.356
147 Yemen3.724Decrease -0.754
148 Madagascar3.695Decrease -0.285
149 Tanzania3.666Decrease -0.460
150 Liberia3.622Decrease -0.080
151 Guinea3.607Steady 0.000
152 Rwanda3.515Decrease -0.700
153 Benin3.484Increase 0.154
154 Afghanistan3.360Steady 0.000
155 Togo3.303Increase 0.100
156 Syria3.069Steady 0.000
157 Burundi2.905Steady 0.000

отчет за 2013 год

[ редактировать ]

В отчете за 2013 год представлены средние показатели счастья за 2010–2012 годы.

Стол
Rank[64]CountryHappiness
1 Denmark7.693
2 Norway7.655
3  Switzerland7.650
4 Netherlands7.512
5 Sweden7.480
6 Canada7.477
7 Finland7.389
8 Austria7.369
9 Iceland7.355
10 Australia7.350
11 Israel7.301
12 Costa Rica7.257
13 New Zealand7.221
14 United Arab Emirates7.144
15 Panama7.143
16 Mexico7.088
17 United States7.082
18 Ireland7.076
19 Luxembourg7.054
20 Venezuela7.039
21 Belgium6.967
22 United Kingdom6.883
23 Oman6.853
24 Brazil6.849
25 France6.764
26 Germany6.672
27 Qatar6.666
28 Chile6.587
29 Argentina6.562
30 Singapore6.546
31 Trinidad and Tobago6.519
32 Kuwait6.515
33 Saudi Arabia6.480
34 Cyprus6.466
35 Colombia6.416
36 Thailand6.371
37 Uruguay6.355
38 Spain6.322
39 Czech Republic6.290
40 Suriname6.269
41 South Korea6.267
42 Taiwan6.221
43 Japan6.064
44 Slovenia6.060
45 Italy6.021
46 Slovakia5.969
47 Guatemala5.965
48 Malta5.964
49 Ecuador5.865
50 Bolivia5.857
51 Poland5.822
52 El Salvador5.809
53 Moldova5.791
54 Paraguay5.779
55 Peru5.776
56 Malaysia5.760
57 Kazakhstan5.671
58 Croatia5.661
59 Turkmenistan5.628
60 Uzbekistan5.623
61 Angola5.589
62 Albania5.550
63 Vietnam5.533
64 Hong Kong5.523
65 Nicaragua5.507
66 Belarus5.504
67 Mauritius5.477
68 Russia5.464
69 North Cyprus5.463
70 Greece5.435
71 Lithuania5.426
72 Estonia5.426
73 Algeria5.422
74 Jordan5.414
75 Jamaica5.374
76 Indonesia5.348
77 Turkey5.345
78 Libya5.340
79 Bahrain5.312
80 Montenegro5.299
81 Pakistan5.292
82 Nigeria5.248
83 Kosovo5.222
84 Honduras5.142
85 Portugal5.101

Критики указали на разницу между оценками и опытом благополучия. [65] [66] Например, Колумбия заняла 37-е место в рейтинге World Happiness Report за 2018 год, но первое место по ежедневному эмоциональному опыту в . Индексе положительного опыта Gallup [67] Также были отмечены несоответствия в результатах различных опросов по измерению счастья: например, в опросе Pew, проведенном среди 43 стран в 2014 году (без учета большей части Европы), Мексика, Израиль и Венесуэла заняли первое, второе и третье места. [68] Другие отмечают, что интересующие переменные, используемые в «Докладе о мировом счастье», больше подходят для измерения счастья на национальном, а не на индивидуальном уровне. [69]

Методология

[ редактировать ]

Использование в «Докладе о мировом счастье» одного показателя субъективного благополучия принципиально отличается от более традиционных подходов к индексам, в которых используется ряд показателей, таких как Объединенных Наций Организации Индекс человеческого развития , Индекс лучшей жизни ОЭСР 2011 года или Индекс лучшего качества жизни ОЭСР 2011 года. Индекс социального прогресса 2013 года. Также продолжаются дебаты относительно однопунктовых и многопунктовых шкал как меры удовлетворенности жизнью. [70]

Идея о том, что субъективное благополучие можно отразить с помощью опроса, также оспаривается экономистами, которые установили, что на оценку людьми своего счастья может влиять, например, то, как система образования их страны оценивает экзамены, и что вопросы опроса о на субъективное благополучие влияют стили реагирования. [71]

Легитимность

[ редактировать ]

В 2014 году британский журналист Майкл Бут поставил под сомнение легитимность рейтингов свободы и счастья скандинавских стран в своей книге «Почти почти идеальные люди» . В нем он критикует Дании на воздействие окружающую среду и отмечает, что налоги и уровень личного долга среди ее граждан являются самыми высокими в мире. [72] Он также пишет, что в Финляндии самым распространенным типом рецептурных лекарств являются нейролептики . Он также указывает на высокий уровень потребления алкоголя, убийств и самоубийств в стране. [73] Кроме того, он утверждает, что не считает датчан самым счастливым народом в мире, а вместо этого называет их «самыми удовлетворенными». [74]

См. также

[ редактировать ]

Примечания

[ редактировать ]
  1. ^ Оценка не включена в исходный отчет, но была получена путем сложения оценок Европы и последующего деления на среднее значение: 6,08044.
  2. ^ Оценка не включена в исходный отчет, но была получена путем сложения всех оценок и последующего деления на среднее значение: 5,3053935483871.
  1. ^ "ЧАСТО ЗАДАВАЕМЫЕ ВОПРОСЫ" . worldhappiness.report . Проверено 27 августа 2019 г.
  2. ^ Jump up to: а б "Дом" . worldhappiness.report .
  3. ^ Астор, Мэгги (14 марта 2018 г.). «Хотите быть счастливым? Попробуйте переехать в Финляндию» . Нью-Йорк Таймс . Проверено 14 марта 2018 г.
  4. ^ Пулелла, Филип (14 марта 2018 г.). «Финляндия — самая счастливая страна в мире, недовольство США растёт: доклад ООН» . Новости США и мировой отчет . Проверено 14 марта 2018 г.
  5. ^ «В печальный год Финляндия снова стала самой счастливой страной в мире» . Сеть решений для устойчивого развития. 19 марта 2021 г. Проверено 19 марта 2021 г.
  6. ^ Хантер, Марни (18 марта 2022 г.). «Самые счастливые страны мира на 2022 год» . CNN . Проверено 18 марта 2022 г.
  7. ^ Деб, Сопан (20 марта 2024 г.). «Во главе со своей молодежью США тонут в докладе о мировом счастье» . Нью-Йорк Таймс . Проверено 22 марта 2024 г.
  8. ^ «Новое издательское партнерство для World Happiness Report» . worldhappiness.report . 12 февраля 2024 г. Проверено 10 мая 2024 г.
  9. ^ "О" . worldhappiness.report . Проверено 10 мая 2024 г.
  10. ^ «Счастье: к целостному подходу к развитию: резолюция / принятая Генеральной Ассамблеей» . Репозиторий ПДР ООН . Архивировано из оригинала 23 октября 2018 г. Проверено 17 октября 2017 г.
  11. ^ «Определение новой экономической парадигмы: отчет о совещании высокого уровня по вопросам благополучия и счастья» . Платформа знаний об устойчивом развитии .
  12. ^ Хелливелл, Джон; Лейард, Ричард; Сакс, Джеффри (2 апреля 2012 г.). «Отчет о мировом счастье» (PDF) . Институт Земли Колумбийского университета . Проверено 29 июня 2014 г. {{cite journal}}: Для цитирования журнала требуется |journal= ( помощь )
  13. ^ «Определение новой экономической парадигмы: отчет о совещании высокого уровня по вопросам благополучия и счастья» . Платформа знаний ООН в области устойчивого развития .
  14. ^ «Опрос GNH 2010» (PDF) . Центр исследований Бутана. Архивировано из оригинала (PDF) 18 марта 2013 года . Проверено 17 октября 2013 г.
  15. ^ Кю Ли (9 сентября 2013 г.). «Сеть решений для устойчивого развития | Отчет о мировом счастье за ​​2013 год» . unsdsn.org . Проверено 25 апреля 2014 г.
  16. ^ Jump up to: а б "ЧАСТО ЗАДАВАЕМЫЕ ВОПРОСЫ" . worldhappiness.report .
  17. ^ «Города и счастье: глобальный рейтинг и анализ» . 20 марта 2020 г.
  18. ^ «Понимание того, как Gallup использует шкалу Кантрила» . 24 августа 2009 г.
  19. ^ «Обзор: Жизнь в условиях COVID-19» .
  20. ^ «Жить долго и жить хорошо: подход WELLBY» .
  21. ^ «Доклад о мировом счастье: жить долго и хорошо» . 19 марта 2021 г.
  22. ^ «Счастье младших, старших и тех, кто посередине» . worldhappiness.report . Проверено 6 мая 2024 г.
  23. ^ «Методология: как работает мировой опрос Gallup?» . www.gallup.com . 14 октября 2014 г.
  24. ^ «Упс! Не удалось найти, или произошла ошибка» (PDF) . media.gallup.com .
  25. ^ «Доклад о мировом счастье 2024» .
  26. ^ «Мировое счастье, доверие и социальные связи во времена кризиса» .
  27. ^ «Самые счастливые страны демонстрируют устойчивость, несмотря на повторяющиеся кризисы» . worldhappiness.report . 20 марта 2023 года. Архивировано из оригинала 22 апреля 2023 года . Проверено 23 апреля 2023 г.
  28. ^ «Изучение биологической основы счастья». {{cite web}}: Отсутствует или пусто |url= ( помощь )
  29. ^ «Доклад о мировом счастье 2021» . worldhappiness.report . 20 марта 2021 г. Проверено 3 декабря 2021 г.
  30. ^ «В печальный год Финляндия снова стала самой счастливой страной в мире» . worldhappiness.report . Проверено 02 марта 2022 г.
  31. ^ «Доклад о мировом счастье 2020» . worldhappiness.report . 20 марта 2020 г. Проверено 3 декабря 2020 г.
  32. ^ «Это тройка лидеров, Финляндия сохраняет первое место как самая счастливая страна в мире» . worldhappiness.report . Проверено 3 декабря 2020 г.
  33. ^ Крамер, Мария (20 марта 2020 г.). «Улыбнитесь? Результаты Всемирного доклада о счастье за ​​2020 год уже готовы» . Нью-Йорк Таймс . Проверено 3 декабря 2020 г.
  34. ^ «Это самая счастливая страна в мире» . CNN Трэвел . 14 марта 2018 г. Проверено 14 марта 2018 г.
  35. ^ «Почему Счастье?» . Действия ради счастья .
  36. ^ «Экономический факультет – доктор Луиза Коррадо» . Кембриджский университет .
  37. ^ «Миланский университет Луки Станки, Милан · Кафедра экономики, менеджмента и количественных методов DEMM» . Исследовательские ворота .
  38. ^ «Лука Кривелли — Биография» . Университет Итальянской Швейцарии .
  39. ^ «Счастье: к целостному подходу к развитию: резолюция / принятая Генеральной Ассамблеей» . Архивировано из оригинала 23 октября 2018 г. Проверено 17 октября 2017 г.
  40. ^ «Определение новой экономической парадигмы: отчет о совещании высокого уровня по вопросам благополучия и счастья: Платформа знаний об устойчивом развитии» . Sustainabledevelopment.un.org .
  41. ^ «Отчет об исследовании GNH за 2015 год» . Центр исследований Бутана .
  42. ^ «Доктор Энн Хагелл» . Фонд Наффилда .
  43. ^ «Леонардо Беккетти, профессор» . Римский университет «Тор Вергата» .
  44. ^ «Руководство ОЭСР по измерению субъективного благополучия» . 20 марта 2013 г.
  45. ^ Наций, ООН. «Команда HDRO» – через hdr.undp.org.
  46. ^ «Определение новой экономической парадигмы: отчет о совещании высокого уровня по благополучию и счастью» . 2012.
  47. ^ «Шун Ван – доцент Школы государственной политики и управления Корейского института развития» . voxeu.org/ .
  48. ^ «База данных WVS» . www.worldvaluessurvey.org .
  49. ^ «Биография персонала доктора Эндрю Кларка» . Центр экономической эффективности .
  50. ^ «Клавдия Сеник» . Экономика на службе общества .
  51. ^ «Карма Ура» . Королевский институт управления и стратегических исследований . Архивировано из оригинала 18 января 2017 г.
  52. ^ «Сабина Алкире» . Оксфордская инициатива по борьбе с бедностью и человеческому развитию .
  53. ^ «Благополучие» . Управление национальной статистики .
  54. ^ «Главная — Управление национальной статистики» . www.ons.gov.uk.
  55. ^ ОЭСР (20 марта 2013 г.). «Руководство ОЭСР по измерению субъективного благополучия» .
  56. ^ "ЧАСТО ЗАДАВАЕМЫЕ ВОПРОСЫ" . worldhappiness.report .
  57. ^ «Рисунок 2.1: Рейтинг стран по оценкам жизни в 2021–2023 гг.» (PDF) , World Happiness Report 2024 , стр. 15–17, 2024 г., ISBN  978-1-7348080-7-0 , получено 23 марта 2024 г.
  58. ^ Хелливелл, Дж.; Лейард, Р.; Сакс, Дж. (2017). Всемирный доклад о счастье 2017 . Нью-Йорк: Сеть решений для устойчивого развития. ISBN  978-0-9968513-5-0 . Архивировано из оригинала 9 октября 2017 г. Проверено 21 марта 2017 г.
  59. ^ «Обновление Доклада о мировом счастье за ​​2016 год» . Сеть ООН по поиску решений в области устойчивого развития; Институт Земли (Колумбийский университет). стр. 20–21–22. Архивировано из оригинала 17 марта 2016 года . Проверено 20 марта 2016 г.
  60. ^ «Глава 2: Распределение мирового счастья», Обновление «Доклада о мировом счастье за ​​2016 год» (PDF) , стр. 4, абз. 1, заархивировано из оригинала (PDF) 22 марта 2016 г. , получено 20 марта 2016 г.
  61. ^ «Загрузка отчета об обновлении за 2016 год» (PDF) . Архивировано из оригинала (PDF) 22 марта 2016 года . Проверено 20 марта 2016 г.
  62. ^ Загрузка таблицы за 2016 г. , Рисунок 2.2, заархивировано из оригинала (XLS) 23 марта 2016 г. , получено 20 марта 2016 г.
  63. ^ См. следующее о критериях государственности:
  64. ^ «Самые счастливые страны мира» . Евроньюс . 10 сентября 2013 года . Проверено 21 марта 2023 г.
  65. ^ Долан, Пол; и др. (20 августа 2016 г.). «Мера имеет значение: исследование оценочных и основанных на опыте показателей благополучия в данных об использовании времени» . Исследование социальных показателей . 134 (1): 57–73. дои : 10.1007/s11205-016-1429-8 . ПМЦ   5599459 . ПМИД   28983145 .
  66. ^ Кушлев, Костадин; и др. (9 января 2015 г.). «Более высокий доход связан с меньшим количеством ежедневной грусти, но не с большим ежедневным счастьем» . Социальная психология и наука о личности . 6 (5): 483–489. дои : 10.1177/1948550614568161 . S2CID   147042924 .
  67. ^ «Кто самые счастливые люди в мире?» . www.linkedin.com .
  68. ^ «Этот опрос о мировом счастье — полная чушь» . Нью-Йорк Пост . 22 марта 2017 г.
  69. ^ «Можно ли измерить счастье?» . www.dailytrust.com.ng . Архивировано из оригинала 10 апреля 2016 г.
  70. ^ Хелливелл, Джон Ф.; Баррингтон-Ли, Кристофер П. (2010). «Измерение и понимание субъективного благополучия» .
  71. ^ Маркес-Падилья, Фернанда; Альварес, Хорхе (2018). «Оценка счастья: что системы оценок говорят нам о сравнении благосостояния между странами» . Экономический вестник . 38 (2): 1138–1155.
  72. ^ Тернер, Олвин (9 февраля 2014 г.). «Почти почти идеальные люди: правда о скандинавском чуде», обзор Майкла Бута . «Дейли телеграф» . Проверено 9 августа 2014 г.
  73. ^ Фроструп, Мариэлла (10 февраля 2014 г.). «Почти идеальные люди: правда о скандинавском чуде Майкла Бута – обзор» . Хранитель . Проверено 9 августа 2014 г.
  74. ^ Суонсон, Ана (11 ноября 2015 г.). «Как мы вызвали гнев некоторых из самых совершенных людей в мире» . Вашингтон Пост .
[ редактировать ]
Arc.Ask3.Ru: конец переведенного документа.
Arc.Ask3.Ru
Номер скриншота №: 617094265f05009a604275fa5957a1dd__1721931540
URL1:https://arc.ask3.ru/arc/aa/61/dd/617094265f05009a604275fa5957a1dd.html
Заголовок, (Title) документа по адресу, URL1:
World Happiness Report - Wikipedia
Данный printscreen веб страницы (снимок веб страницы, скриншот веб страницы), визуально-программная копия документа расположенного по адресу URL1 и сохраненная в файл, имеет: квалифицированную, усовершенствованную (подтверждены: метки времени, валидность сертификата), открепленную ЭЦП (приложена к данному файлу), что может быть использовано для подтверждения содержания и факта существования документа в этот момент времени. Права на данный скриншот принадлежат администрации Ask3.ru, использование в качестве доказательства только с письменного разрешения правообладателя скриншота. Администрация Ask3.ru не несет ответственности за информацию размещенную на данном скриншоте. Права на прочие зарегистрированные элементы любого права, изображенные на снимках принадлежат их владельцам. Качество перевода предоставляется как есть. Любые претензии, иски не могут быть предъявлены. Если вы не согласны с любым пунктом перечисленным выше, вы не можете использовать данный сайт и информация размещенную на нем (сайте/странице), немедленно покиньте данный сайт. В случае нарушения любого пункта перечисленного выше, штраф 55! (Пятьдесят пять факториал, Денежную единицу (имеющую самостоятельную стоимость) можете выбрать самостоятельно, выплаичвается товарами в течение 7 дней с момента нарушения.)