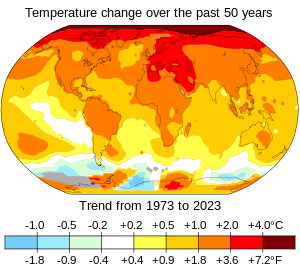
Изменение климата

В обычном понимании изменение климата описывает глобальное потепление – продолжающееся повышение глобальной средней температуры – и его влияние на климатическую систему Земли . Изменение климата в более широком смысле также включает предыдущие долгосрочные изменения климата Земли. Нынешний рост средней глобальной температуры вызван в первую очередь тем, что люди сжигают ископаемое топливо со времен промышленной революции . [3] [4] Использование ископаемого топлива , вырубка лесов и некоторые методы ведения сельского хозяйства и промышленности увеличивают выбросы парниковых газов . [5] Эти газы поглощают часть тепла , которое Земля излучает после того, как она нагревается от солнечного света , нагревая нижние слои атмосферы . Уровень углекислого газа , основного парникового газа, вызывающего глобальное потепление, увеличился примерно на 50% и находится на уровне, невиданном в течение миллионов лет. [6]
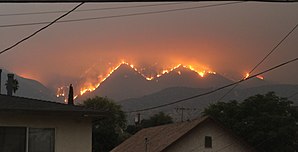
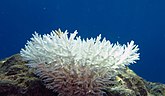
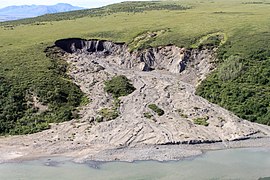
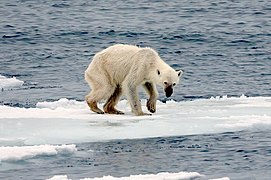
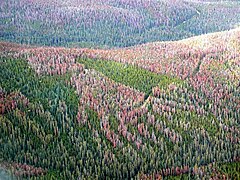
Изменение климата оказывает все более серьезное воздействие на окружающую среду . Пустыни расширяются , а жара и лесные пожары становятся все более распространенными. [7] [8] Усиление потепления в Арктике способствовало таянию вечной мерзлоты , отступлению ледников и сокращению морского льда . [9] Более высокие температуры также вызывают более сильные штормы , засухи и другие экстремальные погодные явления . [10] Быстрое изменение окружающей среды в горах , коралловых рифах и Арктике вынуждает многие виды перемещаться или вымирать . [11] Даже если усилия по минимизации будущего потепления окажутся успешными, некоторые последствия будут сохраняться в течение столетий. К ним относятся нагревание океана , закисление океана и повышение уровня моря . [12]
Изменение климата угрожает людям усилением наводнений , сильной жарой, увеличением нехватки продовольствия и воды , ростом заболеваемости и экономическими потерями . миграция людей и конфликты. Результатом также могут стать [13] Всемирная организация здравоохранения (ВОЗ) называет изменение климата одной из крупнейших угроз глобальному здоровью в 21 веке. [14] общества и экосистемы столкнутся с более серьезными рисками Без принятия мер по ограничению потепления . [15] Адаптация к изменению климата посредством таких мер, как меры по борьбе с наводнениями или выращивание устойчивых к засухе культур, частично снижает риски изменения климата, хотя некоторые пределы адаптации уже достигнуты. [16] [17] Бедные сообщества несут ответственность за небольшую долю глобальных выбросов , но при этом имеют наименьшую способность к адаптации и наиболее уязвимы к изменению климата . [18] [19]
![Дно высохшего озера в Калифорнии, которое переживает самую сильную засуху за последние 1200 лет.[20]](http://upload.wikimedia.org/wikipedia/commons/thumb/d/d3/California_Drought_Dry_Lakebed_2009.jpg/129px-California_Drought_Dry_Lakebed_2009.jpg)
В последние годы ощущались многочисленные последствия изменения климата: 2023 год стал самым теплым за всю историю наблюдений с температурой +1,48 °C (2,66 °F) с момента начала регулярного отслеживания в 1850 году. [21] [22] Дополнительное потепление усилит эти воздействия и может спровоцировать переломные моменты , такие как таяние всего ледникового щита Гренландии . [23] 2015 года В соответствии с Парижским соглашением страны коллективно согласились поддерживать потепление «значительно ниже 2 °C». Однако, несмотря на обязательства, взятые в рамках Соглашения, глобальное потепление все равно достигнет примерно 2,7 °C (4,9 °F) к концу столетия. [24] Ограничение потепления 1,5 °C потребует сокращения выбросов вдвое к 2030 году и достижения нулевых выбросов к 2050 году. [25] [26] [27] [28]
Использование ископаемого топлива может быть прекращено за счет экономии энергии и перехода на источники энергии, которые не производят значительного загрязнения углекислым газом. Эти источники энергии включают ветровую , солнечную , гидро- и ядерную энергию . [29] [30] Чисто вырабатываемая электроэнергия может заменить ископаемое топливо для обеспечения транспорта , отопления зданий и управления промышленными процессами. [31] Углерод также можно удалить из атмосферы , например, за счет увеличения лесного покрова и ведения сельского хозяйства с использованием методов улавливания углерода в почве . [32] [33]
Терминология
До 1980-х годов было неясно, был ли эффект потепления от увеличения выбросов парниковых газов сильнее, чем охлаждающий эффект переносимых по воздуху твердых частиц, содержащихся в загрязнении воздуха . Ученые использовали термин «непреднамеренное изменение климата» для обозначения воздействия человека на климат в то время. [34] В 1980-х годах термины « глобальное потепление» и «изменение климата» стали более распространенными и часто использовались как синонимы. [35] [36] [37] С научной точки зрения, глобальное потепление относится только к усилению приземного потепления, в то время как изменение климата Земли описывает как глобальное потепление, так и его воздействие на климатическую систему , например, изменение количества осадков. [34]
Изменение климата также можно использовать в более широком смысле, включая изменения климата , которые происходили на протяжении всей истории Земли. [38] Глобальное потепление — использовался еще в 1975 году. [39] — стал более популярным термином после того, как НАСА ученый-климатолог Джеймс Хансен использовал его в своих показаниях в Сенате США в 1988 году . [40] С 2000-х годов изменения климата . использование таких технологий возросло из-за [41] Различные ученые, политики и средства массовой информации могут использовать термины «климатический кризис» или «климатическая чрезвычайная ситуация» , говоря об изменении климата, и могут использовать термин « глобальное потепление» вместо «глобальное потепление» . [42] [43]
Глобальное повышение температуры

Температурные рекорды до глобального потепления
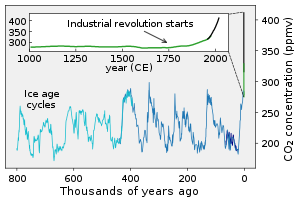
За последние несколько миллионов лет люди эволюционировали в климате, который циклически сменял ледниковые периоды , при этом средняя глобальная температура колебалась от 1 °C теплее до 5–6 °C холоднее нынешнего уровня. [46] [47] Одним из самых жарких периодов было последнее межледниковье между 115 000 и 130 000 лет назад, когда уровень моря был на 6–9 метров выше, чем сегодня. [48] Во время последнего ледникового максимума 20 000 лет назад уровень моря был примерно на 125 метров (410 футов) ниже, чем сегодня. [49]
В нынешнем межледниковом периоде, начавшемся 11 700 лет назад, температура стабилизировалась . [50] Исторические закономерности потепления и похолодания, такие как средневековый теплый период и малый ледниковый период , не происходили одновременно в разных регионах. В ограниченном наборе регионов температуры, возможно, достигли таких же высоких значений, как в конце 20-го века. [51] [52] Климатическая информация за этот период поступает от климатических индикаторов , таких как деревья и керны льда . [53] [54]
Потепление после промышленной революции

Около 1850 записей термометров начали охватывать весь мир. [57] В период с 18 века по 1970 год суммарное потепление было незначительным, поскольку воздействие выбросов парниковых газов на потепление компенсировалось охлаждением из-за выбросов диоксида серы . Диоксид серы вызывает кислотные дожди , но он также производит сульфатные в атмосфере аэрозоли, которые отражают солнечный свет и вызывают так называемое глобальное затемнение . После 1970 года растущее накопление парниковых газов и контроль над загрязнением серой привели к заметному повышению температуры. [58] [59] [60]
Продолжающиеся изменения климата не имели прецедентов на протяжении нескольких тысяч лет. [61] Множество независимых наборов данных показывают повышение температуры поверхности во всем мире. [62] со скоростью около 0,2 °C за десятилетие. [63] За десятилетие 2013–2022 гг. потепление составило в среднем 1,15 °C [1,00–1,25 °C] по сравнению с базовым доиндустриальным периодом (1850–1900 гг.). [64] Не каждый год был теплее предыдущего: внутренние процессы изменчивости климата могут сделать любой год на 0,2 °C теплее или холоднее среднего показателя. [65] С 1998 по 2013 год наблюдались негативные фазы двух таких процессов — Тихоокеанского десятилетнего колебания (PDO). [66] и Атлантическое многодесятилетнее колебание (АМО) [67] вызвало так называемый « перерыв в глобальном потеплении ». [68] После перерыва произошло обратное: в такие годы, как 2023 год, температура была значительно выше даже недавнего среднего показателя. [69] Вот почему изменение температуры определяется как среднее значение за 20 лет, что снижает шум жарких и холодных лет и десятилетних климатических моделей, а также обнаруживает долгосрочный сигнал. [70] : 5 [71]
Широкий спектр других наблюдений подтверждает доказательства потепления. [72] [73] Верхние слои атмосферы охлаждаются, поскольку парниковые газы удерживают тепло у поверхности Земли, и поэтому в космос излучается меньше тепла. [74] Потепление уменьшает средний снежный покров и приводит к отступлению ледников . В то же время потепление также вызывает большее испарение из океанов , что приводит к увеличению влажности воздуха и увеличению количества осадков . [75] [76] Растения весной цветут раньше, а тысячи видов животных постоянно переселяются в более прохладные районы. [77]
Различия по регионам
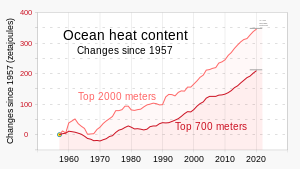
В разных регионах мира тепло происходит с разной скоростью . Картина не зависит от того, где выбрасываются парниковые газы, поскольку газы сохраняются достаточно долго, чтобы диффундировать по планете. Начиная с доиндустриального периода, средняя приземная температура над сушей увеличивалась почти в два раза быстрее, чем глобальная средняя приземная температура. [78] Это связано с тем, что океаны теряют больше тепла в результате испарения и могут хранить много тепла . [79] Тепловая энергия в глобальной климатической системе росла лишь с короткими паузами, по крайней мере, с 1970 года, и более 90% этой дополнительной энергии хранится в океане . [80] [81] Остальное нагрело атмосферу , растопило лед и согрело континенты. [82]
Северное полушарие и Северный полюс нагреваются гораздо быстрее, чем Южный полюс и Южное полушарие . В Северном полушарии не только гораздо больше суши, но и больше сезонного снежного покрова и морского льда . Поскольку после таяния льда эти поверхности перестают отражать много света и становятся темными, они начинают поглощать больше тепла . [83] Местные отложения черного углерода на снегу и льду также способствуют потеплению в Арктике. [84] Температура поверхности Арктики растет в три-четыре раза быстрее, чем в остальном мире. [85] [86] [87] Таяние ледниковых щитов вблизи полюсов ослабляет как атлантическое , так и антарктическое звено термохалинной циркуляции , что еще больше меняет распределение тепла и осадков по земному шару. [88] [89] [90] [91]
Будущие глобальные температуры

По оценкам Всемирной метеорологической организации, вероятность того, что глобальная температура превысит 1,5 °C потепления по сравнению с доиндустриальным базовым уровнем, составляет 66% в течение как минимум одного года между 2023 и 2027 годами. [94] [95] Поскольку МГЭИК использует среднее значение за 20 лет для определения глобальных изменений температуры, один год, превышающий 1,5 °C, не превышает предел.
МГЭИК ожидает, что в начале 2030-х годов средняя глобальная температура за 20 лет превысит +1,5 °C. [96] ( Шестой оценочный доклад МГЭИК 2023 г.) включал прогнозы о том, что к 2100 году глобальное потепление, скорее всего, достигнет 1,0–1,8 °C при сценарии с очень низкими выбросами парниковых газов , 2,1–3,5 °C при сценарии промежуточных выбросов , или 3,3–5,7 °C при сценарии очень высоких выбросов . [97] Потепление продолжится и после 2100 года в сценариях со средним и высоким уровнем выбросов. [98] [99] при этом будущие прогнозы глобальной приземной температуры к 2300 году будут такими же, как и миллионы лет назад. [100]
Оставшийся углеродный баланс , необходимый для того, чтобы оставаться ниже определенного повышения температуры, определяется путем моделирования углеродного цикла и чувствительности климата к парниковым газам. [101] По данным МГЭИК, глобальное потепление можно удержать на уровне ниже 1,5 °C с вероятностью в две трети, если выбросы после 2018 года не превысят 420 или 570 гигатонн CO 2 . Это соответствует 10–13 годам текущих выбросов. Существует большая неопределенность в отношении бюджета. Например, оно может быть на 100 гигатонн эквивалента CO 2 меньше из-за выбросов CO 2 и метана из вечной мерзлоты и водно-болотных угодий . [102] Однако очевидно, что ресурсы ископаемого топлива необходимо активно хранить в земле, чтобы предотвратить существенное потепление. В противном случае их нехватка не возникнет до тех пор, пока выбросы уже не окажут существенное долгосрочное воздействие. [103]
Причины недавнего повышения глобальной температуры

Климатическая система сама по себе испытывает различные циклы, которые могут длиться годами, десятилетиями или даже столетиями. Например, явления Эль-Ниньо вызывают кратковременные скачки приземной температуры, а явления Ла-Нинья вызывают кратковременное похолодание. [104] Их относительная частота может влиять на глобальные температурные тенденции в десятилетнем масштабе. [105] Другие изменения вызваны дисбалансом энергии от внешних воздействий . [106] Примеры этого включают изменения концентрации парниковых газов , солнечной светимости , извержения вулканов и изменения орбиты Земли вокруг Солнца . [107]
Чтобы определить вклад человека в изменение климата, разрабатываются уникальные «отпечатки пальцев» для всех потенциальных причин, которые сравниваются как с наблюдаемыми закономерностями, так и с известной внутренней изменчивостью климата . [108] Например, солнечное воздействие, отпечатком которого является нагревание всей атмосферы, исключено, поскольку нагрелись только нижние слои атмосферы. [109] Атмосферные аэрозоли оказывают меньший охлаждающий эффект. Другие факторы, такие как изменения альбедо , менее эффективны. [110]
Парниковые газы
Парниковые газы прозрачны для солнечного света и, таким образом, позволяют ему проходить через атмосферу и нагревать поверхность Земли. Земля излучает его в виде тепла , а парниковые газы поглощают его часть. Это поглощение замедляет скорость утечки тепла в космос, удерживая тепло у поверхности Земли и со временем нагревая его. [116]
Хотя водяной пар (≈50%) и облака (≈25%) вносят наибольший вклад в парниковый эффект, они в основном изменяются в зависимости от температуры и поэтому в основном считаются обратными связями , которые изменяют чувствительность климата . С другой стороны, концентрации таких газов, как CO 2 (≈20%), тропосферный озон , [117] ХФУ и закись азота добавляются или удаляются независимо от температуры и поэтому считаются внешними факторами, изменяющими глобальную температуру. [118]
До промышленной революции естественное количество парниковых газов приводило к тому, что воздух у поверхности был примерно на 33 °C теплее, чем он был бы в их отсутствие. [119] [120] Человеческая деятельность после промышленной революции, в основном добыча и сжигание ископаемого топлива ( уголь , нефть и природный газ ), [121] увеличило количество парниковых газов в атмосфере, что привело к радиационному дисбалансу . В 2019 году концентрации CO 2 и метана увеличились примерно на 48% и 160% соответственно с 1750 года. [122] Эти уровни CO 2 выше, чем когда-либо за последние 2 миллиона лет. Концентрации метана намного выше, чем они были за последние 800 000 лет. [123]

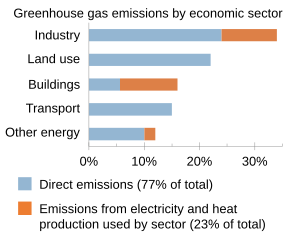
Глобальные антропогенные выбросы парниковых газов в 2019 году были эквивалентны 59 миллиардам тонн CO2 . Из этих выбросов 75% составили CO2 , 18% — метан , 4% — закись азота и 2% — фторированные газы . [124] Выбросы CO 2 в основном происходят в результате сжигания ископаемого топлива для обеспечения энергией транспорта , производства, отопления и электричества. [5] Дополнительные CO 2 выбросы происходят в результате вырубки лесов и промышленных процессов , в том числе CO 2, выделяемого в результате химических реакций при производстве цемента , стали , алюминия и удобрений . [125] [126] [127] [128] Выбросы метана происходят от животноводства , навоза, выращивания риса , свалок, сточных вод и добычи угля , а также добычи нефти и газа . [129] [130] Выбросы закиси азота в основном происходят в результате микробного разложения удобрений . [131] [132]
Хотя метан сохраняется в атмосфере в среднем 12 лет. [133] CO 2 сохраняется гораздо дольше. Поверхность Земли поглощает CO2 в рамках углеродного цикла . Хотя растения на суше и в океане поглощают большую часть избыточных выбросов CO 2 ежегодно , этот CO 2 возвращается в атмосферу при переваривании, сгорании или разложении биологического вещества. [134] на поверхности суши Процессы поглощения углерода , такие как фиксация углерода в почве и фотосинтез, удаляют около 29% годовых глобальных выбросов CO2 . [135] Океан поглотил от 20 до 30% выброшенного CO 2 за последние два десятилетия. [136] CO 2 удаляется из атмосферы только на длительный срок, когда он хранится в земной коре, и этот процесс может занять миллионы лет. [134]
Изменения поверхности суши

По данным Продовольственной и сельскохозяйственной организации , около 30% площади суши Земли в значительной степени непригодны для использования человеком ( ледники , пустыни и т. д.), 26% — леса , 10% — кустарники и 34% — сельскохозяйственные угодья . [138] Вырубка лесов является основным фактором изменения землепользования, способствующим глобальному потеплению. [139] поскольку разрушенные деревья выделяют CO 2 и не заменяются новыми деревьями, удаляя этот поглотитель углерода . [32] В период с 2001 по 2018 год 27% вырубки лесов произошло в результате постоянной вырубки, позволяющей расширить сельское хозяйство для выращивания сельскохозяйственных культур и животноводства. Еще 24% было потеряно из-за временных расчисток в рамках сменной сельскохозяйственной системы. 26% приходится на вырубку древесины и продуктов ее переработки, а на долю лесных пожаров приходится оставшиеся 23%. [140] Некоторые леса не были полностью вырублены, но уже подверглись деградации в результате этих воздействий. Восстановление этих лесов также восстанавливает их потенциал в качестве поглотителя углерода. [141]
Местный растительный покров влияет на то, сколько солнечного света отражается обратно в космос ( альбедо ) и сколько тепла теряется в результате испарения . Например, переход от темного леса к лугам делает поверхность светлее, заставляя ее отражать больше солнечного света. Вырубка лесов также может изменить выброс химических соединений, которые влияют на облака, а также изменить характер ветра. [142] В тропических и умеренных регионах конечным результатом будет значительное потепление, а восстановление лесов может привести к снижению местных температур. [141] На широтах ближе к полюсам наблюдается эффект охлаждения, поскольку лес заменяется заснеженными (и более отражающими свет) равнинами. [142] В глобальном масштабе это увеличение альбедо поверхности оказало доминирующее прямое влияние на температуру в результате изменения землепользования. Таким образом, изменение землепользования на сегодняшний день, по оценкам, будет иметь небольшой охлаждающий эффект. [143]
Другие факторы
Аэрозоли и облака
Загрязнение воздуха в виде аэрозолей влияние на климат . оказывает огромное [144] Аэрозоли рассеивают и поглощают солнечную радиацию. постепенное уменьшение количества солнечного света, достигающего поверхности Земли С 1961 по 1990 годы наблюдалось . Это явление широко известно как глобальное затемнение . [145] и в первую очередь связано с сульфатными аэрозолями, образующимися при сжигании ископаемого топлива с высокими концентрациями серы, такого как уголь и бункерное топливо . [60] Меньший вклад вносит черный углерод , органический углерод от сжигания ископаемого топлива и биотоплива, а также антропогенная пыль. [146] [59] [147] [148] [149] Во всем мире количество аэрозолей сокращается с 1990 года из-за контроля над загрязнением, а это означает, что они больше не маскируют в такой степени потепление парниковых газов. [150] [60]
Аэрозоли также оказывают косвенное воздействие на энергетический баланс Земли . Сульфатные аэрозоли действуют как ядра конденсации облаков и приводят к образованию облаков, в которых капель становится все больше и меньше. Эти облака отражают солнечную радиацию более эффективно, чем облака с меньшим количеством капель и более крупными. [151] Они также уменьшают рост капель дождя , что делает облака более отражающими падающий солнечный свет. [152] Косвенное воздействие аэрозолей представляет собой наибольшую неопределенность в радиационном воздействии . [153]
Хотя аэрозоли обычно ограничивают глобальное потепление, отражая солнечный свет, черный углерод в саже , падающей на снег или лед, может способствовать глобальному потеплению. Это не только увеличивает поглощение солнечного света, но также увеличивает таяние и повышение уровня моря. [154] Ограничение новых залежей черного углерода в Арктике может снизить глобальное потепление на 0,2 °C к 2050 году. [155] Эффект от снижения содержания серы в мазуте для судов с 2020 года [156] по оценкам, приведет к дополнительному повышению глобальной средней температуры на 0,05 °C к 2050 году. [157]
Солнечная и вулканическая активность

Поскольку Солнце является основным источником энергии Земли, изменения в поступающем солнечном свете напрямую влияют на климатическую систему . [153] Солнечное излучение измерялось непосредственно спутниками . [160] а косвенные измерения доступны с начала 1600-х годов. [153] С 1880 года не наблюдается тенденции к увеличению количества солнечной энергии, достигающей Земли, в отличие от потепления нижних слоев атмосферы ( тропосферы ). [161] Верхняя атмосфера ( стратосфера ) также нагревалась бы, если бы Солнце посылало на Землю больше энергии, но вместо этого она охлаждается. [109] Это согласуется с тем, что парниковые газы препятствуют выходу тепла из атмосферы Земли. [162]
Взрывные извержения вулканов могут выделять газы, пыль и пепел, которые частично блокируют солнечный свет и снижают температуру, или они могут выбрасывать в атмосферу водяной пар, который увеличивает количество парниковых газов и повышает температуру. [163] Такое воздействие на температуру длится всего несколько лет, поскольку водяной пар и вулканический материал имеют низкую стойкость в атмосфере. [164] вулканические CO 2 выбросы более устойчивы, но они эквивалентны менее чем 1% текущих выбросов CO 2, вызванных деятельностью человека . [165] Вулканическая активность по-прежнему представляет собой крупнейшее естественное воздействие (воздействие) на температуру в индустриальную эпоху. Тем не менее, как и другие природные факторы, оно оказало незначительное влияние на глобальные температурные тенденции со времен промышленной революции. [164]
Отзывы об изменении климата

Реакция климатической системы на первоначальное воздействие модифицируется обратными связями: увеличивается за счет «самоусиливающихся» или «положительных» обратных связей и снижается за счет «балансирующих» или «отрицательных» обратных связей . [167] Основными усиливающими обратными связями являются обратная связь водяного пара , обратная связь льда и альбедо и суммарный эффект облаков. [168] [169] Основным механизмом балансировки является радиационное охлаждение , поскольку поверхность Земли отдает больше тепла в космос в ответ на повышение температуры. [170] Помимо температурных обратных связей, в углеродном цикле существуют и обратные связи, такие как удобряющее воздействие CO 2 на рост растений. [171] Ожидается, что обратная связь будет иметь положительную тенденцию, поскольку выбросы парниковых газов продолжаются, что повышает чувствительность климата. [172]
Радиационная обратная связь — это физические процессы, которые влияют на скорость глобального потепления в ответ на потепление. Например, более теплый воздух может содержать больше влаги , а водяной пар сам по себе является мощным парниковым газом. [168] Более теплый воздух также может привести к тому, что облака станут выше и тоньше, выступая в качестве изолятора и согревая планету. [173] Другой важной обратной связью является уменьшение снежного покрова и морского льда в Арктике, что снижает отражательную способность земной поверхности и способствует усилению изменений температуры в Арктике . [174] [175] Усиление Арктики также приводит к таянию вечной мерзлоты метана и CO 2 . , что приводит к выбросу в атмосферу [176]
Около половины антропогенных выбросов CO2 поглощается наземными растениями и океанами. [177] Эта доля не является статичной, и если будущие выбросы CO 2 уменьшатся, Земля сможет поглотить примерно до 70%. Если они существенно увеличатся, он все равно будет поглощать больше углерода, чем сейчас, но общая доля снизится до уровня ниже 40%. [178] Это связано с тем, что изменение климата усиливает засухи и волны тепла, которые в конечном итоге подавляют рост растений на суше, а почвы будут выделять больше углерода из мертвых растений , когда они станут теплее . [179] [180] Скорость, с которой океаны поглощают атмосферный углерод, будет снижаться по мере того, как они станут более кислыми и будут испытывать изменения в термохалинной циркуляции и распределении фитопланктона . [181] [182] [89] Неопределенность в отношении обратной связи, особенно облачности, [183] Это основная причина, по которой разные климатические модели прогнозируют разные масштабы потепления для данного количества выбросов. [184]
Моделирование

Климатическая модель — это представление физических, химических и биологических процессов, влияющих на климатическую систему. [185] Модели включают естественные процессы, такие как изменения орбиты Земли, исторические изменения в активности Солнца и вулканическое воздействие. [186] Модели используются для оценки степени потепления, которое вызовут будущие выбросы, при учете силы климатических обратных связей . [187] [188] Модели также предсказывают циркуляцию океанов, годовой цикл времен года и потоки углерода между поверхностью суши и атмосферой. [189]
Физический реализм моделей проверяется путем проверки их способности имитировать современный или прошлый климат. [190] Предыдущие модели недооценивали темпы сокращения Арктики. [191] и недооценили скорость увеличения количества осадков. [192] Повышение уровня моря с 1990 года недооценивалось в старых моделях, но более поздние модели хорошо согласуются с наблюдениями. [193] В опубликованной в США в 2017 году Национальной оценке климата отмечается, что «климатические модели все еще могут недооценивать или отсутствовать соответствующие процессы обратной связи». [194] Кроме того, климатические модели могут оказаться неспособными адекватно предсказать краткосрочные региональные климатические сдвиги. [195]
Подмножество климатических моделей добавляют социальные факторы к физической модели климата. Эти модели моделируют, как население, экономический рост и использование энергии влияют на физический климат и взаимодействуют с ним. Обладая этой информацией, эти модели могут создавать сценарии будущих выбросов парниковых газов. Затем эти данные используются в качестве входных данных для моделей физического климата и моделей углеродного цикла, чтобы предсказать, как могут измениться концентрации парниковых газов в атмосфере. [196] [197] В зависимости от социально-экономического сценария и сценария смягчения последствий, модели дают концентрации CO 2 в атмосфере , которые варьируются в широком диапазоне от 380 до 1400 частей на миллион. [198]
Воздействие

Воздействие на окружающую среду
Экологические последствия изменения климата широки и далеко идущие, затрагивая океаны , лед и погоду. Изменения могут происходить постепенно или быстро. Доказательства этих эффектов получены в результате изучения изменения климата в прошлом, моделирования и современных наблюдений. [199] С 1950-х годов засухи и волны жары возникали одновременно все чаще. [200] Чрезвычайно влажные или засушливые явления в период дождей участились в Индии и Восточной Азии. [201] С 1980 года количество муссонных осадков в Северном полушарии увеличилось. [202] Интенсивность осадков и интенсивность ураганов и тайфунов, вероятно, увеличиваются . [203] а географический ареал, вероятно, расширится к полюсу в ответ на потепление климата. [204] Частота тропических циклонов не увеличилась в результате изменения климата. [205]

Глобальный уровень моря повышается в результате теплового расширения и таяния ледников и ледяных щитов . В период с 1993 по 2020 год рост со временем увеличивался, составив в среднем 3,3 ± 0,3 мм в год. [207] По прогнозам МГЭИК, в XXI веке повышение уровня моря составит 32–62 см при сценарии с низкими выбросами, 44–76 см – при промежуточном сценарии и 65–101 см – при сценарии очень высоких выбросов. [208] Процессы нестабильности морского ледникового покрова в Антарктиде могут существенно увеличить эти значения. [209] включая возможность повышения уровня моря на 2 метра к 2100 году в условиях высоких выбросов. [210]
Изменение климата привело к десятилетиям сокращения и истончения арктического морского льда . [211] Хотя ожидается, что безледное лето будет редким при потеплении на 1,5 °C, оно будет происходить раз в три-десять лет при уровне потепления на 2 °C. [212] CO 2 Более высокие концентрации в атмосфере приводят к растворению большего количества CO 2 в океанах, что делает их более кислыми . [213] Поскольку кислород менее растворим в более теплой воде, [214] его концентрации в океане уменьшаются , а мертвые зоны расширяются. [215]
Переломные моменты и долгосрочные последствия

Более высокая степень глобального потепления увеличивает риск прохождения « переломных точек » — пороговых значений, за которыми уже невозможно избежать некоторых серьезных последствий, даже если температуры вернутся к своему прежнему состоянию. [218] [219] Например, ледниковый щит Гренландии уже тает, но если глобальное потепление достигнет уровня от 1,7°C до 2,3°C, его таяние будет продолжаться до тех пор, пока он полностью не исчезнет. Если позже потепление снизится до 1,5 °C или меньше, оно все равно потеряет гораздо больше льда, чем если бы потеплению вообще не было позволено достичь порогового значения. [220] Хотя ледяные щиты будут таять в течение тысячелетий, другие переломные моменты наступят быстрее и оставят обществам меньше времени для реагирования. Коллапс основных океанских течений, таких как атлантическая меридиональная опрокидывающая циркуляция (AMOC), и необратимый ущерб ключевым экосистемам, таким как тропические леса Амазонки и коралловые рифы, могут произойти в течение нескольких десятилетий. [217]
Долгосрочные последствия изменения климата для океанов включают дальнейшее таяние льда, потепление океана , повышение уровня моря, закисление океана и обезвоживание океана. [221] Временные рамки долгосрочных воздействий составляют от столетий до тысячелетий из-за CO 2 в атмосфере. длительного существования [222] Когда чистые выбросы стабилизируются, температура приземного воздуха также стабилизируется, но океаны и ледяные шапки продолжат поглощать избыточное тепло из атмосферы. Результатом является предполагаемое общее повышение уровня моря на 2,3 метра на градус Цельсия (4,2 фута/°F) за 2000 лет. [223] океаном Поглощение CO 2 происходит достаточно медленно, поэтому закисление океана будет продолжаться в течение сотен и тысяч лет. [224] Глубокие океаны (ниже 2000 метров (6600 футов)) также уже потеряли более 10% растворенного кислорода в результате потепления, которое произошло к настоящему времени. [225] Кроме того, ледяной щит Западной Антарктики , похоже, подвержен практически необратимому таянию, что приведет к повышению уровня моря как минимум на 3,3 м (10 футов 10 дюймов) примерно за 2000 лет. [217] [226] [227]
Природа и дикая природа
Недавнее потепление заставило многие наземные и пресноводные виды переместиться к полюсу и подняться на большую высоту . [228] Например, за последние 55 лет ареал сотен североамериканских птиц сместился на север со средней скоростью 1,5 км/год. [229] Более высокие уровни CO 2 в атмосфере и удлиненный вегетационный период привели к глобальному озеленению. Однако волны тепла и засухи привели к снижению продуктивности экосистем в некоторых регионах. Будущий баланс этих противоположных эффектов неясен. [230] Родственным явлением, вызванным изменением климата, является вторжение древесных растений , затрагивающее до 500 миллионов гектаров во всем мире. [231] Изменение климата способствовало расширению более засушливых климатических зон, например, расширению пустынь в субтропиках . [232] Масштабы и скорость глобального потепления повышают вероятность резких изменений в экосистемах . [233] В целом ожидается, что изменение климата приведет к исчезновению многих видов. [234]
Океаны нагревались медленнее, чем земля, но растения и животные в океане мигрировали к более холодным полюсам быстрее, чем виды на суше. [235] Как и на суше, волны тепла в океане возникают чаще из-за изменения климата, нанося вред широкому спектру организмов, таких как кораллы, водоросли и морские птицы . [236] становится сложнее Из-за закисления океана морским кальцифицирующим организмам, таким как мидии , ракушки и кораллы, производить раковины и скелеты ; а волны тепла обесцвечили коралловые рифы . [237] Вредное цветение водорослей, усиленное изменением климата и эвтрофикацией, снижает уровень кислорода, разрушает пищевые сети и приводит к огромным потерям морской жизни. [238] Прибрежные экосистемы находятся под особым стрессом. Почти половина водно-болотных угодий мира исчезла из-за изменения климата и других антропогенных воздействий. [239] Растения подверглись повышенному стрессу от повреждений насекомыми. [240]
|


Люди

Последствия изменения климата влияют на людей во всем мире. [246] Воздействия можно наблюдать на всех континентах и в регионах океана. [247] низкоширотные, менее развитые районы . при этом наибольшему риску подвергаются [248] Продолжающееся потепление потенциально может иметь «серьезные, всеобъемлющие и необратимые последствия» для людей и экосистем. [249] Риски распределены неравномерно, но, как правило, они выше для обездоленных людей в развивающихся и развитых странах. [250]
Еда и здоровье
Всемирная организация здравоохранения (ВОЗ) называет изменение климата величайшей угрозой глобальному здоровью в 21 веке. [251] Экстремальные погодные условия приводят к травмам и гибели людей. [252] различные инфекционные заболевания В более теплом климате легче передаются , такие как лихорадка денге и малярия . [253] Неурожаи могут привести к нехватке продовольствия и недоеданию , особенно от этого страдают дети . [254] И дети, и пожилые люди уязвимы к сильной жаре. [255] По оценкам ВОЗ, в период с 2030 по 2050 год изменение климата будет вызывать около 250 000 дополнительных смертей в год. Они оценили смертность от воздействия жары среди пожилых людей, рост заболеваемости диареей , малярией, лихорадкой денге, прибрежными наводнениями и недоеданием среди детей. [256] К 2100 году от 50% до 75% населения планеты могут столкнуться с климатическими условиями, опасными для жизни из-за комбинированного воздействия сильной жары и влажности. [257]
Изменение климата влияет на продовольственную безопасность . Это привело к снижению мировых урожаев кукурузы, пшеницы и соевых бобов в период с 1981 по 2010 год. [258] Будущее потепление может еще больше снизить глобальную урожайность основных сельскохозяйственных культур. [259] На растениеводство, вероятно, окажет негативное влияние в странах низких широт, тогда как последствия в северных широтах могут быть положительными или отрицательными. [260] Еще до 183 миллионов человек во всем мире, особенно люди с более низкими доходами, подвергаются риску голода в результате этих воздействий. [261] Изменение климата также влияет на популяцию рыб. В глобальном масштабе для вылова будет меньше ресурсов. [262] Регионы, зависящие от ледниковой воды, уже засушливые регионы и небольшие острова подвержены более высокому риску водного дефицита из-за изменения климата. [263]
Средства к существованию и неравенство
Экономический ущерб из-за изменения климата может быть серьезным, и существует вероятность катастрофических последствий. [264] Серьезные последствия ожидаются в Юго-Восточной Азии и странах Африки к югу от Сахары , где большинство местного населения зависит от природных и сельскохозяйственных ресурсов. [265] [266] Тепловой стресс может помешать работникам на открытом воздухе работать. Если потепление достигнет 4 °C, то производительность труда в этих регионах может сократиться на 30–50%. [267] По оценкам Всемирного банка , в период с 2016 по 2030 год изменение климата может привести к крайней нищете более 120 миллионов человек без адаптации. [268]
Неравенство, основанное на богатстве и социальном статусе, усугубилось из-за изменения климата. [269] С серьезными трудностями в смягчении последствий климатических потрясений, адаптации к ним и восстановлении после них сталкиваются маргинализированные люди, у которых меньше контроля над ресурсами. [270] [265] Коренные народы , живущие за счет своей земли и экосистем, столкнутся с угрозой для своего здоровья и образа жизни из-за изменения климата. [271] Экспертное заключение пришло к выводу, что роль изменения климата в вооруженном конфликте невелика по сравнению с такими факторами, как социально-экономическое неравенство и возможности государства. [272]
Хотя женщины по своей природе не подвергаются большему риску изменения климата и потрясений, ограничения женских ресурсов и дискриминационные гендерные нормы ограничивают их адаптационные способности и устойчивость. [273] Например, во время климатических потрясений, таких как тепловой стресс, рабочая нагрузка женщин, включая часы, отработанные в сельском хозяйстве, снижается меньше, чем у мужчин. [273]
Климатическая миграция
Низколежащим островам и прибрежным населенным пунктам угрожает повышение уровня моря, что делает наводнения в городах более частыми. Иногда земля навсегда теряется в море. [274] Это может привести к безгражданству жителей островных государств, таких как Мальдивы и Тувалу . [275] В некоторых регионах повышение температуры и влажности может оказаться слишком сильным, чтобы люди могли к нему адаптироваться. [276] Модели прогнозируют, что при наихудшем сценарии изменения климата почти треть человечества может жить в непригодном для жизни и чрезвычайно жарком климате, подобном Сахаре. [277]
Эти факторы могут стимулировать климатическую или экологическую миграцию внутри стран и между ними. [13] Ожидается, что больше людей будут перемещены из-за повышения уровня моря, экстремальных погодных условий и конфликтов из-за усиления конкуренции за природные ресурсы. Изменение климата может также повысить уязвимость, что приведет к появлению «попавшего в ловушку населения», которое не сможет передвигаться из-за нехватки ресурсов. [278]
|
![Экологическая миграция. Редкие осадки приводят к опустыниванию, которое наносит ущерб сельскому хозяйству и может привести к перемещению населения. Показано: Телли, Мали (2008).[279]](http://upload.wikimedia.org/wikipedia/commons/thumb/2/29/Village_Telly_in_Mali.jpg/270px-Village_Telly_in_Mali.jpg)
![Сельскохозяйственные изменения. Засухи, повышение температуры и экстремальные погодные условия отрицательно влияют на сельское хозяйство. Показано: Техас, США (2013 г.).[280]](http://upload.wikimedia.org/wikipedia/commons/thumb/9/95/Corn_shows_the_affect_of_drought.jpg/271px-Corn_shows_the_affect_of_drought.jpg)
![Приливное наводнение. Повышение уровня моря увеличивает наводнения в низменных прибрежных регионах. Показано: Венеция, Италия (2004 г.).[281]](http://upload.wikimedia.org/wikipedia/commons/thumb/9/98/Acqua_alta_in_Piazza_San_Marco-original.jpg/240px-Acqua_alta_in_Piazza_San_Marco-original.jpg)
![Усиление шторма. Бангладеш после циклона Сидр (2007 г.) является примером катастрофического наводнения в результате увеличения количества осадков.[282]](http://upload.wikimedia.org/wikipedia/commons/thumb/6/69/US_Navy_071120-M-8966H-005_An_aerial_view_over_southern_Bangladesh_reveals_extensive_flooding_as_a_result_of_Cyclone_Sidr.jpg/270px-US_Navy_071120-M-8966H-005_An_aerial_view_over_southern_Bangladesh_reveals_extensive_flooding_as_a_result_of_Cyclone_Sidr.jpg)
![Усиление жары. Такие события, как жара на Южном конусе в 2022 году, становятся все более распространенными.[283]](http://upload.wikimedia.org/wikipedia/commons/thumb/f/f6/Argentina_geos5_202211.jpg/195px-Argentina_geos5_202211.jpg)
Сокращение и улавливание выбросов

Изменение климата можно смягчить за счет снижения скорости выбросов парниковых газов в атмосферу и увеличения скорости удаления углекислого газа из атмосферы. [284] Чтобы ограничить глобальное потепление уровнем ниже 1,5 °C, глобальные выбросы парниковых газов должны стать нулевыми к 2050 году или к 2070 году с целью в 2 °C. [102] Это требует далеко идущих, системных изменений беспрецедентного масштаба в энергетике, земле, городах, транспорте, зданиях и промышленности. [285]
, По оценкам Программы ООН по окружающей среде странам необходимо утроить свои обязательства по Парижскому соглашению в течение следующего десятилетия, чтобы ограничить глобальное потепление 2 °C. Для достижения цели в 1,5 °C необходим еще больший уровень снижения. [286] Учитывая обязательства, взятые в рамках Парижского соглашения в октябре 2021 года, глобальное потепление с вероятностью 66% все равно достигнет примерно 2,7 °C (диапазон: 2,2–3,2 °C) к концу столетия. [24] В глобальном масштабе ограничение потепления 2 °C может привести к более высоким экономическим выгодам, чем экономическим затратам. [287]
Хотя не существует единого способа ограничить глобальное потепление 1,5 или 2 °C, [288] Большинство сценариев и стратегий предусматривают значительное увеличение использования возобновляемых источников энергии в сочетании с усилением мер по повышению энергоэффективности для обеспечения необходимого сокращения выбросов парниковых газов. [289] Чтобы уменьшить нагрузку на экосистемы и повысить их способность связывать углерод, изменения также потребуются в сельском и лесном хозяйстве. [290] такие как предотвращение вырубки лесов и восстановление природных экосистем путем лесовосстановления . [291]
Другие подходы к смягчению последствий изменения климата имеют более высокий уровень риска. Сценарии, которые ограничивают глобальное потепление до 1,5 °C, обычно предполагают широкомасштабное использование методов удаления углекислого газа в XXI веке. [292] Однако существуют опасения по поводу чрезмерной зависимости от этих технологий и воздействия на окружающую среду. [293] Модификация солнечной радиации (SRM) также является возможным дополнением к значительному сокращению выбросов. Однако SRM вызывает серьезные этические и юридические проблемы, а риски не до конца понятны. [294]
Чистая энергия
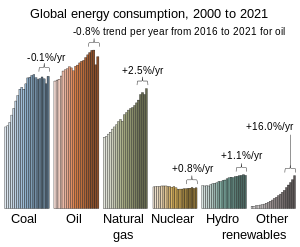

Возобновляемая энергия является ключом к ограничению изменения климата. [296] На протяжении десятилетий ископаемое топливо составляло примерно 80% мирового потребления энергии. [297] Оставшаяся доля была поделена между ядерной энергетикой и возобновляемыми источниками энергии (включая гидроэнергетику , биоэнергетику , ветровую и солнечную энергию, а также геотермальную энергию ). [298] Ожидается, что использование ископаемого топлива достигнет пика в абсолютном выражении до 2030 года, а затем снизится, причем наиболее резко сократится использование угля. [299] Возобновляемые источники энергии составили 75% всей новой генерации электроэнергии, установленной в 2019 году, почти полностью солнечной и ветровой. [300] Другие формы чистой энергии, такие как атомная и гидроэнергетика, в настоящее время занимают большую долю в энергоснабжении. Однако их прогнозы будущего роста кажутся ограниченными по сравнению с ними. [301]
Хотя солнечные панели и береговая ветроэнергетика в настоящее время являются одними из самых дешевых форм добавления новых мощностей по производству электроэнергии во многих местах, [302] Политика «зеленой» энергетики необходима для достижения быстрого перехода от ископаемого топлива к возобновляемым источникам энергии. [303] Для достижения углеродной нейтральности к 2050 году возобновляемые источники энергии должны стать доминирующей формой производства электроэнергии, а к 2050 году в некоторых сценариях их доля увеличится до 85% или более. К 2050 году инвестиции в уголь будут прекращены, а использование угля практически прекращено. [304] [305]
Электроэнергия, вырабатываемая из возобновляемых источников, также должна будет стать основным источником энергии для отопления и транспорта. [306] Транспорт может перейти от автомобилей с двигателями внутреннего сгорания к электромобилям , общественному транспорту и активному транспорту (езде на велосипеде и пешим прогулкам). [307] [308] Для судоходства и полетов низкоуглеродное топливо позволит сократить выбросы. [307] Отопление можно было бы все больше декарбонизировать с помощью таких технологий, как тепловые насосы . [309]
There are obstacles to the continued rapid growth of clean energy, including renewables. For wind and solar, there are environmental and land use concerns for new projects.[310] Wind and solar also produce energy intermittently and with seasonal variability. Traditionally, hydro dams with reservoirs and conventional power plants have been used when variable energy production is low. Going forward, battery storage can be expanded, energy demand and supply can be matched, and long-distance transmission can smooth variability of renewable outputs.[296] Bioenergy is often not carbon-neutral and may have negative consequences for food security.[311] The growth of nuclear power is constrained by controversy around radioactive waste, nuclear weapon proliferation, and accidents.[312][313] Hydropower growth is limited by the fact that the best sites have been developed, and new projects are confronting increased social and environmental concerns.[314]
Low-carbon energy improves human health by minimising climate change as well as reducing air pollution deaths,[315] which were estimated at 7 million annually in 2016.[316] Meeting the Paris Agreement goals that limit warming to a 2 °C increase could save about a million of those lives per year by 2050, whereas limiting global warming to 1.5 °C could save millions and simultaneously increase energy security and reduce poverty.[317] Improving air quality also has economic benefits which may be larger than mitigation costs.[318]
Energy conservation
Reducing energy demand is another major aspect of reducing emissions.[319] If less energy is needed, there is more flexibility for clean energy development. It also makes it easier to manage the electricity grid, and minimises carbon-intensive infrastructure development.[320] Major increases in energy efficiency investment will be required to achieve climate goals, comparable to the level of investment in renewable energy.[321] Several COVID-19 related changes in energy use patterns, energy efficiency investments, and funding have made forecasts for this decade more difficult and uncertain.[322]
Strategies to reduce energy demand vary by sector. In the transport sector, passengers and freight can switch to more efficient travel modes, such as buses and trains, or use electric vehicles.[323] Industrial strategies to reduce energy demand include improving heating systems and motors, designing less energy-intensive products, and increasing product lifetimes.[324] In the building sector the focus is on better design of new buildings, and higher levels of energy efficiency in retrofitting.[325] The use of technologies like heat pumps can also increase building energy efficiency.[326]
Agriculture and industry
Agriculture and forestry face a triple challenge of limiting greenhouse gas emissions, preventing the further conversion of forests to agricultural land, and meeting increases in world food demand.[327] A set of actions could reduce agriculture and forestry-based emissions by two thirds from 2010 levels. These include reducing growth in demand for food and other agricultural products, increasing land productivity, protecting and restoring forests, and reducing greenhouse gas emissions from agricultural production.[328]
On the demand side, a key component of reducing emissions is shifting people towards plant-based diets.[329] Eliminating the production of livestock for meat and dairy would eliminate about 3/4ths of all emissions from agriculture and other land use.[330] Livestock also occupy 37% of ice-free land area on Earth and consume feed from the 12% of land area used for crops, driving deforestation and land degradation.[331]
Steel and cement production are responsible for about 13% of industrial CO2 emissions. In these industries, carbon-intensive materials such as coke and lime play an integral role in the production, so that reducing CO2 emissions requires research into alternative chemistries.[332]
Carbon sequestration

Natural carbon sinks can be enhanced to sequester significantly larger amounts of CO2 beyond naturally occurring levels.[333] Reforestation and afforestation (planting forests where there were none before) are among the most mature sequestration techniques, although the latter raises food security concerns.[334] Farmers can promote sequestration of carbon in soils through practices such as use of winter cover crops, reducing the intensity and frequency of tillage, and using compost and manure as soil amendments.[335] Forest and landscape restoration yields many benefits for the climate, including greenhouse gas emissions sequestration and reduction.[141] Restoration/recreation of coastal wetlands, prairie plots and seagrass meadows increases the uptake of carbon into organic matter.[336][337] When carbon is sequestered in soils and in organic matter such as trees, there is a risk of the carbon being re-released into the atmosphere later through changes in land use, fire, or other changes in ecosystems.[338]
Where energy production or CO2-intensive heavy industries continue to produce waste CO2, the gas can be captured and stored instead of released to the atmosphere. Although its current use is limited in scale and expensive,[339] carbon capture and storage (CCS) may be able to play a significant role in limiting CO2 emissions by mid-century.[340] This technique, in combination with bioenergy (BECCS) can result in net negative emissions as CO2 is drawn from the atmosphere.[341] It remains highly uncertain whether carbon dioxide removal techniques will be able to play a large role in limiting warming to 1.5 °C. Policy decisions that rely on carbon dioxide removal increase the risk of global warming rising beyond international goals.[342]
Adaptation
Adaptation is "the process of adjustment to current or expected changes in climate and its effects".[343]: 5 Without additional mitigation, adaptation cannot avert the risk of "severe, widespread and irreversible" impacts.[344] More severe climate change requires more transformative adaptation, which can be prohibitively expensive.[345] The capacity and potential for humans to adapt is unevenly distributed across different regions and populations, and developing countries generally have less.[346] The first two decades of the 21st century saw an increase in adaptive capacity in most low- and middle-income countries with improved access to basic sanitation and electricity, but progress is slow. Many countries have implemented adaptation policies. However, there is a considerable gap between necessary and available finance.[347]
Adaptation to sea level rise consists of avoiding at-risk areas, learning to live with increased flooding, and building flood controls. If that fails, managed retreat may be needed.[348] There are economic barriers for tackling dangerous heat impact. Avoiding strenuous work or having air conditioning is not possible for everybody.[349] In agriculture, adaptation options include a switch to more sustainable diets, diversification, erosion control, and genetic improvements for increased tolerance to a changing climate.[350] Insurance allows for risk-sharing, but is often difficult to get for people on lower incomes.[351] Education, migration and early warning systems can reduce climate vulnerability.[352] Planting mangroves or encouraging other coastal vegetation can buffer storms.[353][354]
Ecosystems adapt to climate change, a process that can be supported by human intervention. By increasing connectivity between ecosystems, species can migrate to more favourable climate conditions. Species can also be introduced to areas acquiring a favorable climate. Protection and restoration of natural and semi-natural areas helps build resilience, making it easier for ecosystems to adapt. Many of the actions that promote adaptation in ecosystems, also help humans adapt via ecosystem-based adaptation. For instance, restoration of natural fire regimes makes catastrophic fires less likely, and reduces human exposure. Giving rivers more space allows for more water storage in the natural system, reducing flood risk. Restored forest acts as a carbon sink, but planting trees in unsuitable regions can exacerbate climate impacts.[355]
There are synergies but also trade-offs between adaptation and mitigation.[356] An example for synergy is increased food productivity, which has large benefits for both adaptation and mitigation.[357] An example of a trade-off is that increased use of air conditioning allows people to better cope with heat, but increases energy demand. Another trade-off example is that more compact urban development may reduce emissions from transport and construction, but may also increase the urban heat island effect, exposing people to heat-related health risks.[358]
|


Policies and politics

| High | Medium | Low | Very low |
Countries that are most vulnerable to climate change have typically been responsible for a small share of global emissions. This raises questions about justice and fairness.[359] Limiting global warming makes it much easier to achieve the UN's Sustainable Development Goals, such as eradicating poverty and reducing inequalities. The connection is recognised in Sustainable Development Goal 13 which is to "take urgent action to combat climate change and its impacts".[360] The goals on food, clean water and ecosystem protection have synergies with climate mitigation.[361]
The geopolitics of climate change is complex. It has often been framed as a free-rider problem, in which all countries benefit from mitigation done by other countries, but individual countries would lose from switching to a low-carbon economy themselves. Sometimes mitigation also has localised benefits though. For instance, the benefits of a coal phase-out to public health and local environments exceed the costs in almost all regions.[362] Furthermore, net importers of fossil fuels win economically from switching to clean energy, causing net exporters to face stranded assets: fossil fuels they cannot sell.[363]
Policy options
A wide range of policies, regulations, and laws are being used to reduce emissions. As of 2019, carbon pricing covers about 20% of global greenhouse gas emissions.[364] Carbon can be priced with carbon taxes and emissions trading systems.[365] Direct global fossil fuel subsidies reached $319 billion in 2017, and $5.2 trillion when indirect costs such as air pollution are priced in.[366] Ending these can cause a 28% reduction in global carbon emissions and a 46% reduction in air pollution deaths.[367] Money saved on fossil subsidies could be used to support the transition to clean energy instead.[368] More direct methods to reduce greenhouse gases include vehicle efficiency standards, renewable fuel standards, and air pollution regulations on heavy industry.[369] Several countries require utilities to increase the share of renewables in power production.[370]
Climate justice
Policy designed through the lens of climate justice tries to address human rights issues and social inequality. According to proponents of climate justice, the costs of climate adaptation should be paid by those most responsible for climate change, while the beneficiaries of payments should be those suffering impacts. One way this can be addressed in practice is to have wealthy nations pay poorer countries to adapt.[371]
Oxfam found that in 2023 the wealthiest 10% of people were responsible for 50% of global emissions, while the bottom 50% were responsible for just 8%.[372] Production of emissions is another way to look at responsibility: under that approach, the top 21 fossil fuel companies would owe cumulative climate reparations of $5.4 trillion over the period 2025–2050.[373] To achieve a just transition, people working in the fossil fuel sector would also need other jobs, and their communities would need investments.[374]
International climate agreements

Nearly all countries in the world are parties to the 1994 United Nations Framework Convention on Climate Change (UNFCCC).[376] The goal of the UNFCCC is to prevent dangerous human interference with the climate system.[377] As stated in the convention, this requires that greenhouse gas concentrations are stabilised in the atmosphere at a level where ecosystems can adapt naturally to climate change, food production is not threatened, and economic development can be sustained.[378] The UNFCCC does not itself restrict emissions but rather provides a framework for protocols that do. Global emissions have risen since the UNFCCC was signed.[379] Its yearly conferences are the stage of global negotiations.[380]
The 1997 Kyoto Protocol extended the UNFCCC and included legally binding commitments for most developed countries to limit their emissions.[381] During the negotiations, the G77 (representing developing countries) pushed for a mandate requiring developed countries to "[take] the lead" in reducing their emissions,[382] since developed countries contributed most to the accumulation of greenhouse gases in the atmosphere. Per-capita emissions were also still relatively low in developing countries and developing countries would need to emit more to meet their development needs.[383]
The 2009 Copenhagen Accord has been widely portrayed as disappointing because of its low goals, and was rejected by poorer nations including the G77.[384] Associated parties aimed to limit the global temperature rise to below 2 °C.[385] The Accord set the goal of sending $100 billion per year to developing countries for mitigation and adaptation by 2020, and proposed the founding of the Green Climate Fund.[386] As of 2020[update], only 83.3 billion were delivered. Only in 2023 the target is expected to be achieved.[387]
In 2015 all UN countries negotiated the Paris Agreement, which aims to keep global warming well below 2.0 °C and contains an aspirational goal of keeping warming under 1.5 °C.[388] The agreement replaced the Kyoto Protocol. Unlike Kyoto, no binding emission targets were set in the Paris Agreement. Instead, a set of procedures was made binding. Countries have to regularly set ever more ambitious goals and reevaluate these goals every five years.[389] The Paris Agreement restated that developing countries must be financially supported.[390] As of October 2021[update], 194 states and the European Union have signed the treaty and 191 states and the EU have ratified or acceded to the agreement.[391]
The 1987 Montreal Protocol, an international agreement to stop emitting ozone-depleting gases, may have been more effective at curbing greenhouse gas emissions than the Kyoto Protocol specifically designed to do so.[392] The 2016 Kigali Amendment to the Montreal Protocol aims to reduce the emissions of hydrofluorocarbons, a group of powerful greenhouse gases which served as a replacement for banned ozone-depleting gases. This made the Montreal Protocol a stronger agreement against climate change.[393]
National responses
In 2019, the United Kingdom parliament became the first national government to declare a climate emergency.[394] Other countries and jurisdictions followed suit.[395] That same year, the European Parliament declared a "climate and environmental emergency".[396] The European Commission presented its European Green Deal with the goal of making the EU carbon-neutral by 2050.[397] In 2021, the European Commission released its "Fit for 55" legislation package, which contains guidelines for the car industry; all new cars on the European market must be zero-emission vehicles from 2035.[398]
Major countries in Asia have made similar pledges: South Korea and Japan have committed to become carbon-neutral by 2050, and China by 2060.[399] While India has strong incentives for renewables, it also plans a significant expansion of coal in the country.[400] Vietnam is among very few coal-dependent, fast-developing countries that pledged to phase out unabated coal power by the 2040s or as soon as possible thereafter.[401]
As of 2021, based on information from 48 national climate plans, which represent 40% of the parties to the Paris Agreement, estimated total greenhouse gas emissions will be 0.5% lower compared to 2010 levels, below the 45% or 25% reduction goals to limit global warming to 1.5 °C or 2 °C, respectively.[402]
Society
Denial and misinformation
Public debate about climate change has been strongly affected by climate change denial and misinformation, which originated in the United States and has since spread to other countries, particularly Canada and Australia. Climate change denial has originated from fossil fuel companies, industry groups, conservative think tanks, and contrarian scientists.[404] Like the tobacco industry, the main strategy of these groups has been to manufacture doubt about climate-change related scientific data and results.[405] People who hold unwarranted doubt about climate change are called climate change "skeptics", although "contrarians" or "deniers" are more appropriate terms.[406]
There are different variants of climate denial: some deny that warming takes place at all, some acknowledge warming but attribute it to natural influences, and some minimise the negative impacts of climate change.[407] Manufacturing uncertainty about the science later developed into a manufactured controversy: creating the belief that there is significant uncertainty about climate change within the scientific community in order to delay policy changes.[408] Strategies to promote these ideas include criticism of scientific institutions,[409] and questioning the motives of individual scientists.[407] An echo chamber of climate-denying blogs and media has further fomented misunderstanding of climate change.[410]
Public awareness and opinion

Climate change came to international public attention in the late 1980s.[414] Due to media coverage in the early 1990s, people often confused climate change with other environmental issues like ozone depletion.[415] In popular culture, the climate fiction movie The Day After Tomorrow (2004) and the Al Gore documentary An Inconvenient Truth (2006) focused on climate change.[414]
Significant regional, gender, age and political differences exist in both public concern for, and understanding of, climate change. More highly educated people, and in some countries, women and younger people, were more likely to see climate change as a serious threat.[416] Partisan gaps also exist in many countries,[417] and countries with high CO2 emissions tend to be less concerned.[418] Views on causes of climate change vary widely between countries.[419] Concern has increased over time,[417] to the point where in 2021 a majority of citizens in many countries express a high level of worry about climate change, or view it as a global emergency.[420] Higher levels of worry are associated with stronger public support for policies that address climate change.[421]
Climate movement
Climate protests demand that political leaders take action to prevent climate change. They can take the form of public demonstrations, fossil fuel divestment, lawsuits and other activities.[422] Prominent demonstrations include the School Strike for Climate. In this initiative, young people across the globe have been protesting since 2018 by skipping school on Fridays, inspired by Swedish teenager Greta Thunberg.[423] Mass civil disobedience actions by groups like Extinction Rebellion have protested by disrupting roads and public transport.[424]
Litigation is increasingly used as a tool to strengthen climate action from public institutions and companies. Activists also initiate lawsuits which target governments and demand that they take ambitious action or enforce existing laws on climate change.[425] Lawsuits against fossil-fuel companies generally seek compensation for loss and damage.[426]
History
Early discoveries

Scientists in the 19th century such as Alexander von Humboldt began to foresee the effects of climate change.[428][429][430][431] In the 1820s, Joseph Fourier proposed the greenhouse effect to explain why Earth's temperature was higher than the Sun's energy alone could explain. Earth's atmosphere is transparent to sunlight, so sunlight reaches the surface where it is converted to heat. However, the atmosphere is not transparent to heat radiating from the surface, and captures some of that heat, which in turn warms the planet.[432]
In 1856 Eunice Newton Foote demonstrated that the warming effect of the Sun is greater for air with water vapour than for dry air, and that the effect is even greater with carbon dioxide (CO2). She concluded that "An atmosphere of that gas would give to our earth a high temperature..."[433][434]

Starting in 1859,[435] John Tyndall established that nitrogen and oxygen—together totaling 99% of dry air—are transparent to radiated heat. However, water vapour and gases such as methane and carbon dioxide absorb radiated heat and re-radiate that heat into the atmosphere. Tyndall proposed that changes in the concentrations of these gases may have caused climatic changes in the past, including ice ages.[436]
Svante Arrhenius noted that water vapour in air continuously varied, but the CO2 concentration in air was influenced by long-term geological processes. Warming from increased CO2 levels would increase the amount of water vapour, amplifying warming in a positive feedback loop. In 1896, he published the first climate model of its kind, projecting that halving CO2 levels could have produced a drop in temperature initiating an ice age. Arrhenius calculated the temperature increase expected from doubling CO2 to be around 5–6 °C.[437] Other scientists were initially skeptical and believed that the greenhouse effect was saturated so that adding more CO2 would make no difference, and that the climate would be self-regulating.[438] Beginning in 1938, Guy Stewart Callendar published evidence that climate was warming and CO2 levels were rising,[439] but his calculations met the same objections.[438]
Development of a scientific consensus

In the 1950s, Gilbert Plass created a detailed computer model that included different atmospheric layers and the infrared spectrum. This model predicted that increasing CO2 levels would cause warming. Around the same time, Hans Suess found evidence that CO2 levels had been rising, and Roger Revelle showed that the oceans would not absorb the increase. The two scientists subsequently helped Charles Keeling to begin a record of continued increase, which has been termed the "Keeling Curve".[438] Scientists alerted the public,[444] and the dangers were highlighted at James Hansen's 1988 Congressional testimony.[40] The Intergovernmental Panel on Climate Change (IPCC), set up in 1988 to provide formal advice to the world's governments, spurred interdisciplinary research.[445] As part of the IPCC reports, scientists assess the scientific discussion that takes place in peer-reviewed journal articles.[446]
There is a near-complete scientific consensus that the climate is warming and that this is caused by human activities. As of 2019, agreement in recent literature reached over 99%.[441][442] No scientific body of national or international standing disagrees with this view.[447] Consensus has further developed that some form of action should be taken to protect people against the impacts of climate change. National science academies have called on world leaders to cut global emissions.[448] The 2021 IPCC Assessment Report stated that it is "unequivocal" that climate change is caused by humans.[442]
See also
 Climate change portal
- Anthropocene – proposed geological time interval in which humans are having significant geological impact
- List of climate scientists
References
- ^ "GISS Surface Temperature Analysis (v4)". NASA. Retrieved 12 January 2024.
- ^ IPCC AR6 WG1 2021, SPM-7
- ^ IPCC SR15 Ch1 2018, p. 54: "These global-level rates of human-driven change far exceed the rates of change driven by geophysical or biosphere forces that have altered the Earth System trajectory in the past (e.g., Summerhayes, 2015; Foster et al., 2017); even abrupt geophysical events do not approach current rates of human-driven change."
- ^ Jump up to: a b Lynas, Mark; Houlton, Benjamin Z.; Perry, Simon (19 October 2021). "Greater than 99% consensus on human caused climate change in the peer-reviewed scientific literature". Environmental Research Letters. 16 (11): 114005. Bibcode:2021ERL....16k4005L. doi:10.1088/1748-9326/ac2966. ISSN 1748-9326. S2CID 239032360.
- ^ Jump up to: a b Our World in Data, 18 September 2020
- ^ IPCC AR6 WG1 Technical Summary 2021, p. 67: "Concentrations of CO2, methane (CH4), and nitrous oxide (N2O) have increased to levels unprecedented in at least 800,000 years, and there is high confidence that current CO2 concentrations have not been experienced for at least 2 million years."
- ^ IPCC SRCCL 2019, p. 7: "Since the pre-industrial period, the land surface air temperature has risen nearly twice as much as the global average temperature (high confidence). Climate change... contributed to desertification and land degradation in many regions (high confidence)."
- ^ IPCC SRCCL 2019, p. 45: "Climate change is playing an increasing role in determining wildfire regimes alongside human activity (medium confidence), with future climate variability expected to enhance the risk and severity of wildfires in many biomes such as tropical rainforests (high confidence)."
- ^ IPCC SROCC 2019, p. 16: "Over the last decades, global warming has led to widespread shrinking of the cryosphere, with mass loss from ice sheets and glaciers (very high confidence), reductions in snow cover (high confidence) and Arctic sea ice extent and thickness (very high confidence), and increased permafrost temperature (very high confidence)."
- ^ IPCC AR6 WG1 Ch11 2021, p. 1517
- ^ EPA (19 January 2017). "Climate Impacts on Ecosystems". Archived from the original on 27 January 2018. Retrieved 5 February 2019.
Mountain and arctic ecosystems and species are particularly sensitive to climate change... As ocean temperatures warm and the acidity of the ocean increases, bleaching and coral die-offs are likely to become more frequent.
- ^ IPCC SR15 Ch1 2018, p. 64: "Sustained net zero anthropogenic emissions of CO2 and declining net anthropogenic non-CO2 radiative forcing over a multi-decade period would halt anthropogenic global warming over that period, although it would not halt sea level rise or many other aspects of climate system adjustment."
- ^ Jump up to: a b Cattaneo et al. 2019; IPCC AR6 WG2 2022, pp. 15, 53
- ^ [1]
- ^ IPCC AR6 WG2 2022, p. 19
- ^ IPCC AR6 WG2 2022, pp. 21–26, 2504
- ^ IPCC AR6 SYR SPM 2023, pp. 8–9: "Effectiveness15 of adaptation in reducing climate risks16 is documented for specific contexts, sectors and regions (high confidence)...Soft limits to adaptation are currently being experienced by small-scale farmers and households along some low-lying coastal areas (medium confidence) resulting from financial, governance, institutional and policy constraints (high confidence). Some tropical, coastal, polar and mountain ecosystems have reached hard adaptation limits (high confidence). Adaptation does not prevent all losses and damages, even with effective adaptation and before reaching soft and hard limits (high confidence)."
- ^ Tietjen, Bethany (2 November 2022). "Loss and damage: Who is responsible when climate change harms the world's poorest countries?". The Conversation. Retrieved 30 August 2023.
- ^ "Climate Change 2022: Impacts, Adaptation and Vulnerability". IPCC. 27 February 2022. Retrieved 30 August 2023.
- ^ Ivanova, Irina (2 June 2022). "California is rationing water amid its worst drought in 1,200 years". CBS News.
- ^ Poyntin, Mark; Rivault, Erwan (10 January 2024). "2023 confirmed as world's hottest year on record". BBC. Retrieved 13 January 2024.
- ^ "Human, economic, environmental toll of climate change on the rise: WMO | UN News". news.un.org. 21 April 2023. Retrieved 11 April 2024.
- ^ IPCC AR6 WG1 Technical Summary 2021, p. 71
- ^ Jump up to: a b c United Nations Environment Programme 2021, p. 36: "A continuation of the effort implied by the latest unconditional NDCs and announced pledges is at present estimated to result in warming of about 2.7 °C (range: 2.2–3.2 °C) with a 66 per cent chance."
- ^ IPCC SR15 Ch2 2018, pp. 95–96: "In model pathways with no or limited overshoot of 1.5 °C, global net anthropogenic CO2 emissions decline by about 45% from 2010 levels by 2030 (40–60% interquartile range), reaching net zero around 2050 (2045–2055 interquartile range)"
- ^ IPCC SR15 2018, p. 17, SPM C.3: "All pathways that limit global warming to 1.5 °C with limited or no overshoot project the use of carbon dioxide removal (CDR) on the order of 100–1000 GtCO2 over the 21st century. CDR would be used to compensate for residual emissions and, in most cases, achieve net negative emissions to return global warming to 1.5 °C following a peak (high confidence). CDR deployment of several hundreds of GtCO2 is subject to multiple feasibility and sustainability constraints (high confidence)."
- ^ Rogelj et al. 2015
- ^ Hilaire et al. 2019
- ^ IPCC AR5 WG3 Annex III 2014, p. 1335
- ^ IPCC AR6 WG3 2022, pp. 24–25, 89
- ^ IPCC AR6 WG3 2022, p. 84: "Stringent emissions reductions at the level required for 2°C or 1.5°C are achieved through the increased electrification of buildings, transport, and industry, consequently all pathways entail increased electricity generation (high confidence)."
- ^ Jump up to: a b IPCC SRCCL Summary for Policymakers 2019, p. 18
- ^ IPCC AR6 WG3 2022, pp. 24–25, 114
- ^ Jump up to: a b NASA, 5 December 2008.
- ^ NASA, 7 July 2020
- ^ Shaftel 2016: " 'Climate change' and 'global warming' are often used interchangeably but have distinct meanings. ... Global warming refers to the upward temperature trend across the entire Earth since the early 20th century ... Climate change refers to a broad range of global phenomena ...[which] include the increased temperature trends described by global warming."
- ^ Associated Press, 22 September 2015: "The terms global warming and climate change can be used interchangeably. Climate change is more accurate scientifically to describe the various effects of greenhouse gases on the world because it includes extreme weather, storms and changes in rainfall patterns, ocean acidification and sea level.".
- ^ IPCC AR5 SYR Glossary 2014, p. 120: "Climate change refers to a change in the state of the climate that can be identified (e.g., by using statistical tests) by changes in the mean and/or the variability of its properties and that persists for an extended period, typically decades or longer. Climate change may be due to natural internal processes or external forcings such as modulations of the solar cycles, volcanic eruptions and persistent anthropogenic changes in the composition of the atmosphere or in land use."
- ^ Broeker, Wallace S. (8 August 1975). "Climatic Change: Are We on the Brink of a Pronounced Global Warming?". Science. 189 (4201): 460–463. Bibcode:1975Sci...189..460B. doi:10.1126/science.189.4201.460. JSTOR 1740491. PMID 17781884. S2CID 16702835.
- ^ Jump up to: a b Weart "The Public and Climate Change: The Summer of 1988", "News reporters gave only a little attention ...".
- ^ Joo et al. 2015.
- ^ Hodder & Martin 2009
- ^ BBC Science Focus Magazine, 3 February 2020
- ^ Neukom et al. 2019b.
- ^ "Global Annual Mean Surface Air Temperature Change". NASA. Retrieved 23 February 2020.
- ^ Thomas, Zoë A.; Jones, Richard T.; Turney, Chris S.M.; Golledge, Nicholas; Fogwill, Christopher; Bradshaw, Corey J.A.; Menviel, Laurie; McKay, Nicholas P.; Bird, Michael; Palmer, Jonathan; Kershaw, Peter; Wilmshurst, Janet; Muscheler, Raimund (April 2020). "Tipping elements and amplified polar warming during the Last Interglacial". Quaternary Science Reviews. 233: 106222. Bibcode:2020QSRv..23306222T. doi:10.1016/j.quascirev.2020.106222. S2CID 216288524.
- ^ Michon, Scott. "What's the coldest the Earth's ever been?". SMITHSONIAN INSTITUTION. Retrieved 6 August 2023.
- ^ Barlow, Natasha L. M.; McClymont, Erin L.; Whitehouse, Pippa L.; Stokes, Chris R.; Jamieson, Stewart S. R.; Woodroffe, Sarah A.; Bentley, Michael J.; Callard, S. Louise; Cofaigh, Colm Ó; Evans, David J. A.; Horrocks, Jennifer R.; Lloyd, Jerry M.; Long, Antony J.; Margold, Martin; Roberts, David H. (September 2018). "Lack of evidence for a substantial sea-level fluctuation within the Last Interglacial". Nature Geoscience. 11 (9): 627–634. Bibcode:2018NatGe..11..627B. doi:10.1038/s41561-018-0195-4. ISSN 1752-0894. S2CID 135048938.
- ^ Richard Z. Poore, Richard S. Williams, Jr., and Christopher Tracey. "Sea Level and Climate". United States Geological Survey.
- ^ Marcott, S. A.; Shakun, J. D.; Clark, P. U.; Mix, A. C. (2013). "A reconstruction of regional and global temperature for the past 11,300 years". Science. 339 (6124): 1198–1201. Bibcode:2013Sci...339.1198M. doi:10.1126/science.1228026. PMID 23471405.
- ^ IPCC AR5 WG1 Ch5 2013, p. 386
- ^ Neukom et al. 2019a
- ^ IPCC SR15 Ch1 2018, p. 57: "This report adopts the 51-year reference period, 1850–1900 inclusive, assessed as an approximation of pre-industrial levels in AR5 ... Temperatures rose by 0.0 °C–0.2 °C from 1720–1800 to 1850–1900"
- ^ Hawkins et al. 2017, p. 1844
- ^ "Mean Monthly Temperature Records Across the Globe / Timeseries of Global Land and Ocean Areas at Record Levels for September from 1951-2023". NCEI.NOAA.gov. National Centers for Environmental Information (NCEI) of the National Oceanic and Atmospheric Administration (NOAA). September 2023. Archived from the original on 14 October 2023. (change "202309" in URL to see years other than 2023, and months other than 09=September)
- ^ Top 700 meters: Lindsey, Rebecca; Dahlman, Luann (6 September 2023). "Climate Change: Ocean Heat Content". climate.gov. National Oceanic and Atmospheric Administration (NOAA). Archived from the original on 29 October 2023. ● Top 2000 meters: "Ocean Warming / Latest Measurement: December 2022 / 345 (± 2) zettajoules since 1955". NASA.gov. National Aeronautics and Space Administration. Archived from the original on 20 October 2023.
- ^ IPCC AR5 WG1 Summary for Policymakers 2013, pp. 4–5: "Global-scale observations from the instrumental era began in the mid-19th century for temperature and other variables ... the period 1880 to 2012 ... multiple independently produced datasets exist."
- ^ Mooney, Chris; Osaka, Shannon (26 December 2023). "Is climate change speeding up? Here's what the science says". The Washington Post. Retrieved 18 January 2024.
- ^ Jump up to: a b "Global 'Sunscreen' Has Likely Thinned, Report NASA Scientists". NASA. 15 March 2007.
- ^ Jump up to: a b c Quaas, Johannes; Jia, Hailing; Smith, Chris; Albright, Anna Lea; Aas, Wenche; Bellouin, Nicolas; Boucher, Olivier; Doutriaux-Boucher, Marie; Forster, Piers M.; Grosvenor, Daniel; Jenkins, Stuart; Klimont, Zbigniew; Loeb, Norman G.; Ma, Xiaoyan; Naik, Vaishali; Paulot, Fabien; Stier, Philip; Wild, Martin; Myhre, Gunnar; Schulz, Michael (21 September 2022). "Robust evidence for reversal of the trend in aerosol effective climate forcing". Atmospheric Chemistry and Physics. 22 (18): 12221–12239. Bibcode:2022ACP....2212221Q. doi:10.5194/acp-22-12221-2022. hdl:20.500.11850/572791. S2CID 252446168.
- ^ IPCC AR6 WG1 2021, p. 43
- ^ EPA 2016: "The U.S. Global Change Research Program, the National Academy of Sciences, and the Intergovernmental Panel on Climate Change (IPCC) have each independently concluded that warming of the climate system in recent decades is "unequivocal". This conclusion is not drawn from any one source of data but is based on multiple lines of evidence, including three worldwide temperature datasets showing nearly identical warming trends as well as numerous other independent indicators of global warming (e.g. rising sea levels, shrinking Arctic sea ice)."
- ^ IPCC SR15 Ch1 2018, p. 81.
- ^ Earth System Science Data 2023, p. 2306
- ^ Samset, B. H.; Fuglestvedt, J. S.; Lund, M. T. (7 July 2020). "Delayed emergence of a global temperature response after emission mitigation". Nature Communications. 11 (1): 3261. Bibcode:2020NatCo..11.3261S. doi:10.1038/s41467-020-17001-1. hdl:11250/2771093. PMC 7341748. PMID 32636367.
At the time of writing, that translated into 2035–2045, where the delay was mostly due to the impacts of the around 0.2 °C of natural, interannual variability of global mean surface air temperature
- ^ Seip, Knut L.; Grøn, ø.; Wang, H. (31 August 2023). "Global lead-lag changes between climate variability series coincide with major phase shifts in the Pacific decadal oscillation". Theoretical and Applied Climatology. 154 (3–4): 1137–1149. Bibcode:2023ThApC.154.1137S. doi:10.1007/s00704-023-04617-8. hdl:11250/3088837. ISSN 0177-798X. S2CID 261438532.
- ^ Yao, Shuai-Lei; Huang, Gang; Wu, Ren-Guang; Qu, Xia (January 2016). "The global warming hiatus—a natural product of interactions of a secular warming trend and a multi-decadal oscillation". Theoretical and Applied Climatology. 123 (1–2): 349–360. Bibcode:2016ThApC.123..349Y. doi:10.1007/s00704-014-1358-x. ISSN 0177-798X. S2CID 123602825. Retrieved 20 September 2023.
- ^ Xie, Shang-Ping; Kosaka, Yu (June 2017). "What Caused the Global Surface Warming Hiatus of 1998–2013?". Current Climate Change Reports. 3 (2): 128–140. Bibcode:2017CCCR....3..128X. doi:10.1007/s40641-017-0063-0. ISSN 2198-6061. S2CID 133522627. Retrieved 20 September 2023.
- ^ "Global temperature exceeds 2 °C above pre-industrial average on 17 November". Copernicus. 21 November 2023. Retrieved 31 January 2024.
While exceeding the 2 °C threshold for a number of days does not mean that we have breached the Paris Agreement targets, the more often that we exceed this threshold, the more serious the cumulative effects of these breaches will become.
- ^ IPCC, 2021: Summary for Policymakers. In: Climate Change 2021: The Physical Science Basis. Contribution of Working Group I to the Sixth Assessment Report of the Intergovernmental Panel on Climate Change [Masson-Delmotte, V., P. Zhai, A. Pirani, S.L. Connors, C. Péan, S. Berger, N. Caud, Y. Chen, L. Goldfarb, M. I. Gomis, M. Huang, K. Leitzell, E. Lonnoy, J. B. R. Matthews, T. K. Maycock, T. Waterfield, O. Yelekçi, R. Yu, and B. Zhou (eds.)]. Cambridge University Press, Cambridge, United Kingdom and New York, New York, US, pp. 3−32, doi:10.1017/9781009157896.001.
- ^ McGrath, Matt (17 May 2023). "Global warming set to break key 1.5C limit for first time". BBC News. Retrieved 31 January 2024.
The researchers stress that temperatures would have to stay at or above 1.5C for 20 years to be able to say the Paris agreement threshold had been passed.
- ^ Kennedy et al. 2010, p. S26. Figure 2.5.
- ^ Loeb et al. 2021.
- ^ "Global Warming". NASA JPL. 3 June 2010. Retrieved 11 September 2020.
Satellite measurements show warming in the troposphere but cooling in the stratosphere. This vertical pattern is consistent with global warming due to increasing greenhouse gases but inconsistent with warming from natural causes.
- ^ Kennedy et al. 2010, pp. S26, S59–S60
- ^ USGCRP Chapter 1 2017, p. 35
- ^ IPCC AR6 WG2 2022, pp. 257–260
- ^ IPCC SRCCL Summary for Policymakers 2019, p. 7
- ^ Sutton, Dong & Gregory 2007.
- ^ "Climate Change: Ocean Heat Content". Noaa Climate.gov. NOAA. 2018. Archived from the original on 12 February 2019. Retrieved 20 February 2019.
- ^ IPCC AR5 WG1 Ch3 2013, p. 257: "Ocean warming dominates the global energy change inventory. Warming of the ocean accounts for about 93% of the increase in the Earth's energy inventory between 1971 and 2010 (high confidence), with warming of the upper (0 to 700 m) ocean accounting for about 64% of the total.
- ^ von Schuckman, K.; Cheng, L.; Palmer, M. D.; Hansen, J.; et al. (7 September 2020). "Heat stored in the Earth system: where does the energy go?". Earth System Science Data. 12 (3): 2013–2041. Bibcode:2020ESSD...12.2013V. doi:10.5194/essd-12-2013-2020. hdl:20.500.11850/443809.
- ^ NOAA, 10 July 2011.
- ^ United States Environmental Protection Agency 2016, p. 5: "Black carbon that is deposited on snow and ice darkens those surfaces and decreases their reflectivity (albedo). This is known as the snow/ice albedo effect. This effect results in the increased absorption of radiation that accelerates melting."
- ^ "Arctic warming three times faster than the planet, report warns". Phys.org. 20 May 2021. Retrieved 6 October 2022.
- ^ Rantanen, Mika; Karpechko, Alexey Yu; Lipponen, Antti; Nordling, Kalle; Hyvärinen, Otto; Ruosteenoja, Kimmo; Vihma, Timo; Laaksonen, Ari (11 August 2022). "The Arctic has warmed nearly four times faster than the globe since 1979". Communications Earth & Environment. 3 (1): 168. Bibcode:2022ComEE...3..168R. doi:10.1038/s43247-022-00498-3. hdl:11250/3115996. ISSN 2662-4435. S2CID 251498876.
- ^ "The Arctic is warming four times faster than the rest of the world". 14 December 2021. Retrieved 6 October 2022.
- ^ Liu, Wei; Fedorov, Alexey V.; Xie, Shang-Ping; Hu, Shineng (26 June 2020). "Climate impacts of a weakened Atlantic Meridional Overturning Circulation in a warming climate". Science Advances. 6 (26): eaaz4876. Bibcode:2020SciA....6.4876L. doi:10.1126/sciadv.aaz4876. PMC 7319730. PMID 32637596.
- ^ Jump up to: a b Pearce, Fred (18 April 2023). "New Research Sparks Concerns That Ocean Circulation Will Collapse". Retrieved 3 February 2024.
- ^ Lee, Sang-Ki; Lumpkin, Rick; Gomez, Fabian; Yeager, Stephen; Lopez, Hosmay; Takglis, Filippos; Dong, Shenfu; Aguiar, Wilton; Kim, Dongmin; Baringer, Molly (13 March 2023). "Human-induced changes in the global meridional overturning circulation are emerging from the Southern Ocean". Communications Earth & Environment. 4 (1): 69. Bibcode:2023ComEE...4...69L. doi:10.1038/s43247-023-00727-3.
- ^ "NOAA Scientists Detect a Reshaping of the Meridional Overturning Circulation in the Southern Ocean". NOAA. 29 March 2023.
- ^ Schuur, Edward A.G.; Abbott, Benjamin W.; Commane, Roisin; Ernakovich, Jessica; Euskirchen, Eugenie; Hugelius, Gustaf; Grosse, Guido; Jones, Miriam; Koven, Charlie; Leshyk, Victor; Lawrence, David; Loranty, Michael M.; Mauritz, Marguerite; Olefeldt, David; Natali, Susan; Rodenhizer, Heidi; Salmon, Verity; Schädel, Christina; Strauss, Jens; Treat, Claire; Turetsky, Merritt (2022). "Permafrost and Climate Change: Carbon Cycle Feedbacks From the Warming Arctic". Annual Review of Environment and Resources. 47: 343–371. doi:10.1146/annurev-environ-012220-011847.
Medium-range estimates of Arctic carbon emissions could result from moderate climate emission mitigation policies that keep global warming below 3 °C (e.g., RCP4.5). This global warming level most closely matches country emissions reduction pledges made for the Paris Climate Agreement...
- ^ Phiddian, Ellen (5 April 2022). "Explainer: IPCC Scenarios". Cosmos. Retrieved 30 September 2023.
"The IPCC doesn't make projections about which of these scenarios is more likely, but other researchers and modellers can. The Australian Academy of Science, for instance, released a report last year stating that our current emissions trajectory had us headed for a 3 °C warmer world, roughly in line with the middle scenario. Climate Action Tracker predicts 2.5 to 2.9 °C of warming based on current policies and action, with pledges and government agreements taking this to 2.1 °C.
- ^ McGrath, Matt (17 May 2023). "Global warming set to break key 1.5C limit for first time". BBC. Retrieved 17 May 2023.
- ^ Harvey, Fiona (17 May 2023). "World likely to breach 1.5C climate threshold by 2027, scientists warn". The Guardian. Retrieved 17 May 2023.
- ^ "Climate Change 2021 - The Physical Science Basis" (PDF). Intergovernmental Panel on Climate Change. 7 August 2021. IPCC AR6 WGI. Archived (PDF) from the original on 5 April 2024.
- ^ IPCC AR6 WG1 Summary for Policymakers 2021, p. SPM-17
- ^ Meinshausen, Malte; Smith, S. J.; Calvin, K.; Daniel, J. S.; Kainuma, M. L. T.; Lamarque, J-F.; Matsumoto, K.; Montzka, S. A.; Raper, S. C. B.; Riahi, K.; Thomson, A.; Velders, G. J. M.; van Vuuren, D.P. P. (2011). "The RCP greenhouse gas concentrations and their extensions from 1765 to 2300". Climatic Change. 109 (1–2): 213–241. Bibcode:2011ClCh..109..213M. doi:10.1007/s10584-011-0156-z. ISSN 0165-0009.
- ^ Lyon, Christopher; Saupe, Erin E.; Smith, Christopher J.; Hill, Daniel J.; Beckerman, Andrew P.; Stringer, Lindsay C.; Marchant, Robert; McKay, James; Burke, Ariane; O'Higgins, Paul; Dunhill, Alexander M.; Allen, Bethany J.; Riel-Salvatore, Julien; Aze, Tracy (2021). "Climate change research and action must look beyond 2100". Global Change Biology. 28 (2): 349–361. doi:10.1111/gcb.15871. hdl:20.500.11850/521222. ISSN 1365-2486. PMID 34558764. S2CID 237616583.
- ^ IPCC AR6 WG1 2021, pp. 43–44
- ^ Rogelj et al. 2019
- ^ Jump up to: a b IPCC SR15 Summary for Policymakers 2018, p. 12
- ^ IPCC AR5 WG3 Ch5 2014, pp. 379–380.
- ^ Brown, Patrick T.; Li, Wenhong; Xie, Shang-Ping (27 January 2015). "Regions of significant influence on unforced global mean surface air temperature variability in climate models: Origin of global temperature variability". Journal of Geophysical Research: Atmospheres. 120 (2): 480–494. doi:10.1002/2014JD022576. hdl:10161/9564.
- ^ Trenberth, Kevin E.; Fasullo, John T. (December 2013). "An apparent hiatus in global warming?". Earth's Future. 1 (1): 19–32. Bibcode:2013EaFut...1...19T. doi:10.1002/2013EF000165.
- ^ National Research Council 2012, p. 9
- ^ IPCC AR5 WG1 Ch10 2013, p. 916.
- ^ Knutson 2017, p. 443; IPCC AR5 WG1 Ch10 2013, pp. 875–876
- ^ Jump up to: a b USGCRP 2009, p. 20.
- ^ IPCC AR6 WG1 Summary for Policymakers 2021, p. 7
- ^ Lüthi, Dieter; Le Floch, Martine; Bereiter, Bernhard; Blunier, Thomas; Barnola, Jean-Marc; Siegenthaler, Urs; Raynaud, Dominique; Jouzel, Jean; Fischer, Hubertus; Kawamura, Kenji; Stocker, Thomas F. (May 2005). "High-resolution carbon dioxide concentration record 650,000–800,000 years before present". Nature. 453 (7193): 379–382. Bibcode:2008Natur.453..379L. doi:10.1038/nature06949. ISSN 0028-0836. PMID 18480821. S2CID 1382081.
- ^ Fischer, Hubertus; Wahlen, Martin; Smith, Jesse; Mastroianni, Derek; Deck, Bruce (12 March 1999). "Ice Core Records of Atmospheric CO 2 Around the Last Three Glacial Terminations". Science. 283 (5408): 1712–1714. Bibcode:1999Sci...283.1712F. doi:10.1126/science.283.5408.1712. ISSN 0036-8075. PMID 10073931.
- ^ Indermühle, Andreas; Monnin, Eric; Stauffer, Bernhard; Stocker, Thomas F.; Wahlen, Martin (1 March 2000). "Atmospheric CO 2 concentration from 60 to 20 kyr BP from the Taylor Dome Ice Core, Antarctica". Geophysical Research Letters. 27 (5): 735–738. Bibcode:2000GeoRL..27..735I. doi:10.1029/1999GL010960. S2CID 18942742.
- ^ Etheridge, D.; Steele, L.; Langenfelds, R.; Francey, R.; Barnola, J.-M.; Morgan, V. (1998). "Historical CO2 Records from the Law Dome DE08, DE08-2, and DSS Ice Cores". Carbon Dioxide Information Analysis Center, Oak Ridge National Laboratory. U.S. Department of Energy. Retrieved 20 November 2022.
- ^ Keeling, C.; Whorf, T. (2004). "Atmospheric CO2 Records from Sites in the SIO Air Sampling Network". Carbon Dioxide Information Analysis Center, Oak Ridge National Laboratory. U.S. Department of Energy. Retrieved 20 November 2022.
- ^ NASA. "The Causes of Climate Change". Climate Change: Vital Signs of the Planet. Archived from the original on 8 May 2019. Retrieved 8 May 2019.
- ^ Ozone acts as a greenhouse gas in the lowest layer of the atmosphere, the troposphere (as opposed to the stratospheric ozone layer). Wang, Shugart & Lerdau 2017
- ^ Schmidt et al. 2010; USGCRP Climate Science Supplement 2014, p. 742
- ^ IPCC AR4 WG1 Ch1 2007, FAQ1.1: "To emit 240 W m−2, a surface would have to have a temperature of around −19 °C. This is much colder than the conditions that actually exist at the Earth's surface (the global mean surface temperature is about 14 °C).
- ^ ACS. "What Is the Greenhouse Effect?". Archived from the original on 26 May 2019. Retrieved 26 May 2019.
- ^ The Guardian, 19 February 2020.
- ^ WMO 2021, p. 8.
- ^ IPCC AR6 WG1 Technical Summary 2021, p. TS-35.
- ^ IPCC AR6 WG3 Summary for Policymakers 2022, Figure SPM.1.
- ^ Olivier & Peters 2019, p. 17
- ^ Our World in Data, 18 September 2020; EPA 2020: "Greenhouse gas emissions from industry primarily come from burning fossil fuels for energy, as well as greenhouse gas emissions from certain chemical reactions necessary to produce goods from raw materials."
- ^ "Redox, extraction of iron and transition metals".
Hot air (oxygen) reacts with the coke (carbon) to produce carbon dioxide and heat energy to heat up the furnace. Removing impurities: The calcium carbonate in the limestone thermally decomposes to form calcium oxide. calcium carbonate → calcium oxide + carbon dioxide
- ^ Kvande 2014: "Carbon dioxide gas is formed at the anode, as the carbon anode is consumed upon reaction of carbon with the oxygen ions from the alumina (Al2O3). Formation of carbon dioxide is unavoidable as long as carbon anodes are used, and it is of great concern because CO2 is a greenhouse gas."
- ^ EPA 2020
- ^ Global Methane Initiative 2020: "Estimated Global Anthropogenic Methane Emissions by Source, 2020: Enteric fermentation (27%), Manure Management (3%), Coal Mining (9%), Municipal Solid Waste (11%), Oil & Gas (24%), Wastewater (7%), Rice Cultivation (7%)."
- ^ EPA 2019: "Agricultural activities, such as fertilizer use, are the primary source of N2O emissions."
- ^ Davidson 2009: "2.0% of manure nitrogen and 2.5% of fertilizer nitrogen was converted to nitrous oxide between 1860 and 2005; these percentage contributions explain the entire pattern of increasing nitrous oxide concentrations over this period."
- ^ "Understanding methane emissions". International Energy Agency.
- ^ Jump up to: a b Riebeek, Holli (16 June 2011). "The Carbon Cycle". Earth Observatory. NASA. Archived from the original on 5 March 2016. Retrieved 5 April 2018.
- ^ IPCC SRCCL Summary for Policymakers 2019, p. 10
- ^ IPCC SROCC Ch5 2019, p. 450.
- ^ "Indicators of Forest Extent / Forest Loss". World Resources Institute. 4 April 2024. Archived from the original on 27 May 2024. Chart in section titled "Annual rates of global tree cover loss have risen since 2000".
- ^ Ritchie & Roser 2018
- ^ The Sustainability Consortium, 13 September 2018; UN FAO 2016, p. 18.
- ^ Curtis et al. 2018
- ^ Jump up to: a b c Garrett, L.; Lévite, H.; Besacier, C.; Alekseeva, N.; Duchelle, M. (2022). The key role of forest and landscape restoration in climate action. Rome: FAO. doi:10.4060/cc2510en. ISBN 978-92-5-137044-5.
- ^ Jump up to: a b World Resources Institute, 8 December 2019
- ^ IPCC SRCCL Ch2 2019, p. 172: "The global biophysical cooling alone has been estimated by a larger range of climate models and is −0.10 ± 0.14 °C; it ranges from −0.57 °C to +0.06 °C ... This cooling is essentially dominated by increases in surface albedo: historical land cover changes have generally led to a dominant brightening of land."
- ^ Haywood 2016, p. 456; McNeill 2017; Samset et al. 2018.
- ^ IPCC AR5 WG1 Ch2 2013, p. 183.
- ^ He et al. 2018; Storelvmo et al. 2016
- ^ "Aerosol pollution has caused decades of global dimming". American Geophysical Union. 18 February 2021. Archived from the original on 27 March 2023. Retrieved 18 December 2023.
- ^ Xia, Wenwen; Wang, Yong; Chen, Siyu; Huang, Jianping; Wang, Bin; Zhang, Guang J.; Zhang, Yue; Liu, Xiaohong; Ma, Jianmin; Gong, Peng; Jiang, Yiquan; Wu, Mingxuan; Xue, Jinkai; Wei, Linyi; Zhang, Tinghan (2022). "Double Trouble of Air Pollution by Anthropogenic Dust". Environmental Science & Technology. 56 (2): 761–769. Bibcode:2022EnST...56..761X. doi:10.1021/acs.est.1c04779. hdl:10138/341962. PMID 34941248. S2CID 245445736.
- ^ "Global Dimming Dilemma". 4 June 2020.
- ^ Wild et al. 2005; Storelvmo et al. 2016; Samset et al. 2018.
- ^ Twomey 1977.
- ^ Albrecht 1989.
- ^ Jump up to: a b c USGCRP Chapter 2 2017, p. 78.
- ^ Ramanathan & Carmichael 2008; RIVM 2016.
- ^ Sand et al. 2015
- ^ IMO 2020 – cutting sulphur oxide emissions
- ^ Staff, Carbon Brief (3 July 2023). "Analysis: How low-sulphur shipping rules are affecting global warming". Carbon Brief.
- ^ "Climate Science Special Report: Fourth National Climate Assessment, Volume I - Chapter 3: Detection and Attribution of Climate Change". science2017.globalchange.gov. U.S. Global Change Research Program (USGCRP): 1–470. 2017. Archived from the original on 23 September 2019. Adapted directly from Fig. 3.3.
- ^ Wuebbles, D.J.; Fahey, D.W.; Hibbard, K.A.; Deangelo, B.; Doherty, S.; Hayhoe, K.; Horton, R.; Kossin, J.P.; Taylor, P.C.; Waple, A.M.; Yohe, C.P. (23 November 2018). "Climate Science Special Report / Fourth National Climate Assessment (NCA4), Volume I /Executive Summary / Highlights of the Findings of the U.S. Global Change Research Program Climate Science Special Report". globalchange.gov. U.S. Global Change Research Program: 1–470. doi:10.7930/J0DJ5CTG. Archived from the original on 14 June 2019.
- ^ National Academies 2008, p. 6
- ^ "Is the Sun causing global warming?". Climate Change: Vital Signs of the Planet. Archived from the original on 5 May 2019. Retrieved 10 May 2019.
- ^ IPCC AR4 WG1 Ch9 2007, pp. 702–703; Randel et al. 2009.
- ^ Greicius, Tony (2 August 2022). "Tonga eruption blasted unprecedented amount of water into stratosphere". NASA Global Climate Change. Retrieved 18 January 2024.
Massive volcanic eruptions like Krakatoa and Mount Pinatubo typically cool Earth's surface by ejecting gases, dust, and ash that reflect sunlight back into space. In contrast, the Tonga volcano didn't inject large amounts of aerosols into the stratosphere, and the huge amounts of water vapor from the eruption may have a small, temporary warming effect, since water vapor traps heat. The effect would dissipate when the extra water vapor cycles out of the stratosphere and would not be enough to noticeably exacerbate climate change effects.
- ^ Jump up to: a b USGCRP Chapter 2 2017, p. 79
- ^ Fischer & Aiuppa 2020.
- ^ "Thermodynamics: Albedo". NSIDC. Archived from the original on 11 October 2017. Retrieved 10 October 2017.
- ^ "The study of Earth as an integrated system". Vitals Signs of the Planet. Earth Science Communications Team at NASA's Jet Propulsion Laboratory / California Institute of Technology. 2013. Archived from the original on 26 February 2019.
- ^ Jump up to: a b USGCRP Chapter 2 2017, pp. 89–91.
- ^ IPCC AR6 WG1 Technical Summary 2021, p. 58: "The net effect of changes in clouds in response to global warming is to amplify human-induced warming, that is, the net cloud feedback is positive (high confidence)"
- ^ USGCRP Chapter 2 2017, pp. 89–90.
- ^ IPCC AR5 WG1 2013, p. 14
- ^ IPCC AR6 WG1 Technical Summary 2021, p. 93: "Feedback processes are expected to become more positive overall (more amplifying of global surface temperature changes) on multi-decadal time scales as the spatial pattern of surface warming evolves and global surface temperature increases."
- ^ Williams, Ceppi & Katavouta 2020.
- ^ NASA, 28 May 2013.
- ^ Cohen et al. 2014.
- ^ Jump up to: a b Turetsky et al. 2019
- ^ Climate.gov, 23 June 2022: "Carbon cycle experts estimate that natural "sinks"—processes that remove carbon from the atmosphere—on land and in the ocean absorbed the equivalent of about half of the carbon dioxide we emitted each year in the 2011–2020 decade."
- ^ IPCC AR6 WG1 Technical Summary 2021, p. TS-122, Box TS.5, Figure 1
- ^ Melillo et al. 2017: Our first-order estimate of a warming-induced loss of 190 Pg of soil carbon over the 21st century is equivalent to the past two decades of carbon emissions from fossil fuel burning.
- ^ IPCC SRCCL Ch2 2019, pp. 133, 144.
- ^ USGCRP Chapter 2 2017, pp. 93–95.
- ^ Liu, Y.; Moore, J. K.; Primeau, F.; Wang, W. L. (22 December 2022). "Reduced CO2 uptake and growing nutrient sequestration from slowing overturning circulation". Nature Climate Change. 13: 83–90. doi:10.1038/s41558-022-01555-7. OSTI 2242376. S2CID 255028552.
- ^ IPCC AR6 WG1 Technical Summary 2021, pp. 58, 59: "Clouds remain the largest contribution to overall uncertainty in climate feedbacks."
- ^ Wolff et al. 2015: "the nature and magnitude of these feedbacks are the principal cause of uncertainty in the response of Earth's climate (over multi-decadal and longer periods) to a particular emissions scenario or greenhouse gas concentration pathway."
- ^ IPCC AR5 SYR Glossary 2014, p. 120.
- ^ Carbon Brief, 15 January 2018, "What are the different types of climate models?"
- ^ Wolff et al. 2015
- ^ Carbon Brief, 15 January 2018, "Who does climate modelling around the world?"
- ^ Carbon Brief, 15 January 2018, "What is a climate model?"
- ^ IPCC AR4 WG1 Ch8 2007, FAQ 8.1.
- ^ Stroeve et al. 2007; National Geographic, 13 August 2019
- ^ Liepert & Previdi 2009.
- ^ Rahmstorf et al. 2007; Mitchum et al. 2018
- ^ USGCRP Chapter 15 2017.
- ^ Hébert, R.; Herzschuh, U.; Laepple, T. (31 October 2022). "Millennial-scale climate variability over land overprinted by ocean temperature fluctuations". Nature Geoscience. 15 (1): 899–905. Bibcode:2022NatGe..15..899H. doi:10.1038/s41561-022-01056-4. PMC 7614181. PMID 36817575.
- ^ Carbon Brief, 15 January 2018, "What are the inputs and outputs for a climate model?"
- ^ Matthews et al. 2009
- ^ Carbon Brief, 19 April 2018; Meinshausen 2019, p. 462.
- ^ Hansen et al. 2016; Smithsonian, 26 June 2016.
- ^ USGCRP Chapter 15 2017, p. 415.
- ^ Scientific American, 29 April 2014; Burke & Stott 2017.
- ^ Liu, Fei; Wang, Bin; Ouyang, Yu; Wang, Hui; Qiao, Shaobo; Chen, Guosen; Dong, Wenjie (19 April 2022). "Intraseasonal variability of global land monsoon precipitation and its recent trend". npj Climate and Atmospheric Science. 5 (1): 30. Bibcode:2022npCAS...5...30L. doi:10.1038/s41612-022-00253-7. ISSN 2397-3722.
- ^ USGCRP Chapter 9 2017, p. 260.
- ^ Studholme, Joshua; Fedorov, Alexey V.; Gulev, Sergey K.; Emanuel, Kerry; Hodges, Kevin (29 December 2021). "Poleward expansion of tropical cyclone latitudes in warming climates". Nature Geoscience. 15: 14–28. doi:10.1038/s41561-021-00859-1. S2CID 245540084.
- ^ "Hurricanes and Climate Change". Center for Climate and Energy Solutions. 10 July 2020.
- ^ NOAA 2017.
- ^ WMO 2021, p. 12.
- ^ IPCC AR6 WG2 2022, p. 1302
- ^ DeConto & Pollard 2016
- ^ Bamber et al. 2019.
- ^ Zhang et al. 2008
- ^ IPCC SROCC Summary for Policymakers 2019, p. 18
- ^ Doney et al. 2009.
- ^ Deutsch et al. 2011
- ^ IPCC SROCC Ch5 2019, p. 510; "Climate Change and Harmful Algal Blooms". EPA. 5 September 2013. Retrieved 11 September 2020.
- ^ "Tipping Elements – big risks in the Earth System". Potsdam Institute for Climate Impact Research. Retrieved 31 January 2024.
- ^ Jump up to: a b c Armstrong McKay, David I.; Staal, Arie; Abrams, Jesse F.; Winkelmann, Ricarda; Sakschewski, Boris; Loriani, Sina; Fetzer, Ingo; Cornell, Sarah E.; Rockström, Johan; Lenton, Timothy M. (9 September 2022). "Exceeding 1.5 °C global warming could trigger multiple climate tipping points". Science. 377 (6611): eabn7950. doi:10.1126/science.abn7950. hdl:10871/131584. ISSN 0036-8075. PMID 36074831. S2CID 252161375.
- ^ IPCC SR15 Ch3 2018, p. 283.
- ^ Pearce, Rosamund; Prater, Tom (10 February 2020). "Nine Tipping Points That Could Be Triggered by Climate Change". CarbonBrief. Retrieved 27 May 2022.
- ^ Bochow, Nils; Poltronieri, Anna; Robinson, Alexander; Montoya, Marisa; Rypdal, Martin; Boers, Niklas (18 October 2023). "Overshooting the critical threshold for the Greenland ice sheet". Nature. 622 (7983): 528–536. Bibcode:2023Natur.622..528B. doi:10.1038/s41586-023-06503-9. PMC 10584691. PMID 37853149.
- ^ IPCC AR6 WG1 Summary for Policymakers 2021, p. 21
- ^ IPCC AR5 WG1 Ch12 2013, pp. 88–89, FAQ 12.3
- ^ Smith et al. 2009; Levermann et al. 2013
- ^ IPCC AR5 WG1 Ch12 2013, p. 1112.
- ^ Oschlies, Andreas (16 April 2021). "A committed fourfold increase in ocean oxygen loss". Nature Communications. 12 (1): 2307. Bibcode:2021NatCo..12.2307O. doi:10.1038/s41467-021-22584-4. PMC 8052459. PMID 33863893.
- ^ Lau, Sally C. Y.; Wilson, Nerida G.; Golledge, Nicholas R.; Naish, Tim R.; Watts, Phillip C.; Silva, Catarina N. S.; Cooke, Ira R.; Allcock, A. Louise; Mark, Felix C.; Linse, Katrin (21 December 2023). "Genomic evidence for West Antarctic Ice Sheet collapse during the Last Interglacial" (PDF). Science. 382 (6677): 1384–1389. Bibcode:2023Sci...382.1384L. doi:10.1126/science.ade0664. PMID 38127761. S2CID 266436146.
- ^ A. Naughten, Kaitlin; R. Holland, Paul; De Rydt, Jan (23 October 2023). "Unavoidable future increase in West Antarctic ice-shelf melting over the twenty-first century". Nature Climate Change. 13 (11): 1222–1228. Bibcode:2023NatCC..13.1222N. doi:10.1038/s41558-023-01818-x. S2CID 264476246.
- ^ IPCC SR15 Ch3 2018, p. 218.
- ^ Martins, Paulo Mateus; Anderson, Marti J.; Sweatman, Winston L.; Punnett, Andrew J. (9 April 2024). "Significant shifts in latitudinal optima of North American birds". Proceedings of the National Academy of Sciences of the United States of America. 121 (15): e2307525121. Bibcode:2024PNAS..12107525M. doi:10.1073/pnas.2307525121. ISSN 0027-8424. PMC 11009622. PMID 38557189.
- ^ IPCC SRCCL Ch2 2019, p. 133.
- ^ Deng, Yuanhong; Li, Xiaoyan; Shi, Fangzhong; Hu, Xia (December 2021). "Woody plant encroachment enhanced global vegetation greening and ecosystem water-use efficiency". Global Ecology and Biogeography. 30 (12): 2337–2353. Bibcode:2021GloEB..30.2337D. doi:10.1111/geb.13386. ISSN 1466-822X. Retrieved 10 June 2024 – via Wiley Online Library.
- ^ IPCC SRCCL Summary for Policymakers 2019, p. 7; Zeng & Yoon 2009.
- ^ Turner et al. 2020, p. 1.
- ^ Urban 2015.
- ^ Poloczanska et al. 2013; Lenoir et al. 2020
- ^ Smale et al. 2019
- ^ IPCC SROCC Summary for Policymakers 2019, p. 13.
- ^ IPCC SROCC Ch5 2019, p. 510
- ^ IPCC SROCC Ch5 2019, p. 451.
- ^ Azevedo-Schmidt, Lauren; Meineke, Emily K.; Currano, Ellen D. (18 October 2022). "Insect herbivory within modern forests is greater than fossil localities". Proceedings of the National Academy of Sciences of the United States of America. 119 (42): e2202852119. Bibcode:2022PNAS..11902852A. doi:10.1073/pnas.2202852119. ISSN 0027-8424. PMC 9586316. PMID 36215482.
- ^ "Coral Reef Risk Outlook". National Oceanic and Atmospheric Administration. 2 January 2012. Retrieved 4 April 2020.
At present, local human activities, coupled with past thermal stress, threaten an estimated 75 percent of the world's reefs. By 2030, estimates predict more than 90% of the world's reefs will be threatened by local human activities, warming, and acidification, with nearly 60% facing high, very high, or critical threat levels.
- ^ Carbon Brief, 7 January 2020.
- ^ IPCC AR5 WG2 Ch28 2014, p. 1596: "Within 50 to 70 years, loss of hunting habitats may lead to elimination of polar bears from seasonally ice-covered areas, where two-thirds of their world population currently live."
- ^ "What a changing climate means for Rocky Mountain National Park". National Park Service. Retrieved 9 April 2020.
- ^ IPCC AR6 WG1 Summary for Policymakers 2021, p. SPM-23, Fig. SPM.6
- ^ Lenton, Timothy M.; Xu, Chi; Abrams, Jesse F.; Ghadiali, Ashish; Loriani, Sina; Sakschewski, Boris; Zimm, Caroline; Ebi, Kristie L.; Dunn, Robert R.; Svenning, Jens-Christian; Scheffer, Marten (2023). "Quantifying the human cost of global warming". Nature Sustainability. 6 (10): 1237–1247. Bibcode:2023NatSu...6.1237L. doi:10.1038/s41893-023-01132-6. hdl:10871/132650.
- ^ IPCC AR5 WG2 Ch18 2014, pp. 983, 1008
- ^ IPCC AR5 WG2 Ch19 2014, p. 1077.
- ^ IPCC AR5 SYR Summary for Policymakers 2014, p. 8, SPM 2
- ^ IPCC AR5 SYR Summary for Policymakers 2014, p. 13, SPM 2.3
- ^ WHO, Nov 2015
- ^ IPCC AR5 WG2 Ch11 2014, pp. 720–723
- ^ Watts et al. 2019, pp. 1836, 1848.
- ^ Costello et al. 2009; Watts et al. 2015; IPCC AR5 WG2 Ch11 2014, p. 713
- ^ Watts et al. 2019, pp. 1841, 1847.
- ^ WHO 2014: "Under a base case socioeconomic scenario, we estimate approximately 250 000 additional deaths due to climate change per year between 2030 and 2050. These numbers do not represent a prediction of the overall impacts of climate change on health, since we could not quantify several important causal pathways."
- ^ IPCC AR6 WG2 2022, p. 988
- ^ IPCC SRCCL Ch5 2019, p. 451.
- ^ Zhao et al. 2017; IPCC SRCCL Ch5 2019, p. 439
- ^ IPCC AR5 WG2 Ch7 2014, p. 488
- ^ IPCC SRCCL Ch5 2019, p. 462
- ^ IPCC SROCC Ch5 2019, p. 503.
- ^ Holding et al. 2016; IPCC AR5 WG2 Ch3 2014, pp. 232–233.
- ^ DeFries et al. 2019, p. 3; Krogstrup & Oman 2019, p. 10.
- ^ Jump up to: a b Women's leadership and gender equality in climate action and disaster risk reduction in Africa − A call for action. Accra: FAO & The African Risk Capacity (ARC) Group. 2021. doi:10.4060/cb7431en. ISBN 978-92-5-135234-2. S2CID 243488592.
- ^ IPCC AR5 WG2 Ch13 2014, pp. 796–797
- ^ IPCC AR6 WG2 2022, p. 725
- ^ Hallegatte et al. 2016, p. 12.
- ^ IPCC AR5 WG2 Ch13 2014, p. 796.
- ^ Grabe, Grose and Dutt, 2014; FAO, 2011; FAO, 2021a; Fisher and Carr, 2015; IPCC, 2014; Resurrección et al., 2019; UNDRR, 2019; Yeboah et al., 2019.
- ^ "Climate Change | United Nations For Indigenous Peoples". United Nations Department of Economic and Social Affairs. Retrieved 29 April 2022.
- ^ Mach et al. 2019.
- ^ Jump up to: a b The status of women in agrifood systems - Overview. Rome: FAO. 2023. doi:10.4060/cc5060en. S2CID 258145984.
- ^ IPCC SROCC Ch4 2019, p. 328.
- ^ UNHCR 2011, p. 3.
- ^ Matthews 2018, p. 399.
- ^ Balsari, Dresser & Leaning 2020
- ^ Flavell 2014, p. 38; Kaczan & Orgill-Meyer 2020
- ^ Serdeczny et al. 2016.
- ^ IPCC SRCCL Ch5 2019, pp. 439, 464.
- ^ National Oceanic and Atmospheric Administration. "What is nuisance flooding?". Retrieved 8 April 2020.
- ^ Kabir et al. 2016.
- ^ Van Oldenborgh et al. 2019.
- ^ IPCC AR5 SYR Glossary 2014, p. 125.
- ^ IPCC SR15 Summary for Policymakers 2018, p. 15
- ^ United Nations Environment Programme 2019, p. XX
- ^ IPCC AR6 WG3 2022, p. 300: "The global benefits of pathways limiting warming to 2 °C (>67%) outweigh global mitigation costs over the 21st century, if aggregated economic impacts of climate change are at the moderate to high end of the assessed range, and a weight consistent with economic theory is given to economic impacts over the long term. This holds true even without accounting for benefits in other sustainable development dimensions or nonmarket damages from climate change (medium confidence)."
- ^ IPCC SR15 Ch2 2018, p. 109.
- ^ Teske, ed. 2019, p. xxiii.
- ^ World Resources Institute, 8 August 2019
- ^ IPCC SR15 Ch3 2018, p. 266: "Where reforestation is the restoration of natural ecosystems, it benefits both carbon sequestration and conservation of biodiversity and ecosystem services."
- ^ Bui et al. 2018, p. 1068; IPCC SR15 Summary for Policymakers 2018, p. 17
- ^ IPCC SR15 2018, p. 34; IPCC SR15 Summary for Policymakers 2018, p. 17
- ^ IPCC SR15 Ch4 2018, pp. 347–352
- ^ Friedlingstein et al. 2019
- ^ Jump up to: a b United Nations Environment Programme 2019, p. 46; Vox, 20 September 2019; Sepulveda, Nestor A.; Jenkins, Jesse D.; De Sisternes, Fernando J.; Lester, Richard K. (2018). "The Role of Firm Low-Carbon Electricity Resources in Deep Decarbonization of Power Generation". Joule. 2 (11): 2403–2420. Bibcode:2018Joule...2.2403S. doi:10.1016/j.joule.2018.08.006.
- ^ IEA World Energy Outlook 2023, pp. 18
- ^ REN21 2020, p. 32, Fig.1.
- ^ IEA World Energy Outlook 2023, pp. 18, 26
- ^ The Guardian, 6 April 2020.
- ^ IEA 2021, p. 57, Fig 2.5; Teske et al. 2019, p. 180, Table 8.1
- ^ Our World in Data-Why did renewables become so cheap so fast?; IEA – Projected Costs of Generating Electricity 2020
- ^ "IPCC Working Group III report: Mitigation of Climate Change". Intergovernmental Panel on Climate Change. 4 April 2022. Retrieved 19 January 2024.
- ^ IPCC SR15 Ch2 2018, p. 131, Figure 2.15
- ^ Teske 2019, pp. 409–410.
- ^ United Nations Environment Programme 2019, p. XXIII, Table ES.3; Teske, ed. 2019, p. xxvii, Fig.5.
- ^ Jump up to: a b IPCC SR15 Ch2 2018, pp. 142–144; United Nations Environment Programme 2019, Table ES.3 & p. 49
- ^ "Transport emissions". Climate action. European Commission. 2016. Archived from the original on 10 October 2021. Retrieved 2 January 2022.
- ^ IPCC AR5 WG3 Ch9 2014, p. 697; NREL 2017, pp. vi, 12
- ^ Berrill et al. 2016.
- ^ IPCC SR15 Ch4 2018, pp. 324–325.
- ^ Gill, Matthew; Livens, Francis; Peakman, Aiden. "Nuclear Fission". In Letcher (2020), pp. 147–149.
- ^ Horvath, Akos; Rachlew, Elisabeth (January 2016). "Nuclear power in the 21st century: Challenges and possibilities". Ambio. 45 (Suppl 1): S38–49. Bibcode:2016Ambio..45S..38H. doi:10.1007/s13280-015-0732-y. ISSN 1654-7209. PMC 4678124. PMID 26667059.
- ^ "Hydropower". iea.org. International Energy Agency. Retrieved 12 October 2020.
Hydropower generation is estimated to have increased by over 2% in 2019 owing to continued recovery from drought in Latin America as well as strong capacity expansion and good water availability in China (...) capacity expansion has been losing speed. This downward trend is expected to continue, due mainly to less large-project development in China and Brazil, where concerns over social and environmental impacts have restricted projects.
- ^ Watts et al. 2019, p. 1854; WHO 2018, p. 27
- ^ Watts et al. 2019, p. 1837; WHO 2016
- ^ WHO 2018, p. 27; Vandyck et al. 2018; IPCC SR15 2018, p. 97: "Limiting warming to 1.5 °C can be achieved synergistically with poverty alleviation and improved energy security and can provide large public health benefits through improved air quality, preventing millions of premature deaths. However, specific mitigation measures, such as bioenergy, may result in trade-offs that require consideration."
- ^ IPCC AR6 WG3 2022, p. 300
- ^ IPCC SR15 Ch2 2018, p. 97
- ^ IPCC AR5 SYR Summary for Policymakers 2014, p. 29; IEA 2020b
- ^ IPCC SR15 Ch2 2018, p. 155, Fig. 2.27
- ^ IEA 2020b
- ^ IPCC SR15 Ch2 2018, p. 142
- ^ IPCC SR15 Ch2 2018, pp. 138–140
- ^ IPCC SR15 Ch2 2018, pp. 141–142
- ^ IPCC AR5 WG3 Ch9 2014, pp. 686–694.
- ^ World Resources Institute, December 2019, p. 1
- ^ World Resources Institute, December 2019, pp. 1, 3
- ^ IPCC SRCCL 2019, p. 22, B.6.2
- ^ IPCC SRCCL Ch5 2019, pp. 487, 488, FIGURE 5.12 Humans on a vegan exclusive diet would save about 7.9 GtCO2 equivalent per year by 2050 IPCC AR6 WG1 Technical Summary 2021, p. 51 Agriculture, Forestry and Other Land Use used an average of 12 GtCO2 per year between 2007 and 2016 (23% of total anthropogenic emissions).
- ^ IPCC SRCCL Ch5 2019, pp. 82, 162, FIGURE 1.1
- ^ "Low and zero emissions in the steel and cement industries" (PDF). pp. 11, 19–22.
- ^ World Resources Institute, 8 August 2019: IPCC SRCCL Ch2 2019, pp. 189–193.
- ^ Kreidenweis et al. 2016
- ^ National Academies of Sciences, Engineering, and Medicine 2019, pp. 95–102
- ^ National Academies of Sciences, Engineering, and Medicine 2019, pp. 45–54
- ^ Nelson, J. D. J.; Schoenau, J. J.; Malhi, S. S. (1 October 2008). "Soil organic carbon changes and distribution in cultivated and restored grassland soils in Saskatchewan". Nutrient Cycling in Agroecosystems. 82 (2): 137–148. Bibcode:2008NCyAg..82..137N. doi:10.1007/s10705-008-9175-1. ISSN 1573-0867. S2CID 24021984.
- ^ Ruseva et al. 2020
- ^ IPCC SR15 Ch4 2018, pp. 326–327; Bednar, Obersteiner & Wagner 2019; European Commission, 28 November 2018, p. 188
- ^ Bui et al. 2018, p. 1068.
- ^ IPCC AR5 SYR 2014, p. 125; Bednar, Obersteiner & Wagner 2019.
- ^ IPCC SR15 2018, p. 34
- ^ IPCC, 2022: Summary for Policymakers [H.-O. Pörtner, D.C. Roberts, E.S. Poloczanska, K. Mintenbeck, M. Tignor, A. Alegría, M. Craig, S. Langsdorf, S. Löschke, V. Möller, A. Okem (eds.)]. In: Climate Change 2022: Impacts, Adaptation and Vulnerability. Contribution of Working Group II to the Sixth Assessment Report of the Intergovernmental Panel on Climate Change [H.-O. Pörtner, D.C. Roberts, M. Tignor, E.S. Poloczanska, K. Mintenbeck, A. Alegría, M. Craig, S. Langsdorf, S. Löschke, V. Möller, A. Okem, B. Rama (eds.)]. Cambridge University Press, Cambridge and New York, pp. 3–33, doi:10.1017/9781009325844.001.
- ^ IPCC AR5 SYR 2014, p. 17.
- ^ IPCC SR15 Ch4 2018, pp. 396–397.
- ^ IPCC AR4 WG2 Ch19 2007, p. 796.
- ^ UNEP 2018, pp. xii–xiii.
- ^ Stephens, Scott A.; Bell, Robert G.; Lawrence, Judy (2018). "Developing signals to trigger adaptation to sea-level rise". Environmental Research Letters. 13 (10). 104004. Bibcode:2018ERL....13j4004S. doi:10.1088/1748-9326/aadf96. ISSN 1748-9326.
- ^ Matthews 2018, p. 402.
- ^ IPCC SRCCL Ch5 2019, p. 439.
- ^ Surminski, Swenja; Bouwer, Laurens M.; Linnerooth-Bayer, Joanne (2016). "How insurance can support climate resilience". Nature Climate Change. 6 (4): 333–334. Bibcode:2016NatCC...6..333S. doi:10.1038/nclimate2979. ISSN 1758-6798.
- ^ IPCC SR15 Ch4 2018, pp. 336–337.
- ^ "Mangroves against the storm". Shorthand. Retrieved 20 January 2023.
- ^ "How marsh grass could help protect us from climate change". World Economic Forum. 24 October 2021. Retrieved 20 January 2023.
- ^ Morecroft, Michael D.; Duffield, Simon; Harley, Mike; Pearce-Higgins, James W.; et al. (2019). "Measuring the success of climate change adaptation and mitigation in terrestrial ecosystems". Science. 366 (6471): eaaw9256. doi:10.1126/science.aaw9256. ISSN 0036-8075. PMID 31831643. S2CID 209339286.
- ^ Berry, Pam M.; Brown, Sally; Chen, Minpeng; Kontogianni, Areti; et al. (2015). "Cross-sectoral interactions of adaptation and mitigation measures". Climate Change. 128 (3): 381–393. Bibcode:2015ClCh..128..381B. doi:10.1007/s10584-014-1214-0. hdl:10.1007/s10584-014-1214-0. ISSN 1573-1480. S2CID 153904466.
- ^ IPCC AR5 SYR 2014, p. 54.
- ^ Sharifi, Ayyoob (2020). "Trade-offs and conflicts between urban climate change mitigation and adaptation measures: A literature review". Journal of Cleaner Production. 276: 122813. Bibcode:2020JCPro.27622813S. doi:10.1016/j.jclepro.2020.122813. ISSN 0959-6526. S2CID 225638176.
- ^ IPCC AR5 SYR Summary for Policymakers 2014, p. 17, Section 3
- ^ IPCC SR15 Ch5 2018, p. 447; United Nations (2017) Resolution adopted by the General Assembly on 6 July 2017, Work of the Statistical Commission pertaining to the 2030 Agenda for Sustainable Development (A/RES/71/313)
- ^ IPCC SR15 Ch5 2018, p. 477.
- ^ Rauner et al. 2020
- ^ Mercure et al. 2018
- ^ World Bank, June 2019, p. 12, Box 1
- ^ Union of Concerned Scientists, 8 January 2017; Hagmann, Ho & Loewenstein 2019.
- ^ Watts et al. 2019, p. 1866
- ^ UN Human Development Report 2020, p. 10
- ^ International Institute for Sustainable Development 2019, p. iv
- ^ ICCT 2019, p. iv; Natural Resources Defense Council, 29 September 2017
- ^ National Conference of State Legislators, 17 April 2020; European Parliament, February 2020
- ^ Gabbatiss, Josh; Tandon, Ayesha (4 October 2021). "In-depth Q&A: What is 'climate justice'?". Carbon Brief. Retrieved 16 October 2021.
- ^ Khalfan, Ashfaq; Lewis, Astrid Nilsson; Aguilar, Carlos; Persson, Jacqueline; Lawson, Max; Dab, Nafkote; Jayoussi, Safa; Acharya, Sunil (November 2023). "Climate Equality: A planet for the 99%" (PDF). Oxfam Digital Repository. Oxfam GB. doi:10.21201/2023.000001. Retrieved 18 December 2023.
- ^ Grasso, Marco; Heede, Richard (19 May 2023). "Time to pay the piper: Fossil fuel companies' reparations for climate damages". One Earth. 6 (5): 459–463. Bibcode:2023OEart...6..459G. doi:10.1016/j.oneear.2023.04.012. hdl:10281/416137. S2CID 258809532.
- ^ Carbon Brief, 4 Jan 2017.
- ^ Jump up to: a b Friedlingstein et al. 2019, Table 7.
- ^ UNFCCC, "What is the United Nations Framework Convention on Climate Change?"
- ^ UNFCCC 1992, Article 2.
- ^ IPCC AR4 WG3 Ch1 2007, p. 97.
- ^ EPA 2019.
- ^ UNFCCC, "What are United Nations Climate Change Conferences?"
- ^ Kyoto Protocol 1997; Liverman 2009, p. 290.
- ^ Dessai 2001, p. 4; Grubb 2003.
- ^ Liverman 2009, p. 290.
- ^ Müller 2010; The New York Times, 25 May 2015; UNFCCC: Copenhagen 2009; EUobserver, 20 December 2009.
- ^ UNFCCC: Copenhagen 2009.
- ^ Conference of the Parties to the Framework Convention on Climate Change. Copenhagen. 7–18 December 2009. un document= FCCC/CP/2009/L.7. Archived from the original on 18 October 2010. Retrieved 24 October 2010.
- ^ Bennett, Paige (2 May 2023). "High-Income Nations Are on Track Now to Meet $100 Billion Climate Pledges, but They're Late". Ecowatch. Retrieved 10 May 2023.
- ^ Paris Agreement 2015.
- ^ Climate Focus 2015, p. 3; Carbon Brief, 8 October 2018.
- ^ Climate Focus 2015, p. 5.
- ^ "Status of Treaties, United Nations Framework Convention on Climate Change". United Nations Treaty Collection. Retrieved 13 October 2021.; Salon, 25 September 2019.
- ^ Goyal et al. 2019
- ^ Yeo, Sophie (10 October 2016). "Explainer: Why a UN climate deal on HFCs matters". Carbon Brief. Retrieved 10 January 2021.
- ^ BBC, 1 May 2019; Vice, 2 May 2019.
- ^ The Verge, 27 December 2019.
- ^ The Guardian, 28 November 2019
- ^ Politico, 11 December 2019.
- ^ "European Green Deal: Commission proposes transformation of EU economy and society to meet climate ambitions". European Commission. 14 July 2021.
- ^ The Guardian, 28 October 2020
- ^ "India". Climate Action Tracker. 15 September 2021. Retrieved 3 October 2021.
- ^ Do, Thang Nam; Burke, Paul J. (2023). "Phasing out coal power in a developing country context: Insights from Vietnam". Energy Policy. 176 (May 2023 113512): 113512. Bibcode:2023EnPol.17613512D. doi:10.1016/j.enpol.2023.113512. hdl:1885/286612. S2CID 257356936.
- ^ UN NDC Synthesis Report 2021, pp. 4–5; UNFCCC Press Office (26 February 2021). "Greater Climate Ambition Urged as Initial NDC Synthesis Report Is Published". Retrieved 21 April 2021.
- ^ Stover 2014.
- ^ Dunlap & McCright 2011, pp. 144, 155; Björnberg et al. 2017
- ^ Oreskes & Conway 2010; Björnberg et al. 2017
- ^ O'Neill & Boykoff 2010; Björnberg et al. 2017
- ^ Jump up to: a b Björnberg et al. 2017
- ^ Dunlap & McCright 2015, p. 308.
- ^ Dunlap & McCright 2011, p. 146.
- ^ Harvey et al. 2018
- ^ "Public perceptions on climate change" (PDF). PERITIA Trust EU – The Policy Institute of King's College London. June 2022. p. 4. Archived (PDF) from the original on 15 July 2022.
- ^ Powell, James (20 November 2019). "Scientists Reach 100% Consensus on Anthropogenic Global Warming". Bulletin of Science, Technology & Society. 37 (4): 183–184. doi:10.1177/0270467619886266. S2CID 213454806.
- ^ Myers, Krista F.; Doran, Peter T.; Cook, John; Kotcher, John E.; Myers, Teresa A. (20 October 2021). "Consensus revisited: quantifying scientific agreement on climate change and climate expertise among Earth scientists 10 years later". Environmental Research Letters. 16 (10): 104030. Bibcode:2021ERL....16j4030M. doi:10.1088/1748-9326/ac2774. S2CID 239047650.
- ^ Jump up to: a b Weart "The Public and Climate Change (since 1980)"
- ^ Newell 2006, p. 80; Yale Climate Connections, 2 November 2010
- ^ Pew 2015, p. 10.
- ^ Jump up to: a b Pew 2020.
- ^ Pew 2015, p. 15.
- ^ Yale 2021, p. 7.
- ^ Yale 2021, p. 9; UNDP 2021, p. 15.
- ^ Smith & Leiserowitz 2013, p. 943.
- ^ Gunningham 2018.
- ^ The Guardian, 19 March 2019; Boulianne, Lalancette & Ilkiw 2020.
- ^ Deutsche Welle, 22 June 2019.
- ^ Connolly, Kate (29 April 2021). "'Historic' German ruling says climate goals not tough enough". The Guardian. Retrieved 1 May 2021.
- ^ Setzer & Byrnes 2019.
- ^ "Coal Consumption Affecting Climate". Rodney and Otamatea Times, Waitemata and Kaipara Gazette. Warkworth, New Zealand. 14 August 1912. p. 7. Text was earlier published in Popular Mechanics, March 1912, p. 341.
- ^ Nord, D.C. (2020). Nordic Perspectives on the Responsible Development of the Arctic: Pathways to Action. Springer Polar Sciences. Springer International Publishing. p. 51. ISBN 978-3-030-52324-4. Retrieved 11 March 2023.
- ^ Mukherjee, A.; Scanlon, B.R.; Aureli, A.; Langan, S.; Guo, H.; McKenzie, A.A. (2020). Global Groundwater: Source, Scarcity, Sustainability, Security, and Solutions. Elsevier Science. p. 331. ISBN 978-0-12-818173-7. Retrieved 11 March 2023.
- ^ von Humboldt, A.; Wulf, A. (2018). Selected Writings of Alexander von Humboldt: Edited and Introduced by Andrea Wulf. Everyman's Library Classics Series. Knopf Doubleday Publishing Group. p. 10. ISBN 978-1-101-90807-5. Retrieved 11 March 2023.
- ^ Erdkamp, P.; Manning, J.G.; Verboven, K. (2021). Climate Change and Ancient Societies in Europe and the Near East: Diversity in Collapse and Resilience. Palgrave Studies in Ancient Economies. Springer International Publishing. p. 6. ISBN 978-3-030-81103-7. Retrieved 11 March 2023.
- ^ Archer & Pierrehumbert 2013, pp. 10–14
- ^ Foote, Eunice (November 1856). "Circumstances affecting the Heat of the Sun's Rays". The American Journal of Science and Arts. 22: 382–383. Retrieved 31 January 2016 – via Google Books.
- ^ Huddleston 2019
- ^ Tyndall 1861.
- ^ Archer & Pierrehumbert 2013, pp. 39–42; Fleming 2008, Tyndall
- ^ Lapenis 1998.
- ^ Jump up to: a b c Weart "The Carbon Dioxide Greenhouse Effect"; Fleming 2008, Arrhenius
- ^ Callendar 1938; Fleming 2007.
- ^ Cook, John; Oreskes, Naomi; Doran, Peter T.; Anderegg, William R. L.; et al. (2016). "Consensus on consensus: a synthesis of consensus estimates on human-caused global warming". Environmental Research Letters. 11 (4): 048002. Bibcode:2016ERL....11d8002C. doi:10.1088/1748-9326/11/4/048002. hdl:1983/34949783-dac1-4ce7-ad95-5dc0798930a6.
- ^ Jump up to: a b Powell, James (20 November 2019). "Scientists Reach 100% Consensus on Anthropogenic Global Warming". Bulletin of Science, Technology & Society. 37 (4): 183–184. doi:10.1177/0270467619886266. S2CID 213454806. Retrieved 15 November 2020.
- ^ Jump up to: a b c Lynas, Mark; Houlton, Benjamin Z; Perry, Simon (2021). "Greater than 99% consensus on human caused climate change in the peer-reviewed scientific literature". Environmental Research Letters. 16 (11): 114005. Bibcode:2021ERL....16k4005L. doi:10.1088/1748-9326/ac2966. ISSN 1748-9326. S2CID 239032360.
- ^ Myers, Krista F.; Doran, Peter T.; Cook, John; Kotcher, John E.; Myers, Teresa A. (20 October 2021). "Consensus revisited: quantifying scientific agreement on climate change and climate expertise among Earth scientists 10 years later". Environmental Research Letters. 16 (10): 104030. Bibcode:2021ERL....16j4030M. doi:10.1088/1748-9326/ac2774. S2CID 239047650.
- ^ Weart "Suspicions of a Human-Caused Greenhouse (1956–1969)"
- ^ Weart 2013, p. 3567.
- ^ Royal Society 2005.
- ^ National Academies 2008, p. 2; Oreskes 2007, p. 68; Gleick, 7 January 2017
- ^ Joint statement of the G8+5 Academies (2009); Gleick, 7 January 2017.
Sources
![]() This article incorporates text from a free content work. Licensed under CC BY-SA 3.0 (license statement/permission). Text taken from The status of women in agrifood systems – Overview, FAO, FAO.
This article incorporates text from a free content work. Licensed under CC BY-SA 3.0 (license statement/permission). Text taken from The status of women in agrifood systems – Overview, FAO, FAO.
IPCC reports
Fourth Assessment Report
- IPCC (2007). Solomon, S.; Qin, D.; Manning, M.; Chen, Z.; et al. (eds.). Climate Change 2007: The Physical Science Basis. Contribution of Working Group I to the Fourth Assessment Report of the Intergovernmental Panel on Climate Change. Cambridge University Press. ISBN 978-0-521-88009-1.
- Le Treut, H.; Somerville, R.; Cubasch, U.; Ding, Y.; et al. (2007). "Chapter 1: Historical Overview of Climate Change Science" (PDF). IPCC AR4 WG1 2007. pp. 93–127.
- Randall, D. A.; Wood, R. A.; Bony, S.; Colman, R.; et al. (2007). "Chapter 8: Climate Models and their Evaluation" (PDF). IPCC AR4 WG1 2007. pp. 589–662.
- Hegerl, G. C.; Zwiers, F. W.; Braconnot, P.; Gillett, N. P.; et al. (2007). "Chapter 9: Understanding and Attributing Climate Change" (PDF). IPCC AR4 WG1 2007. pp. 663–745.
- IPCC (2007). Parry, M. L.; Canziani, O. F.; Palutikof, J. P.; van der Linden, P. J.; et al. (eds.). Climate Change 2007: Impacts, Adaptation and Vulnerability. Contribution of Working Group II to the Fourth Assessment Report of the Intergovernmental Panel on Climate Change. Cambridge University Press. ISBN 978-0-521-88010-7.
- Schneider, S. H.; Semenov, S.; Patwardhan, A.; Burton, I.; et al. (2007). "Chapter 19: Assessing key vulnerabilities and the risk from climate change" (PDF). IPCC AR4 WG2 2007. pp. 779–810.
- IPCC (2007). Metz, B.; Davidson, O. R.; Bosch, P. R.; Dave, R.; et al. (eds.). Climate Change 2007: Mitigation of Climate Change. Contribution of Working Group III to the Fourth Assessment Report of the Intergovernmental Panel on Climate Change. Cambridge University Press. ISBN 978-0-521-88011-4.
- Rogner, H.-H.; Zhou, D.; Bradley, R.; Crabbé, P.; et al. (2007). "Chapter 1: Introduction" (PDF). IPCC AR4 WG3 2007. pp. 95–116.
Fifth Assessment report
- IPCC (2013). Stocker, T. F.; Qin, D.; Plattner, G.-K.; Tignor, M.; et al. (eds.). Climate Change 2013: The Physical Science Basis (PDF). Contribution of Working Group I to the Fifth Assessment Report of the Intergovernmental Panel on Climate Change. Cambridge, UK & New York: Cambridge University Press. ISBN 978-1-107-05799-9.. AR5 Climate Change 2013: The Physical Science Basis – IPCC
- IPCC (2013). "Summary for Policymakers" (PDF). IPCC AR5 WG1 2013.
- Hartmann, D. L.; Klein Tank, A. M. G.; Rusticucci, M.; Alexander, L. V.; et al. (2013). "Chapter 2: Observations: Atmosphere and Surface" (PDF). IPCC AR5 WG1 2013. pp. 159–254.
- Rhein, M.; Rintoul, S. R.; Aoki, S.; Campos, E.; et al. (2013). "Chapter 3: Observations: Ocean" (PDF). IPCC AR5 WG1 2013. pp. 255–315.
- Masson-Delmotte, V.; Schulz, M.; Abe-Ouchi, A.; Beer, J.; et al. (2013). "Chapter 5: Information from Paleoclimate Archives" (PDF). IPCC AR5 WG1 2013. pp. 383–464.
- Bindoff, N. L.; Stott, P. A.; AchutaRao, K. M.; Allen, M. R.; et al. (2013). "Chapter 10: Detection and Attribution of Climate Change: from Global to Regional" (PDF). IPCC AR5 WG1 2013. pp. 867–952.
- Collins, M.; Knutti, R.; Arblaster, J. M.; Dufresne, J.-L.; et al. (2013). "Chapter 12: Long-term Climate Change: Projections, Commitments and Irreversibility" (PDF). IPCC AR5 WG1 2013. pp. 1029–1136.
- IPCC (2014). Field, C. B.; Barros, V. R.; Dokken, D. J.; Mach, K. J.; et al. (eds.). Climate Change 2014: Impacts, Adaptation, and Vulnerability. Part A: Global and Sectoral Aspects. Contribution of Working Group II to the Fifth Assessment Report of the Intergovernmental Panel on Climate Change. Cambridge University Press. ISBN 978-1-107-05807-1.. Chapters 1–20, SPM, and Technical Summary.
- Jiménez Cisneros, B. E.; Oki, T.; Arnell, N. W.; Benito, G.; et al. (2014). "Chapter 3: Freshwater Resources" (PDF). IPCC AR5 WG2 A 2014. pp. 229–269.
- Porter, J. R.; Xie, L.; Challinor, A. J.; Cochrane, K.; et al. (2014). "Chapter 7: Food Security and Food Production Systems" (PDF). IPCC AR5 WG2 A 2014. pp. 485–533.
- Smith, K. R.; Woodward, A.; Campbell-Lendrum, D.; Chadee, D. D.; et al. (2014). "Chapter 11: Human Health: Impacts, Adaptation, and Co-Benefits" (PDF). In IPCC AR5 WG2 A 2014. pp. 709–754.
- Olsson, L.; Opondo, M.; Tschakert, P.; Agrawal, A.; et al. (2014). "Chapter 13: Livelihoods and Poverty" (PDF). IPCC AR5 WG2 A 2014. pp. 793–832.
- Cramer, W.; Yohe, G. W.; Auffhammer, M.; Huggel, C.; et al. (2014). "Chapter 18: Detection and Attribution of Observed Impacts" (PDF). IPCC AR5 WG2 A 2014. pp. 979–1037.
- Oppenheimer, M.; Campos, M.; Warren, R.; Birkmann, J.; et al. (2014). "Chapter 19: Emergent Risks and Key Vulnerabilities" (PDF). IPCC AR5 WG2 A 2014. pp. 1039–1099.
- IPCC (2014). Barros, V. R.; Field, C. B.; Dokken, D. J.; Mach, K. J.; et al. (eds.). Climate Change 2014: Impacts, Adaptation, and Vulnerability. Part B: Regional Aspects (PDF). Contribution of Working Group II to the Fifth Assessment Report of the Intergovernmental Panel on Climate Change. Cambridge, UK & New York: Cambridge University Press. ISBN 978-1-107-05816-3.. Chapters 21–30, Annexes, and Index.
- Larsen, J. N.; Anisimov, O. A.; Constable, A.; Hollowed, A. B.; et al. (2014). "Chapter 28: Polar Regions" (PDF). IPCC AR5 WG2 B 2014. pp. 1567–1612.
- IPCC (2014). Edenhofer, O.; Pichs-Madruga, R.; Sokona, Y.; Farahani, E.; et al. (eds.). Climate Change 2014: Mitigation of Climate Change. Contribution of Working Group III to the Fifth Assessment Report of the Intergovernmental Panel on Climate Change. Cambridge, UK & New York, NY: Cambridge University Press. ISBN 978-1-107-05821-7.
- Blanco, G.; Gerlagh, R.; Suh, S.; Barrett, J.; et al. (2014). "Chapter 5: Drivers, Trends and Mitigation" (PDF). IPCC AR5 WG3 2014. pp. 351–411.
- Lucon, O.; Ürge-Vorsatz, D.; Ahmed, A.; Akbari, H.; et al. (2014). "Chapter 9: Buildings" (PDF). IPCC AR5 WG3 2014.
- Edenhofer, O.; Pichs-Madruga, R.; Sokona, Y.; Farahani, E.; et al. (2014). "Annex III: Technology-specific Cost and Performance Parameters" (PDF). IPCC AR5 WG3 2014. Cambridge, United Kingdom and New York, NY, USA: Cambridge University Press.
- IPCC AR5 SYR (2014). The Core Writing Team; Pachauri, R. K.; Meyer, L. A. (eds.). Climate Change 2014: Synthesis Report. Contribution of Working Groups I, II and III to the Fifth Assessment Report of the Intergovernmental Panel on Climate Change. Geneva, Switzerland: IPCC.
{{cite book}}: CS1 maint: numeric names: authors list (link)- IPCC (2014). "Summary for Policymakers" (PDF). IPCC AR5 SYR 2014.
- IPCC (2014). "Annex II: Glossary" (PDF). IPCC AR5 SYR 2014.
Special Report: Global Warming of 1.5 °C
- IPCC (2018). Masson-Delmotte, V.; Zhai, P.; Pörtner, H.-O.; Roberts, D.; et al. (eds.). Global Warming of 1.5 °C. An IPCC Special Report on the impacts of global warming of 1.5 °C above pre-industrial levels and related global greenhouse gas emission pathways, in the context of strengthening the global response to the threat of climate change, sustainable development, and efforts to eradicate poverty (PDF). Intergovernmental Panel on Climate Change. Global Warming of 1.5 °C –.
- IPCC (2018). "Summary for Policymakers" (PDF). IPCC SR15 2018. pp. 3–24.
- Allen, M. R.; Dube, O. P.; Solecki, W.; Aragón-Durand, F.; et al. (2018). "Chapter 1: Framing and Context" (PDF). IPCC SR15 2018. pp. 49–91.
- Rogelj, J.; Shindell, D.; Jiang, K.; Fifta, S.; et al. (2018). "Chapter 2: Mitigation Pathways Compatible with 1.5 °C in the Context of Sustainable Development" (PDF). IPCC SR15 2018. pp. 93–174.
- Hoegh-Guldberg, O.; Jacob, D.; Taylor, M.; Bindi, M.; et al. (2018). "Chapter 3: Impacts of 1.5 °C Global Warming on Natural and Human Systems" (PDF). IPCC SR15 2018. pp. 175–311.
- de Coninck, H.; Revi, A.; Babiker, M.; Bertoldi, P.; et al. (2018). "Chapter 4: Strengthening and Implementing the Global Response" (PDF). IPCC SR15 2018. pp. 313–443.
- Roy, J.; Tschakert, P.; Waisman, H.; Abdul Halim, S.; et al. (2018). "Chapter 5: Sustainable Development, Poverty Eradication and Reducing Inequalities" (PDF). IPCC SR15 2018. pp. 445–538.
Special Report: Climate change and Land
- IPCC (2019). Shukla, P. R.; Skea, J.; Calvo Buendia, E.; Masson-Delmotte, V.; et al. (eds.). IPCC Special Report on Climate Change, Desertification, Land Degradation, Sustainable Land Management, Food Security, and Greenhouse gas fluxes in Terrestrial Ecosystems (PDF). In press.
- IPCC (2019). "Summary for Policymakers" (PDF). IPCC SRCCL 2019. pp. 3–34.
- Jia, G.; Shevliakova, E.; Artaxo, P. E.; De Noblet-Ducoudré, N.; et al. (2019). "Chapter 2: Land-Climate Interactions" (PDF). IPCC SRCCL 2019. pp. 131–247.
- Mbow, C.; Rosenzweig, C.; Barioni, L. G.; Benton, T.; et al. (2019). "Chapter 5: Food Security" (PDF). IPCC SRCCL 2019. pp. 437–550.
Special Report: The Ocean and Cryosphere in a Changing Climate
- IPCC (2019). Pörtner, H.-O.; Roberts, D. C.; Masson-Delmotte, V.; Zhai, P.; et al. (eds.). IPCC Special Report on the Ocean and Cryosphere in a Changing Climate (PDF). In press.
- IPCC (2019). "Summary for Policymakers" (PDF). IPCC SROCC 2019. pp. 3–35.
- Oppenheimer, M.; Glavovic, B.; Hinkel, J.; van de Wal, R.; et al. (2019). "Chapter 4: Sea Level Rise and Implications for Low Lying Islands, Coasts and Communities" (PDF). IPCC SROCC 2019. pp. 321–445.
- Bindoff, N. L.; Cheung, W. W. L.; Kairo, J. G.; Arístegui, J.; et al. (2019). "Chapter 5: Changing Ocean, Marine Ecosystems, and Dependent Communities" (PDF). IPCC SROCC 2019. pp. 447–587.
Sixth Assessment Report
- IPCC (2021). Masson-Delmotte, V.; Zhai, P.; Pirani, A.; Connors, S. L.; et al. (eds.). Climate Change 2021: The Physical Science Basis (PDF). Contribution of Working Group I to the Sixth Assessment Report of the Intergovernmental Panel on Climate Change. Cambridge, United Kingdom and New York, NY, US: Cambridge University Press (In Press).
- IPCC (2021). "Summary for Policymakers" (PDF). IPCC AR6 WG1 2021.
- Arias, Paola A.; Bellouin, Nicolas; Coppola, Erika; Jones, Richard G.; et al. (2021). "Technical Summary" (PDF). IPCC AR6 WG1 2021.
- Seneviratne, Sonia I.; Zhang, Xuebin; Adnan, M.; Badi, W.; et al. (2021). "Chapter 11: Weather and climate extreme events in a changing climate" (PDF). IPCC AR6 WG1 2021.
- IPCC (2022). Pörtner, H.-O.; Roberts, D.C.; Tignor, M.; Poloczanska, E.S.; Mintenbeck, K.; Alegría, A.; Craig, M.; Langsdorf, S.; Löschke, S.; Möller, V.; Okem, A.; Rama, B.; et al. (eds.). Climate Change 2022: Impacts, Adaptation and Vulnerability. Contribution of Working Group II to the Sixth Assessment Report of the Intergovernmental Panel on Climate Change. Cambridge University Press.
- IPCC (2022). Shukla, P.R.; Skea, J.; Slade, R.; Al Khourdajie, A.; et al. (eds.). Climate Change 2022: Mitigation of Climate Change. Contribution of Working Group III to the Sixth Assessment Report of the Intergovernmental Panel on Climate Change. Cambridge, UK and New York, NY, USA: Cambridge University Press. doi:10.1017/9781009157926. ISBN 978-1-009-15792-6.
- IPCC (2022). "Summary for Policymakers" (PDF). IPCC AR6 WG3 2022.
- IPCC (2023). Core Writing Team; Lee, H.; Romero, J.; et al. (eds.). IPCC, 2023: Climate Change 2023: Synthesis Report. Contribution of Working Groups I, II and III to the Sixth Assessment Report of the Intergovernmental Panel on Climate Change [Core Writing Team, H. Lee and J. Romero (Eds.)]. IPCC, Geneva, Switzerland (PDF). Geneva, Switzerland: IPCC. doi:10.59327/IPCC/AR6-9789291691647. hdl:1885/299630. ISBN 978-92-9169-164-7. S2CID 260074696.
- МГЭИК (2023 г.). «Резюме для политиков» (PDF) . МГЭИК AR6 SYR 2023 .
Другие рецензируемые источники
- Альбрехт, Брюс А. (1989). «Аэрозоли, микрофизика облаков и частичная облачность». Наука . 245 (4923): 1227–1239. Бибкод : 1989Sci...245.1227A . дои : 10.1126/science.245.4923.1227 . ПМИД 17747885 . S2CID 46152332 .
- Балсари, С.; Дрессер, К.; Лининг, Дж. (2020). «Изменение климата, миграция и гражданские беспорядки» . Представитель Curr Environ Health . 7 (4): 404–414. дои : 10.1007/s40572-020-00291-4 . ПМК 7550406 . ПМИД 33048318 .
- Бамбер, Джонатан Л.; Оппенгеймер, Майкл; Копп, Роберт Э.; Аспиналл, Вилли П.; Кук, Роджер М. (2019). «Вклад ледникового покрова в будущее повышение уровня моря на основании структурированного экспертного заключения» . Труды Национальной академии наук . 116 (23): 11195–11200. Бибкод : 2019PNAS..11611195B . дои : 10.1073/pnas.1817205116 . ISSN 0027-8424 . ПМК 6561295 . ПМИД 31110015 .
- Беднар, Йоханнес; Оберштайнер, Майкл; Вагнер, Фабиан (2019). «О финансовой целесообразности отрицательных выбросов» . Природные коммуникации . 10 (1): 1783. Бибкод : 2019NatCo..10.1783B . дои : 10.1038/s41467-019-09782-x . ISSN 2041-1723 . ПМК 6467865 . ПМИД 30992434 .
- Беррилл, П.; Арвесен, А.; Шольц, Ю.; Гилс, ХК; и др. (2016). «Экологические последствия сценариев с высоким уровнем проникновения возобновляемых источников энергии для Европы» . Письма об экологических исследованиях . 11 (1): 014012. Бибкод : 2016ERL....11a4012B . дои : 10.1088/1748-9326/11/1/014012 . HDL : 11250/2465014 .
- Бьёрнберг, Карин Эдвардссон; Карлссон, Микаэль; Гилек, Майкл; Ханссон, Свен Уве (2017). «Отрицание науки о климате и окружающей среде: обзор научной литературы, опубликованной в 1990–2015 годах» . Журнал чистого производства . 167 : 229–241. Бибкод : 2017JCPro.167..229B . дои : 10.1016/j.jclepro.2017.08.066 . ISSN 0959-6526 .
- Булианна, Шелли; Лалансетт, Мирей; Илкив, Дэвид (2020). « Школьная забастовка 4: Климат»: социальные сети и международный молодежный протест против изменения климата» . СМИ и коммуникация . 8 (2): 208–218. дои : 10.17645/mac.v8i2.2768 . ISSN 2183-2439 .
- Буй, М.; Аджиман, К. ; Бардоу, А.; Энтони, Эдвард Дж.; и др. (2018). «Улавливание и хранение углерода (CCS): путь вперед» . Энергетика и экология . 11 (5): 1062–1176. дои : 10.1039/c7ee02342a . hdl : 10044/1/55714 .
- Берк, Клэр; Стотт, Питер (2017). «Влияние антропогенного изменения климата на летние муссоны в Восточной Азии». Журнал климата . 30 (14): 5205–5220. arXiv : 1704.00563 . Бибкод : 2017JCli...30.5205B . дои : 10.1175/JCLI-D-16-0892.1 . ISSN 0894-8755 . S2CID 59509210 .
- Каллендар, Г.С. (1938). «Искусственное производство углекислого газа и его влияние на температуру». Ежеквартальный журнал Королевского метеорологического общества . 64 (275): 223–240. Бибкод : 1938QJRMS..64..223C . дои : 10.1002/qj.49706427503 .
- Каттанео, Кристина; Бейн, Мишель; Фрелих, Кристиана Дж.; Найвтон, Доминик; и др. (2019). «Миграция людей в эпоху изменения климата» . Обзор экономики и политики окружающей среды . 13 (2): 189–206. дои : 10.1093/reep/rez008 . hdl : 10.1093/reep/rez008 . ISSN 1750-6816 . S2CID 198660593 .
- Коэн, Иуда; Экран, Джеймс; Фуртадо, Джейсон С.; Барлоу, Мэтью; и др. (2014). «Недавнее усиление Арктики и экстремальная погода в средних широтах» (PDF) . Природа Геонауки . 7 (9): 627–637. Бибкод : 2014NatGe...7..627C . дои : 10.1038/ngeo2234 . ISSN 1752-0908 .
- Костелло, Энтони; Аббас, Мустафа; Аллен, Адриана; Болл, Сара; и др. (2009). «Управление последствиями изменения климата для здоровья» . Ланцет . 373 (9676): 1693–1733. дои : 10.1016/S0140-6736(09)60935-1 . ПМИД 19447250 . S2CID 205954939 . Архивировано из оригинала 13 августа 2017 года.
- Кертис, П.; Слей, К.; Харрис, Н.; Тюкавина А.; и др. (2018). «Классификация факторов глобальной утраты лесов» . Наука . 361 (6407): 1108–1111. Бибкод : 2018Sci...361.1108C . дои : 10.1126/science.aau3445 . ПМИД 30213911 . S2CID 52273353 .
- Дэвидсон, Эрик (2009). «Вклад азота навоза и удобрений в закись азота в атмосфере с 1860 года» . Природа Геонауки . 2 : 659–662. дои : 10.1016/j.chemer.2016.04.002 .
- ДеКонто, Роберт М.; Поллард, Дэвид (2016). «Вклад Антарктиды в прошлое и будущее повышение уровня моря». Природа . 531 (7596): 591–597. Бибкод : 2016Natur.531..591D . дои : 10.1038/nature17145 . ISSN 1476-4687 . ПМИД 27029274 . S2CID 205247890 .
- Дин, Джошуа Ф.; Мидделбург, Джек Дж.; Рёкманн, Томас; Аэртс, Риен; и др. (2018). «Обратная связь метана с глобальной климатической системой в более теплом мире» . Обзоры геофизики . 56 (1): 207–250. Бибкод : 2018RvGeo..56..207D . дои : 10.1002/2017RG000559 . hdl : 2066/195183 . ISSN 1944-9208 .
- Дойч, Кертис; Брикс, Хольгер; Ито, Така; Френцель, Хартмут; и др. (2011). «Климатическая изменчивость гипоксии океана» (PDF) . Наука . 333 (6040): 336–339. Бибкод : 2011Sci...333..336D . дои : 10.1126/science.1202422 . ПМИД 21659566 . S2CID 11752699 . Архивировано (PDF) из оригинала 9 мая 2016 года.
- Дони, Скотт С.; Фабри, Виктория Дж.; Фили, Ричард А.; Клейпас, Джоан А. (2009). «Закисление океана: другая проблема CO 2 ». Ежегодный обзор морской науки . 1 (1): 169–192. Бибкод : 2009ARMS....1..169D . дои : 10.1146/annurev.marine.010908.163834 . ПМИД 21141034 . S2CID 402398 .
- Фэйи, Д.В.; Доэрти, С.Дж.; Хиббард, Калифорния; Роману, А.; Тейлор, ПК (2017). «Глава 2: Физические факторы изменения климата» (PDF) . В USGCRP2017 .
- Фишер, Тобиас П.; Аюппа, Алессандро (2020). «Большой вызов столетия AGU: вулканы и глобальные выбросы углекислого газа в результате субаэрального вулканизма - недавний прогресс и будущие проблемы» . Геохимия, геофизика, геосистемы . 21 (3): e08690. Бибкод : 2020GGG....2108690F . дои : 10.1029/2019GC008690 . hdl : 10447/498846 . ISSN 1525-2027 .
- Фридлингштейн, Пьер; Джонс, Мэтью В.; О'Салливан, Майкл; Эндрю, Робби М.; и др. (2019). «Глобальный углеродный бюджет 2019» . Данные науки о системе Земли . 11 (4): 1783–1838. Бибкод : 2019ESSD...11.1783F . дои : 10.5194/essd-11-1783-2019 . hdl : 10871/39943 . ISSN 1866-3508 .
- Гоял, Ришав; Англия, Мэтью Х; Сен Гупта, Алекс; Джакер, Мартин (2019). «Уменьшение изменения приземного климата, достигнутое Монреальским протоколом 1987 года» . Письма об экологических исследованиях . 14 (12): 124041. Бибкод : 2019ERL....14l4041G . дои : 10.1088/1748-9326/ab4874 . hdl : 1959.4/unsworks_66865 . ISSN 1748-9326 .
- Грабб, М. (2003). «Экономика Киотского протокола» (PDF) . Мировая экономика . 4 (3): 144–145. Архивировано из оригинала (PDF) 4 сентября 2012 года.
- Ганнингем, Нил (2018). «Мобилизация гражданского общества: может ли климатическое движение добиться трансформационных социальных изменений?» (PDF) . Интерфейс: журнал о социальных движениях и о них . 10 . Архивировано (PDF) из оригинала 12 апреля 2019 г. Проверено 12 апреля 2019 г.
- Хагманн, Дэвид; Хо, Эмили Х.; Левенштейн, Джордж (2019). «Отказ от поддержки налога на выбросы углерода». Природа Изменение климата . 9 (6): 484–489. Бибкод : 2019NatCC...9..484H . дои : 10.1038/s41558-019-0474-0 . S2CID 182663891 .
- Хансен, Джеймс; Сато, Макико; Сердечный, Пол; Руди, Рето; и др. (2016). «Таяние льда, повышение уровня моря и суперштормы: данные палеоклиматических данных, климатическое моделирование и современные наблюдения свидетельствуют о том, что глобальное потепление на 2 °C может быть опасным» . Химия и физика атмосферы . 16 (6): 3761–3812. arXiv : 1602.01393 . Бибкод : 2016ACP....16.3761H . дои : 10.5194/acp-16-3761-2016 . ISSN 1680-7316 . S2CID 9410444 .
- Харви, Джеффри А.; Ван ден Берг, Дафна; Эллерс, Хасинта; Кампен, Ремко; и др. (2018). «Интернет-блоги, белые медведи и отрицание изменения климата по доверенности» . Бионаука . 68 (4): 281–287. дои : 10.1093/biosci/bix133 . ISSN 0006-3568 . ПМК 5894087 . ПМИД 29662248 . (Ошибка: дои : 10.1093/biosci/biy033 , PMID 29608770 , Часы втягивания )
- Хокинс, Эд; Ортега, Пабло; Сосание, Эмма; Шурер, Эндрю; и др. (2017). «Оценка изменений глобальной температуры с доиндустриального периода» . Бюллетень Американского метеорологического общества . 98 (9): 1841–1856. Бибкод : 2017BAMS...98.1841H . дои : 10.1175/bams-d-16-0007.1 . hdl : 20.500.11820/f0ba8a1c-a259-4689-9fc3-77ec82fff5ab . ISSN 0003-0007 .
- Он, Яньи; Ван, Кайкунь; Чжоу, Чуньлюэ; Уайлд, Мартин (2018). «Возврат к глобальному затемнению и просветлению в зависимости от продолжительности солнечного света» . Письма о геофизических исследованиях . 45 (9): 4281–4289. Бибкод : 2018GeoRL..45.4281H . дои : 10.1029/2018GL077424 . hdl : 20.500.11850/268470 . ISSN 1944-8007 .
- Илер, Жером; Минкс, Ян К.; Каллаган, Макс В.; Эдмондс, Джей; Людерер, Гуннар; Немет, Грегори Ф.; Рогель, Джоэри; Самора, Мария Мар (17 октября 2019 г.). «Отрицательные выбросы и международные климатические цели – изучение сценариев смягчения последствий» . Климатические изменения . 157 (2): 189–219. Бибкод : 2019ClCh..157..189H . дои : 10.1007/s10584-019-02516-4 . hdl : 10044/1/74820 .
- Ходдер, Патрик; Мартин, Брайан (2009). «Климатический кризис? Политика создания чрезвычайной ситуации». Экономический и политический еженедельник . 44 (36): 53–60. ISSN 0012-9976 . JSTOR 25663518 .
- Холдинг, С.; Аллен, DM; Фостер, С.; Се, А.; и др. (2016). «Уязвимость подземных вод на малых островах». Природа Изменение климата . 6 (12): 1100–1103. Бибкод : 2016NatCC...6.1100H . дои : 10.1038/nclimate3128 . ISSN 1758-6798 .
- Джу, Геа-Дже; Ким, Джи Юн; Делай, Юно; Лайнман, Морис (2015). «Говорим об изменении климата и глобальном потеплении» . ПЛОС ОДИН . 10 (9): e0138996. Бибкод : 2015PLoSO..1038996L . дои : 10.1371/journal.pone.0138996 . ISSN 1932-6203 . ПМЦ 4587979 . ПМИД 26418127 .
- Кабир, Рассел; Хан, Хафиз Т.А.; Болл, Эмма; Колдуэлл, Хан (2016). «Влияние изменения климата: опыт прибрежных районов Бангладеш, пострадавших от циклонов Сидр и Айла» . Журнал окружающей среды и общественного здравоохранения . 2016 : 9654753. doi : 10.1155/2016/9654753 . ПМК 5102735 . ПМИД 27867400 .
- Качан, Дэвид Дж.; Оргилл-Мейер, Дженнифер (2020). «Влияние изменения климата на миграцию: синтез последних эмпирических данных» . Климатические изменения . 158 (3): 281–300. Бибкод : 2020ClCh..158..281K . дои : 10.1007/s10584-019-02560-0 . S2CID 207988694 . Проверено 9 февраля 2021 г.
- Кеннеди, Джей-Джей; Торн, WP; Петерсон, ТК; Руди, РА; и др. (2010). Арндт, Д.С.; Бэрингер, Миссури; Джонсон, MR (ред.). «Откуда мы знаем, что мир потеплел?». Специальное приложение: Состояние климата в 2009 г. Бюллетень Американского метеорологического общества . 91 (7). С26-С27. doi : 10.1175/BAMS-91-7-StateoftheClimate .
- Копп, Р.Э.; Хейхо, К.; Истерлинг, ДР; Холл, Т.; и др. (2017). «Глава 15: Потенциальные сюрпризы: сложные крайности и переломные элементы» . В USGCRP 2017 . стр. 1–470. Архивировано из оригинала 20 августа 2018 года.
- Коссин, JP; Холл, Т.; Кнутсон, Т.; Кункель, К.Э.; Трапп, Р.Дж.; Валлийский, Делавэр; Венер, МФ (2017). «Глава 9: Сильнейшие штормы» . В USGCRP2017 . стр. 1–470.
- Кнутсон, Т. (2017). «Приложение C: Обзор методологий обнаружения и атрибуции». . В USGCRP2017 . стр. 1–470.
- Крайденвайс, Ульрих; Хумпенёдер, Флориан; Стеванович, Миодраг; Бодирский, Бенджамин Леон; и др. (июль 2016 г.). «Облесение для смягчения последствий изменения климата: влияние на цены на продукты питания с учетом эффектов альбедо» . Письма об экологических исследованиях . 11 (8): 085001. Бибкод : 2016ERL....11h5001K . дои : 10.1088/1748-9326/11/8/085001 . ISSN 1748-9326 . S2CID 8779827 .
- Кванде, Х. (2014). «Процесс выплавки алюминия» . Журнал профессиональной и экологической медицины . 56 (5 доп.): S2–S4. дои : 10.1097/JOM.0000000000000154 . ПМК 4131936 . ПМИД 24806722 .
- Лапенис, Андрей Г. (1998). «Аррениус и Межправительственная группа экспертов по изменению климата». Эос . 79 (23): 271. Бибкод : 1998EOSTr..79..271L . дои : 10.1029/98EO00206 .
- Леверманн, Андерс; Кларк, Питер У.; Марзейон, Бен; Милн, Гленн А.; и др. (2013). «Многотысячелетняя приверженность глобальному потеплению на уровне моря» . Труды Национальной академии наук . 110 (34): 13745–13750. Бибкод : 2013PNAS..11013745L . дои : 10.1073/pnas.1219414110 . ISSN 0027-8424 . ПМЦ 3752235 . ПМИД 23858443 .
- Ленуар, Джонатан; Бертран, Ромен; Граф, Лиза; Буржо, Луана; и др. (2020). «Виды лучше отслеживают потепление климата в океанах, чем на суше» . Экология и эволюция природы . 4 (8): 1044–1059. Бибкод : 2020NatEE...4.1044L . дои : 10.1038/s41559-020-1198-2 . ISSN 2397-334X . ПМИД 32451428 . S2CID 218879068 .
- Липерт, Беате Г.; Превиди, Майкл (2009). «Различаются ли модели и наблюдения в отношении реакции осадков на глобальное потепление?» . Журнал климата . 22 (11): 3156–3166. Бибкод : 2009JCli...22.3156L . дои : 10.1175/2008JCLI2472.1 .
- Ливерман, Диана М. (2009). «Конвенции об изменении климата: конструкции опасности и лишение атмосферы». Журнал исторической географии . 35 (2): 279–296. дои : 10.1016/j.jhg.2008.08.008 .
- Леб, Норман Г.; Джонсон, Грегори К.; Торсен, Тайлер Дж.; Лайман, Джон М.; Роуз, Фред Г.; Като, Сейджи (2021). «Спутниковые и океанические данные показывают заметное увеличение скорости нагрева Земли» . Письма о геофизических исследованиях . 48 (13). Американский геофизический союз (AGU). e2021GL093047. Бибкод : 2021GeoRL..4893047L . дои : 10.1029/2021gl093047 . ISSN 0094-8276 . S2CID 236233508 .
- Мах, Кэтрин Дж.; Краан, Кэролайн М.; Адгер, В. Нил; Бухауг, Халвард; и др. (2019). «Климат как фактор риска вооруженного конфликта» . Природа . 571 (7764): 193–197. Бибкод : 2019Natur.571..193M . дои : 10.1038/s41586-019-1300-6 . hdl : 10871/37969 . ISSN 1476-4687 . ПМИД 31189956 . S2CID 186207310 .
- Мэтьюз, Х. Дэймон; Джиллетт, Натан П.; Стотт, Питер А.; Зикфельд, Кирстен (2009). «Пропорциональность глобального потепления совокупным выбросам углерода». Природа . 459 (7248): 829–832. Бибкод : 2009Natur.459..829M . дои : 10.1038/nature08047 . ISSN 1476-4687 . ПМИД 19516338 . S2CID 4423773 .
- Мэтьюз, Том (2018). «Влажная жара и изменение климата» . Прогресс в физической географии: Земля и окружающая среда . 42 (3): 391–405. Бибкод : 2018ПрПГ...42..391М . дои : 10.1177/0309133318776490 . S2CID 134820599 .
- Макнил, В. Фэй (2017). «Атмосферные аэрозоли: облака, химия и климат» . Ежегодный обзор химической и биомолекулярной инженерии . 8 (1): 427–444. doi : 10.1146/annurev-chembioeng-060816-101538 . ISSN 1947-5438 . ПМИД 28415861 .
- Мелилло, Дж. М.; Фрей, SD; ДеАнджелис, КМ ; Вернер, WJ; и др. (2017). «Долгосрочная структура и величина обратной связи углерода в почве с климатической системой в мире с потеплением» . Наука . 358 (6359): 101–105. Бибкод : 2017Sci...358..101M . дои : 10.1126/science.aan2874 . hdl : 1912/9383 . ПМИД 28983050 .
- Mercure, Ж.-Ф.; Поллитт, Х.; Виньуалес, Х.Э.; Эдвардс, Северная Каролина; и др. (2018). «Макроэкономическое воздействие выброшенных на мель активов ископаемого топлива» (PDF) . Природа Изменение климата . 8 (7): 588–593. Бибкод : 2018NatCC...8..588M . дои : 10.1038/s41558-018-0182-1 . hdl : 10871/37807 . ISSN 1758-6798 . S2CID 89799744 .
- Митчам, GT; Мастерс, Д.; Хэмлингтон, BD; Фасулло, Джей Ти; и др. (2018). «Ускоренное повышение уровня моря, вызванное изменением климата, обнаружено в эпоху высотомеров» . Труды Национальной академии наук . 115 (9): 2022–2025 гг. Бибкод : 2018PNAS..115.2022N . дои : 10.1073/pnas.1717312115 . ISSN 0027-8424 . ПМЦ 5834701 . ПМИД 29440401 .
- Национальные академии наук, техники и медицины (2019 г.). Технологии отрицательных выбросов и надежная секвестрация: программа исследований (отчет). Вашингтон, округ Колумбия: Издательство национальных академий. дои : 10.17226/25259 . ISBN 978-0-309-48455-8 .
- Национальный исследовательский совет (2011). «Причины и последствия изменения климата» . Климатический выбор Америки . Вашингтон, округ Колумбия: Издательство национальных академий. дои : 10.17226/12781 . ISBN 978-0-309-14585-5 . Архивировано из оригинала 21 июля 2015 года . Проверено 28 января 2019 г.
- Нейком, Рафаэль; Штайгер, Натан; Гомес-Наварро, Джон Джозеф; Ван, Цзянхао; и др. (2019а). «Нет доказательств глобально согласованных теплых и холодных периодов в доиндустриальную нашу эпоху» (PDF) . Природа 571 (7766): 550–554. Бибкод : 2019Nature.571..550N дои : 10.1038/ s41586-019-1401-2 ISSN 1476-4687 . ПМИД 31341300 . S2CID 198494930 .
- Нейком, Рафаэль; Барбоза, Луис А.; Эрб, Майкл П.; Ши, Фэн; и др. (2019б). «Последовательная многодесятилетняя изменчивость в реконструкциях и моделировании глобальной температуры на протяжении нашей эры» . Природа Геонауки . 12 (8): 643–649. Бибкод : 2019NatGe..12..643P . дои : 10.1038/s41561-019-0400-0 . ISSN 1752-0908 . ПМК 6675609 . ПМИД 31372180 .
- О'Нил, Шафран Дж.; Бойкофф, Макс (2010). «Отрицатель климата, скептик или противник?» . Труды Национальной академии наук Соединенных Штатов Америки . 107 (39): Е151. Бибкод : 2010PNAS..107E.151O . дои : 10.1073/pnas.1010507107 . ISSN 0027-8424 . ПМЦ 2947866 . ПМИД 20807754 .
- Полочанска, Эльвира С.; Браун, Кристофер Дж.; Сайдман, Уильям Дж.; Кисслинг, Вольфганг; и др. (2013). «Глобальное влияние изменения климата на морскую жизнь» (PDF) . Природа Изменение климата . 3 (10): 919–925. Бибкод : 2013NatCC...3..919P . дои : 10.1038/nclimate1958 . HDL : 2160/34111 . ISSN 1758-6798 .
- Рамсторф, Стефан ; Казенав, Анни ; Черч, Джон А .; Хансен, Джеймс Э.; и др. (2007). «Недавние климатические наблюдения по сравнению с прогнозами» (PDF) . Наука . 316 (5825): 709. Бибкод : 2007Sci...316..709R . дои : 10.1126/science.1136843 . ПМИД 17272686 . S2CID 34008905 . Архивировано (PDF) из оригинала 6 сентября 2018 года.
- Раманатан, В.; Кармайкл, Г. (2008). «Глобальные и региональные изменения климата из-за черного углерода» . Природа Геонауки . 1 (4): 221–227. Бибкод : 2008NatGe...1..221R . дои : 10.1038/ngeo156 .
- Рэндел, Уильям Дж.; Шайн, Кейт П .; Остин, Джон; Барнетт, Джон; и др. (2009). «Обновление наблюдаемых тенденций температуры в стратосфере» . Журнал геофизических исследований . 114 (Д2): D02107. Бибкод : 2009JGRD..114.2107R . дои : 10.1029/2008JD010421 . HAL hal-00355600 .
- Раунер, Себастьян; Бауэр, Нико; Дирнаихнер, Алоис; Ван Дингенен, Рита; Мьютель, Крис; Людерер, Гуннар (2020). «Уменьшение вреда здоровью и окружающей среде от выхлопа угля перевешивает экономические последствия» . Природа Изменение климата . 10 (4): 308–312. Бибкод : 2020NatCC..10..308R . дои : 10.1038/s41558-020-0728-x . ISSN 1758-6798 . S2CID 214619069 .
- Рогель, Джоэри; Форстер, Пирс М.; Криглер, Эльмар; Смит, Кристофер Дж.; и др. (2019). «Оценка и отслеживание оставшегося углеродного баланса для достижения строгих климатических целей» . Природа . 571 (7765): 335–342. Бибкод : 2019Natur.571..335R . дои : 10.1038/s41586-019-1368-z . hdl : 10044/1/78011 . ISSN 1476-4687 . ПМИД 31316194 . S2CID 197542084 .
- Рогель, Джоэри; Майнсхаузен, Мальта; Шеффер, Михель; Кнутти, Рето; Риахи, Кейван (2015). «Влияние кратковременных мер по смягчению последствий, не связанных с выбросами CO2, на углеродный бюджет для стабилизации глобального потепления» . Письма об экологических исследованиях . 10 (7): 1–10. Бибкод : 2015ERL....10g5001R . дои : 10.1088/1748-9326/10/7/075001 . hdl : 20.500.11850/103371 .
- Русева Татьяна; Хедрик, Джейми; Марланд, Грегг; Товар, Хеннинг; и др. (2020). «Переосмысление стандартов постоянства наземного и прибрежного углерода: последствия для управления и устойчивости» . Текущее мнение об экологической устойчивости . 45 : 69–77. Бибкод : 2020COES...45...69R . doi : 10.1016/j.cosust.2020.09.009 . ISSN 1877-3435 . S2CID 229069907 .
- Самсет, Британская Колумбия; Сэнд, М.; Смит, CJ; Бауэр, SE; и др. (2018). «Воздействие на климат в результате удаления антропогенных аэрозольных выбросов» (PDF) . Письма о геофизических исследованиях . 45 (2): 1020–1029. Бибкод : 2018GeoRL..45.1020S . дои : 10.1002/2017GL076079 . ISSN 1944-8007 . ПМЦ 7427631 . ПМИД 32801404 .
- Сэнд, М.; Бернтсен, ТК; фон Зальцен, К.; Фланнер, МГ; и др. (2015). «Реакция температуры Арктики на изменения выбросов недолговечных факторов климата». Природа . 6 (3): 286–289. Бибкод : 2016NatCC...6..286S . дои : 10.1038/nclimate2880 .
- Шмидт, Гэвин А.; Руди, Рето А.; Миллер, Рон Л.; Лацис, Энди А. (2010). «Атрибуция современного общего парникового эффекта» . Журнал геофизических исследований: Атмосфера . 115 (Д20): Д20106. Бибкод : 2010JGRD..11520106S . дои : 10.1029/2010JD014287 . ISSN 2156-2202 . S2CID 28195537 .
- Сердечный, Оливия; Адамс, Софи; Баарш, Флоран; Куму, Дим; и др. (2016). «Влияние изменения климата в странах Африки к югу от Сахары: от физических изменений до их социальных последствий» (PDF) . Региональные экологические изменения . 17 (6): 1585–1600. дои : 10.1007/s10113-015-0910-2 . hdl : 1871.1/c8dfb143-d9e1-4eef-9bbe-67b3c338d07f . ISSN 1436-378X . S2CID 3900505 .
- Саттон, Роуэн Т.; Донг, Бувен; Грегори, Джонатан М. (2007). «Соотношение потепления суши и моря в ответ на изменение климата: результаты модели IPCC AR4 и сравнение с наблюдениями» . Письма о геофизических исследованиях . 34 (2): L02701. Бибкод : 2007GeoRL..34.2701S . дои : 10.1029/2006GL028164 .
- Смейл, Дэн А.; Вернберг, Томас; Оливер, Эрик Си Джей; Томсен, Мэдс; Харви, Бен П. (2019). «Морские волны тепла угрожают глобальному биоразнообразию и предоставлению экосистемных услуг» (PDF) . Природа Изменение климата . 9 (4): 306–312. Бибкод : 2019NatCC...9..306S . дои : 10.1038/s41558-019-0412-1 . ISSN 1758-6798 . S2CID 91471054 .
- Смит, Джоэл Б.; Шнайдер, Стивен Х.; Оппенгеймер, Майкл; Йохе, Гэри В.; и др. (2009). «Оценка опасного изменения климата посредством обновления «Причин для беспокойства» Межправительственной группы экспертов по изменению климата (МГЭИК) » . Труды Национальной академии наук . 106 (11): 4133–4137. Бибкод : 2009PNAS..106.4133S . дои : 10.1073/pnas.0812355106 . ПМЦ 2648893 . ПМИД 19251662 .
- Смит, Н.; Лейзеровиц, А. (2013). «Роль эмоций в поддержке и противодействии политике глобального потепления» . Анализ рисков . 34 (5): 937–948. дои : 10.1111/risa.12140 . ПМК 4298023 . ПМИД 24219420 .
- Стрев, Дж.; Холланд, Марика М.; Мейер, Уолт; Скамбос, Тед; и др. (2007). «Сокращение морского льда в Арктике: быстрее, чем прогнозировалось» . Письма о геофизических исследованиях . 34 (9): L09501. Бибкод : 2007GeoRL..34.9501S . дои : 10.1029/2007GL029703 .
- Сторелвмо, Т.; Филлипс, печатная плата; Ломанн, У.; Лейрвик, Т.; Уайлд, М. (2016). «Распутывание парникового потепления и аэрозольного охлаждения, чтобы выявить чувствительность климата Земли» (PDF) . Природа Геонауки . 9 (4): 286–289. Бибкод : 2016NatGe...9..286S . дои : 10.1038/ngeo2670 . ISSN 1752-0908 .
- Турецкий, Мерритт Р.; Эбботт, Бенджамин В.; Джонс, Мириам С.; Энтони, Кэти Уолтер; и др. (2019). «Коллапс вечной мерзлоты ускоряет выброс углерода» . Природа . 569 (7754): 32–34. Бибкод : 2019Natur.569...32T . дои : 10.1038/d41586-019-01313-4 . ПМИД 31040419 .
- Тернер, Моника Г.; Колдер, В. Джон; Камминг, Грэм С.; Хьюз, Терри П.; и др. (2020). «Изменение климата, экосистемы и резкие перемены: приоритеты науки» . Философские труды Королевского общества Б. 375 (1794). дои : 10.1098/rstb.2019.0105 . ПМК 7017767 . ПМИД 31983326 .
- Туми, С. (1977). «Влияние загрязнения на коротковолновое альбедо облаков» . Дж. Атмос. Наука . 34 (7): 1149–1152. Бибкод : 1977JAtS...34.1149T . doi : 10.1175/1520-0469(1977)034<1149:TIOPOT>2.0.CO;2 . ISSN 1520-0469 .
- Тиндаль, Джон (1861). «О поглощении и излучении тепла газами и парами и о физической связи излучения, поглощения и проводимости» . Философский журнал . 4. 22 : 169–194, 273–285. Архивировано из оригинала 26 марта 2016 года.
- Урбан, Марк К. (2015). «Ускорение риска вымирания из-за изменения климата» . Наука . 348 (6234): 571–573. Бибкод : 2015Sci...348..571U . дои : 10.1126/science.aaa4984 . ISSN 0036-8075 . ПМИД 25931559 .
- USGCRP (2009). Карл, ТР; Мелилло, Дж.; Петерсон, Т.; Хассоль, С.Дж. (ред.). Последствия глобального изменения климата в Соединенных Штатах . Издательство Кембриджского университета. ISBN 978-0-521-14407-0 . Архивировано из оригинала 6 апреля 2010 года . Проверено 19 января 2024 г.
- USGCRP (2017). Вуэбблс, диджей; Фэйи, Д.В.; Хиббард, Калифорния; Доккен, диджей; и др. (ред.). Специальный доклад по науке о климате: Четвертая национальная оценка климата, том I. Вашингтон, округ Колумбия: Программа исследования глобальных изменений США. дои : 10.7930/J0J964J6 .
- Вандик, Т.; Керамидас, К.; Китус, А.; Спадаро, Дж.; и др. (2018). «Сопутствующие выгоды от качества воздуха для здоровья человека и сельского хозяйства уравновешивают затраты на выполнение обязательств по Парижскому соглашению» . Природные коммуникации . 9 (4939): 4939. Бибкод : 2018NatCo...9.4939V . дои : 10.1038/s41467-018-06885-9 . ПМК 6250710 . ПМИД 30467311 .
- Вуэбблс, диджей; Истерлинг, ДР; Хейхо, К.; Кнутсон, Т.; и др. (2017). «Глава 1: Наш глобально меняющийся климат» (PDF) . В USGCRP2017 .
- Уолш, Джон; Вуэбблс, Дональд; Хейхо, Кэтрин; Коссин, Коссин; и др. (2014). «Приложение 3: Дополнение по климатологии» (PDF) . Последствия изменения климата в Соединенных Штатах: Третья национальная оценка климата . Национальная оценка климата США.
- Ван, Бин; Шугарт, Герман Х.; Лердау, Мануэль Т. (2017). «Чувствительность глобальных бюджетов парниковых газов к загрязнению тропосферного озона, опосредованному биосферой» . Письма об экологических исследованиях . 12 (8): 084001. Бибкод : 2017ERL....12h4001W . дои : 10.1088/1748-9326/aa7885 . ISSN 1748-9326 .
- Уоттс, Ник; Адгер, В. Нил; Аньолуччи, Паоло; Блэксток, Джейсон; и др. (2015). «Здоровье и изменение климата: политические меры по защите здоровья населения» . Ланцет . 386 (10006): 1861–1914. дои : 10.1016/S0140-6736(15)60854-6 . hdl : 10871/20783 . ПМИД 26111439 . S2CID 205979317 . Архивировано из оригинала 7 апреля 2017 года.
- Уоттс, Ник; Аманн, Маркус; Арнелл, Найджел; Айеб-Карлссон, Соня; и др. (2019). «Отчет журнала The Lancet Countdown за 2019 год о здоровье и изменении климата: обеспечение того, чтобы здоровье ребенка, рожденного сегодня, не определялось изменением климата» . Ланцет . 394 (10211): 1836–1878. дои : 10.1016/S0140-6736(19)32596-6 . hdl : 10871/40583 . ISSN 0140-6736 . ПМИД 31733928 . S2CID 207976337 .
- Уарт, Спенсер (2013). «Рост междисциплинарных исследований климата» . Труды Национальной академии наук . 110 (Приложение 1): 3657–3664. дои : 10.1073/pnas.1107482109 . ПМЦ 3586608 . ПМИД 22778431 .
- Уайлд, М.; Гильген, Ганс; Роеш, Андреас; Омура, Ацуму; и др. (2005). «От затемнения к просветлению: десятилетние изменения солнечной радиации на поверхности Земли». Наука . 308 (5723): 847–850. Бибкод : 2005Sci...308..847W . дои : 10.1126/science.1103215 . ПМИД 15879214 . S2CID 13124021 .
- Уильямс, Ричард Дж; Чеппи, Пауло; Катавута, Анна (2020). «Контроль переходной реакции климата на выбросы посредством физических обратных связей, поглощения тепла и круговорота углерода» . Письма об экологических исследованиях . 15 (9): 0940c1. Бибкод : 2020ERL....15i40c1W . дои : 10.1088/1748-9326/ab97c9 . hdl : 10044/1/80154 .
- Вольф, Эрик В.; Шепард, Джон Г.; Шакбург, Эмили; Уотсон, Эндрю Дж. (2015). «Отзывы о климате в системе Земля: введение» . Философские труды Королевского общества A: Математические, физические и технические науки . 373 (2054): 20140428. Бибкод : 2015RSPTA.37340428W . дои : 10.1098/rsta.2014.0428 . ПМК 4608041 . ПМИД 26438277 .
- Цзэн, Нин; Юн, Джинхо (2009). «Расширение мировых пустынь из-за обратной связи между растительностью и альбедо в условиях глобального потепления» . Письма о геофизических исследованиях . 36 (17): L17401. Бибкод : 2009GeoRL..3617401Z . дои : 10.1029/2009GL039699 . ISSN 1944-8007 . S2CID 1708267 .
- Чжан, Цзиньлунь; Линдси, Рон; Стил, Майк; Швайгер, Аксель (2008). «Что послужило причиной резкого отступления арктического морского льда летом 2007 года?» . Письма о геофизических исследованиях . 35 (11): 1–5. Бибкод : 2008GeoRL..3511505Z . дои : 10.1029/2008gl034005 . S2CID 9387303 .
- Чжао, К.; Лю, Б.; и др. (2017). «Повышение температуры снижает глобальную урожайность основных сельскохозяйственных культур по четырем независимым оценкам» . Труды Национальной академии наук . 114 (35): 9326–9331. Бибкод : 2017PNAS..114.9326Z . дои : 10.1073/pnas.1701762114 . ПМК 5584412 . ПМИД 28811375 .
Книги, отчеты и юридические документы
- Бразильская академия наук (Бразилия); Королевское общество Канады; Китайская академия наук; Академия наук (Франция); Немецкая академия естествознания Леопольдина (Германия); Индийская национальная академия наук; Национальная академия Линчеи (Италия); Научный совет Японии, Мексиканская академия наук; Мексиканская академия наук (Мексика); Российская академия наук; Академия наук Южной Африки; Королевское общество (Великобритания); Национальная академия наук (Соединенные Штаты Америки) (май 2009 г.). «Совместное заявление академий G8+5: Изменение климата и трансформация энергетических технологий для низкоуглеродного будущего» (PDF) . Национальные академии наук, техники и медицины. Архивировано из оригинала (PDF) 15 февраля 2010 года . Проверено 5 мая 2010 г.
- Арчер, Дэвид ; Пьерембер, Раймонд (2013). Документы по потеплению: Научный фонд прогнозирования изменения климата . Джон Уайли и сыновья. ISBN 978-1-118-68733-8 .
- Уздечка, Ричард; Шарма, Шрути; Мостафа, Мостафа; Геддес, Анна (июнь 2019 г.). Обмен субсидий на ископаемое топливо на чистую энергию (PDF) (Отчет).
- Климатический фокус (декабрь 2015 г.). «Парижское соглашение: Краткое содержание. Краткая информация для клиентов Climate Focus о Парижском соглашении III» (PDF) . Архивировано (PDF) из оригинала 5 октября 2018 года . Проверено 12 апреля 2019 г.
- Консейсан; и др. (2020). Отчет о человеческом развитии за 2020 год. Следующий рубеж: человеческое развитие и антропоцен (PDF) (Отчет). Программа развития ООН . Проверено 9 января 2021 г.
- ДеФрис, Рут ; Эденхофер, Оттмар; Холлидей, Алекс; Выздоравливай, Джеффри; и др. (сентябрь 2019 г.). Недостающие экономические риски в оценках воздействия изменения климата (PDF) (Отчет). Научно-исследовательский институт Грэнтэма по изменению климата и окружающей среде, Лондонская школа экономики и политических наук.
- Десслер, Эндрю Э. и Эдвард А. Парсон, ред. Наука и политика глобального изменения климата: руководство к дискуссии (Cambridge University Press, 2019).
- Дессаи, Сурадже (2001). «Климатический режим от Гааги до Марракеша: спасти или потопить Киотский протокол?» (PDF) . Рабочий документ Центра Тиндаля 12 . Центр Тиндаля. Архивировано из оригинала (PDF) 10 июня 2012 года . Проверено 5 мая 2010 г.
- Данлэп, Райли Э.; МакКрайт, Аарон М. (2011). «Глава 10: Организованное отрицание изменения климата». В Дризеке, Джон С.; Норгаард, Ричард Б.; Шлосберг, Дэвид (ред.). Оксфордский справочник по изменению климата и обществу . Издательство Оксфордского университета. стр. 144–160. ISBN 978-0-19-956660-0 .
- Данлэп, Райли Э.; МакКрайт, Аарон М. (2015). «Глава 10: Проблемы изменения климата: Противодействие отрицанию». В Данлэпе, Райли Э.; Брюлль, Роберт Дж. (ред.). Изменение климата и общество: социологические перспективы . Издательство Оксфордского университета. стр. 300–332. ISBN 978-0-19-935611-9 .
- Европейская комиссия (28 ноября 2018 г.). Углубленный анализ, сопровождающий сообщение Комиссии COM(2018) 773: Чистая планета для всех – европейское стратегическое долгосрочное видение процветающей, современной, конкурентоспособной и климатически нейтральной экономики (PDF) (Отчет). Брюссель. п. 188.
- Флавелл, Алекс (2014). Взгляд МОМ на миграцию, окружающую среду и изменение климата (PDF) (Отчет). Женева, Швейцария: Международная организация по миграции (МОМ). ISBN 978-92-9068-703-0 . OCLC 913058074 .
- Флеминг, Джеймс Роджер (2007). Эффект Каллендара: жизнь и творчество Гая Стюарта Каллендара (1898–1964) . Бостон: Американское метеорологическое общество. ISBN 978-1-878220-76-9 .
- Флинн, К.; Ямасуми, Э.; Фишер, С.; Сноу, Д.; и др. (январь 2021 г.). Народное голосование за климат (PDF) (Отчет). ПРООН и Оксфордский университет . Проверено 5 августа 2021 г.
- Форстер, премьер-министр; Смит, CJ; Уолш, Т.; Лэмб, ВФ; и др. (июнь 2023 г.). «Индикаторы глобального изменения климата 2022: ежегодное обновление крупномасштабных индикаторов состояния климатической системы и влияния человека» (PDF) . Данные науки о системе Земли . 15 (6): 2295–2327. Бибкод : 2023ESSD...15.2295F . дои : 10.5194/essd-15-2295-2023 . Проверено 25 октября 2023 г.
- Глобальная инициатива по метану (2020 г.). Глобальные выбросы метана и возможности их смягчения (PDF) (Отчет). Глобальная инициатива по метану.
- Халлегатт, Стефан; Бангалор, Мук; Бонзаниго, Лаура; Фэй, Марианна; и др. (2016). Шоковые волны: управление воздействием изменения климата на бедность. Изменение климата и развитие (PDF) . Вашингтон, округ Колумбия: Всемирный банк. дои : 10.1596/978-1-4648-0673-5 . hdl : 10986/22787 . ISBN 978-1-4648-0674-2 .
- Хейвуд, Джим (2016). «Глава 27 – Атмосферные аэрозоли и их роль в изменении климата». В Летчере, Тревор М. (ред.). Изменение климата: наблюдаемые воздействия на планету Земля . Эльзевир. ISBN 978-0-444-63524-2 .
- МЭА (декабрь 2020 г.). «COVID-19 и энергоэффективность» . Энергоэффективность 2020 (Отчет). Париж, Франция . Проверено 6 апреля 2021 г.
- МЭА (октябрь 2021 г.). Чистый ноль к 2050 году: дорожная карта для глобального энергетического сектора (PDF) (Отчет). Париж, Франция . Проверено 4 апреля 2022 г.
- МЭА (октябрь 2023 г.). Мировой энергетический прогноз на 2023 год (PDF) (Отчет). Париж, Франция . Проверено 25 октября 2021 г.
- Крогструп, Сигне; Оман, Уильям (4 сентября 2019 г.). Макроэкономическая и финансовая политика по смягчению последствий изменения климата: обзор литературы (PDF) . Рабочие документы МВФ. Том. 19. дои : 10.5089/9781513511955.001 . ISBN 978-1-5135-1195-5 . ISSN 1018-5941 . S2CID 203245445 .
- Лейзеровиц, А.; Карман, Дж.; Баттермор, Н.; Ван, X.; и др. (2021). Международное общественное мнение об изменении климата (PDF) (Отчет). Нью-Хейвен, Коннектикут: Йельская программа по информированию об изменении климата и данным Facebook во благо . Проверено 5 августа 2021 г.
- Летчер, Тревор М., изд. (2020). Энергия будущего: улучшенные, устойчивые и чистые варианты для нашей планеты (Третье изд.). Эльзевир . ISBN 978-0-08-102886-5 .
- Майнсхаузен, Мальта (2019). «Последствия разработанных сценариев изменения климата». В Теске, Свен (ред.). Достижение целей Парижского климатического соглашения: глобальные и региональные сценарии использования 100% возобновляемых источников энергии с неэнергетическими путями выбросов ПГ для +1,5 °C и +2 °C . Международное издательство Спрингер. стр. 459–469. дои : 10.1007/978-3-030-05843-2_12 . ISBN 978-3-030-05843-2 . S2CID 133868222 .
- Миллер, Дж.; Ду, Л.; Коджак, Д. (2017). Влияние правил мирового класса в области эффективности транспортных средств и выбросов в атмосферу в некоторых странах «Большой двадцатки» (PDF) (Отчет). Вашингтон, округ Колумбия: Международный совет по чистому транспорту.
- Мюллер, Бенито (февраль 2010 г.). Копенгаген 2009: Провал или последний тревожный сигнал для наших лидеров? ЭВ 49 (PDF) . Оксфордский институт энергетических исследований . п. я. ISBN 978-1-907555-04-6 . Архивировано (PDF) из оригинала 10 июля 2017 года . Проверено 18 мая 2010 г.
- Национальные академии (2008 г.). Понимание изменения климата и реагирование на него: основные моменты докладов национальных академий, издание 2008 г. (PDF) (отчет). Национальная академия наук. Архивировано из оригинала (PDF) 11 октября 2017 года . Проверено 9 ноября 2010 г.
- Национальный исследовательский совет (2012). Изменение климата: доказательства, последствия и выбор (Отчет). Вашингтон, округ Колумбия: Национальная академия наук . Проверено 21 ноября 2023 г.
- Ньюэлл, Питер (14 декабря 2006 г.). Климат перемен: негосударственные субъекты и глобальная политика парниковых газов . Издательство Кембриджского университета. ISBN 978-0-521-02123-4 . Проверено 30 июля 2018 г.
- НОАА. «Анализ NOAA за январь 2017 года: глобальные и региональные сценарии повышения уровня моря для США» (PDF) . Архивировано (PDF) из оригинала 18 декабря 2017 года . Проверено 7 февраля 2019 г.
- Оливье, JGJ; Питерс, JAHW (2019). Тенденции глобальных выбросов CO2 и общих выбросов парниковых газов (PDF) . Гаага: Агентство экологической оценки PBL Нидерландов.
- Орескес, Наоми (2007). «Научный консенсус по вопросу изменения климата: откуда нам знать, что мы не ошибаемся?». В ДиМенто Джозеф ФК; Дафман, Памела М. (ред.). Изменение климата: что оно означает для нас, наших детей и наших внуков . Массачусетский технологический институт Пресс. ISBN 978-0-262-54193-0 .
- Орескес, Наоми; Конвей, Эрик (2010). Торговцы сомнениями: как горстка ученых скрыла правду по вопросам, от табачного дыма до глобального потепления (первое издание). Блумсбери Пресс. ISBN 978-1-59691-610-4 .
- Исследовательский центр Пью (ноябрь 2015 г.). Глобальная обеспокоенность изменением климата, широкая поддержка ограничения выбросов (PDF) (Отчет) . Проверено 5 августа 2021 г.
- РЕН21 (2020). Отчет о глобальном состоянии возобновляемых источников энергии в 2020 году (PDF) . Париж: Секретариат REN21. ISBN 978-3-948393-00-7 .
{{cite book}}: CS1 maint: числовые имена: список авторов ( ссылка ) - Королевское общество (13 апреля 2005 г.). Экономические вопросы – письменные доказательства . Экономика изменения климата, второй отчет сессии 2005–2006 годов, подготовленный Специальным комитетом по экономическим вопросам Палаты лордов Парламента Великобритании. Парламент Великобритании. Архивировано из оригинала 13 ноября 2011 года . Проверено 9 июля 2011 г.
- Сетцер, Джоана; Бирнс, Ребекка (июль 2019 г.). Глобальные тенденции в судебных процессах по изменению климата: обзор 2019 года (PDF) . Лондон: Научно-исследовательский институт Грэнтэма по изменению климата и окружающей среде и Центр экономики и политики в области изменения климата.
- Стейнберг, Д.; Билен, Д.; и др. (июль 2017 г.). Электрификация и декарбонизация: изучение использования энергии и выбросов парниковых газов в США в сценариях с широко распространенной электрификацией и декарбонизацией энергетического сектора (PDF) (Отчет). Голден, Колорадо: Национальная лаборатория возобновляемых источников энергии.
- Теске, Свен, изд. (2019). «Резюме» (PDF) . Достижение целей Парижского климатического соглашения: глобальные и региональные сценарии использования 100% возобновляемых источников энергии с неэнергетическими путями выбросов ПГ для +1,5 °C и +2 °C . Международное издательство Спрингер. стр. XIII – XXV. дои : 10.1007/978-3-030-05843-2 . ISBN 978-3-030-05843-2 . S2CID 198078901 .
- Теске, Свен; Преггер, Томас; Нэглер, Тобиас; Саймон, Соня; и др. (2019). «Результаты энергетического сценария». В Теске, Свен (ред.). Достижение целей Парижского климатического соглашения: глобальные и региональные сценарии использования 100% возобновляемых источников энергии с неэнергетическими путями выбросов ПГ для +1,5 °C и +2 °C . Международное издательство Спрингер. стр. 175–402. дои : 10.1007/978-3-030-05843-2_8 . ISBN 978-3-030-05843-2 .
- Теске, Свен (2019). «Пути справедливого перехода отрасли ископаемого топлива». В Теске, Свен (ред.). Достижение целей Парижского климатического соглашения: глобальные и региональные сценарии использования 100% возобновляемых источников энергии с неэнергетическими путями выбросов ПГ для +1,5 °C и +2 °C . Международное издательство Спрингер. стр. 403–411. дои : 10.1007/978-3-030-05843-2_9 . ISBN 978-3-030-05843-2 . S2CID 133961910 .
- ФАО ООН (2016). Глобальная оценка лесных ресурсов 2015. Как меняются леса мира? (PDF) (Отчет). Продовольственная и сельскохозяйственная организация Объединенных Наций. ISBN 978-92-5-109283-5 . Проверено 1 декабря 2019 г.
- Отчет о разрыве в уровнях выбросов за 2019 год (PDF) . Найроби: Программа ООН по окружающей среде. 2019. ISBN 978-92-807-3766-0 .
- Отчет о разрыве в уровнях выбросов за 2021 год (PDF) . Найроби: Программа ООН по окружающей среде. 2021. ISBN 978-92-807-3890-2 .
- ЮНЕП (2018). Отчет о пробелах в адаптации за 2018 год . Найроби, Кения: Программа ООН по окружающей среде (ЮНЕП). ISBN 978-92-807-3728-8 .
- РКИК ООН (1992). Рамочная конвенция Организации Объединенных Наций об изменении климата (PDF) .
- РКИК ООН (1997). «Киотский протокол к Рамочной конвенции ООН об изменении климата» . Объединенные Нации.
- РКИК ООН (30 марта 2010 г.). «Решение 2/CP.15: Копенгагенское соглашение» . Отчет Конференции Сторон о работе ее пятнадцатой сессии, проходившей в Копенгагене с 7 по 19 декабря 2009 года . Рамочная конвенция ООН об изменении климата. FCCC/CP/2009/11/Add.1. Архивировано из оригинала 30 апреля 2010 года . Проверено 17 мая 2010 г.
- РКИК ООН (2015). «Парижское соглашение» (PDF) . Рамочная конвенция ООН об изменении климата.
- РКИК ООН (26 февраля 2021 г.). Определяемые на национальном уровне вклады в рамках обобщающего доклада секретариата Парижского соглашения (PDF) (Отчет). Рамочная конвенция ООН об изменении климата .
- Пак, Сусин (май 2011 г.). «Изменение климата и риск безгражданства: положение низменных островных государств» (PDF) . Верховный комиссар ООН по делам беженцев. Архивировано (PDF) из оригинала 2 мая 2013 года . Проверено 13 апреля 2012 г.
- Агентство по охране окружающей среды США (2016). Воздействие метана и черного углерода на Арктику: научное сообщение (отчет). Архивировано из оригинала 6 сентября 2017 года . Проверено 27 февраля 2019 г.
- Ван Ольденборг, Герт-Ян; Филип, Сьюкье; Кью, Сара; Вотард, Робер; и др. (2019). «Человеческий вклад в рекордную жару в июне 2019 года во Франции». Семантический учёный . S2CID 199454488 .
- Уарт, Спенсер (октябрь 2008 г.). Открытие глобального потепления (2-е изд.). Кембридж, Массачусетс: Издательство Гарвардского университета. ISBN 978-0-674-03189-0 . Архивировано из оригинала 18 ноября 2016 года . Проверено 16 июня 2020 г.
- Уарт, Спенсер (февраль 2019 г.). Открытие глобального потепления (онлайн-изд.). Архивировано из оригинала 18 июня 2020 года . Проверено 19 июня 2020 г.
- Уарт, Спенсер (январь 2020 г.). «Парниковый эффект углекислого газа» . Открытие глобального потепления . Американский институт физики. Архивировано из оригинала 11 ноября 2016 года . Проверено 19 июня 2020 г.
- Уарт, Спенсер (январь 2020 г.). «Общественность и изменение климата» . Открытие глобального потепления . Американский институт физики. Архивировано из оригинала 11 ноября 2016 года . Проверено 19 июня 2020 г.
- Уарт, Спенсер (январь 2020 г.). «Общественность и изменение климата: подозрения в отношении антропогенного парникового эффекта (1956–1969)» . Открытие глобального потепления . Американский институт физики. Архивировано из оригинала 11 ноября 2016 года . Проверено 19 июня 2020 г.
- Уарт, Спенсер (январь 2020 г.). «Общественность и изменение климата (продолжение – с 1980 г.)» . Открытие глобального потепления . Американский институт физики. Архивировано из оригинала 11 ноября 2016 года . Проверено 19 июня 2020 г.
- Уарт, Спенсер (январь 2020 г.). «Общественность и изменение климата: лето 1988 года» . Открытие глобального потепления . Американский институт физики. Архивировано из оригинала 11 ноября 2016 года . Проверено 19 июня 2020 г.
- Состояние и тенденции ценообразования на выбросы углерода в 2019 году (PDF) (Отчет). Вашингтон, округ Колумбия: Всемирный банк. Июнь 2019 г. doi : 10.1596/978-1-4648-1435-8 . hdl : 10986/29687 . ISBN 978-1-4648-1435-8 .
- Всемирная организация здравоохранения (2014 г.). Количественная оценка риска воздействия изменения климата на отдельные причины смертности, 2030-е и 2050-е годы (PDF) (Отчет). Женева, Швейцария. ISBN 978-92-4-150769-1 .
- Всемирная организация здравоохранения (2016). Загрязнение атмосферного воздуха: глобальная оценка воздействия и бремени болезней (Отчет). Женева, Швейцария. ISBN 978-92-4-151135-3 .
- Специальный доклад COP24 «Здоровье и изменение климата» (PDF) . Женева: Всемирная организация здравоохранения. 2018. ISBN 978-92-4-151497-2 .
- Заявление ВМО о состоянии глобального климата в 2020 году . ВМО-Нет. 1264. Женева: Всемирная метеорологическая организация . 2021. ISBN 978-92-63-11264-4 .
- Создание устойчивого продовольственного будущего: набор решений, которые позволят накормить почти 10 миллиардов человек к 2050 году (PDF) . Вашингтон, округ Колумбия: Институт мировых ресурсов. Декабрь 2019. ISBN 978-1-56973-953-2 .
Нетехнические источники
- Ассошиэйтед Пресс
- Колфорд, Пол (22 сентября 2015 г.). «Дополнение к записи AP Stylebook о глобальном потеплении» . Блог AP Style . Проверено 6 ноября 2019 г.
- Би-би-си
- «Парламент Великобритании объявляет чрезвычайную ситуацию, связанную с изменением климата» . Би-би-си. 1 мая 2019 года . Проверено 30 июня 2019 г.
- Ригби, Сара (3 февраля 2020 г.). «Изменение климата: стоит ли менять терминологию?» . Журнал BBC Science Focus . Проверено 24 марта 2020 г.
- Бюллетень ученых-атомщиков
- Стовер, Дон (23 сентября 2014 г.). «Перерыв в глобальном потеплении » . Бюллетень ученых-атомщиков . Архивировано из оригинала 11 июля 2020 года.
- Углеродный обзор
- Йео, Софи (4 января 2017 г.). «Чистая энергия: задача достижения «справедливого перехода» для работников» . Карбоновое резюме . Проверено 18 мая 2020 г.
- МакСвини, Роберт М.; Хаусфатер, Зик (15 января 2018 г.). «Вопросы и ответы: Как работают климатические модели?» . Карбоновое резюме . Архивировано из оригинала 5 марта 2019 года . Проверено 2 марта 2019 г.
- Хаусфатер, Зик (19 апреля 2018 г.). «Объяснитель: как «Общие социально-экономические пути» исследуют будущее изменение климата» . Карбоновое резюме . Проверено 20 июля 2019 г.
- Хаусфатер, Зик (8 октября 2018 г.). «Анализ: почему отчет МГЭИК 1,5C расширил углеродный бюджет» . Карбоновое резюме . Проверено 28 июля 2020 г.
- Данн, Дейзи; Габбатисс, Джош; Максвини, Роберт (7 января 2020 г.). «Реакция СМИ: лесные пожары в Австралии и изменение климата» . Карбоновое резюме . Проверено 11 января 2020 г.
- Climate.gov
- Линдси, Ребекка (23 июня 2022 г.). «Изменение климата: углекислый газ в атмосфере» . Климат.gov . Проверено 7 мая 2023 г.
- Немецкая волна
- Руис, Ирен Банос (22 июня 2019 г.). «Борьба с изменением климата: можем ли мы изменить климат на низовом уровне?» . Эковоч. Немецкая волна. Архивировано из оригинала 23 июня 2019 года . Проверено 23 июня 2019 г.
- Агентство по охране окружающей среды
- «Мифы против фактов: отказ в петициях о пересмотре угрозы и причины или содействия выводам в отношении парниковых газов в соответствии с разделом 202 (а) Закона о чистом воздухе» . Агентство по охране окружающей среды США. 25 августа 2016 года . Проверено 7 августа 2017 г.
- Агентство по охране окружающей среды США (13 сентября 2019 г.). «Глобальные данные о выбросах парниковых газов» . Архивировано из оригинала 18 февраля 2020 года . Проверено 8 августа 2020 г.
- Агентство по охране окружающей среды США (15 сентября 2020 г.). «Обзор парниковых газов» . Проверено 15 сентября 2020 г.
- EUobserver
- «Копенгагенская неудача «разочаровывает», «позорна» » . euobserver.com . 20 декабря 2009 г. Архивировано из оригинала 12 апреля 2019 г. . Проверено 12 апреля 2019 г.
- Европейский парламент
- Чиуччи, М. (февраль 2020 г.). «Возобновляемая энергетика» . Европейский парламент . Проверено 3 июня 2020 г.
- Хранитель
- Кэррингтон, Дамиан (19 марта 2019 г.). «Школьные климатические забастовки: в них приняли участие 1,4 миллиона человек, говорят активисты» . Хранитель . Архивировано из оригинала 20 марта 2019 года . Проверено 12 апреля 2019 г.
- Рэнкин, Дженнифер (28 ноября 2019 г.). « Наш дом горит»: парламент ЕС объявляет климатическую чрезвычайную ситуацию» . Хранитель . ISSN 0261-3077 . Проверено 28 ноября 2019 г.
- Уоттс, Джонатан (19 февраля 2020 г.). «Нефтяные и газовые компании «оказали гораздо более серьезное воздействие на климат, чем предполагалось» » . Хранитель .
- Кэррингтон, Дамиан (6 апреля 2020 г.). «Новые мощности возобновляемой энергетики достигли рекордного уровня в 2019 году» . Хранитель . Проверено 25 мая 2020 г.
- МакКарри, Джастин (28 октября 2020 г.). «Южная Корея обещает стать углеродно-нейтральной к 2050 году для борьбы с климатической катастрофой» . Хранитель . Проверено 6 декабря 2020 г.
- Международное энергетическое агентство
- «Прогнозируемые затраты на производство электроэнергии на 2020 год» . МЭА . 9 декабря 2020 г. Проверено 4 апреля 2022 г.
- НАСА
- «Арктическое усиление» . НАСА. 2013. Архивировано из оригинала 31 июля 2018 года.
- Конвей, Эрик М. (5 декабря 2008 г.). «Что в названии? Глобальное потепление против изменения климата» . НАСА. Архивировано из оригинала 9 августа 2010 года.
- Шафтель, Холли (январь 2016 г.). «Что в названии? Погода, глобальное потепление и изменение климата» . НАСА Изменение климата: жизненно важные признаки планеты . Архивировано из оригинала 28 сентября 2018 года . Проверено 12 октября 2018 г.
- Шафтель, Холли; Джексон, Рэндал; Каллери, Сьюзен; Бейли, Дэниел, ред. (7 июля 2020 г.). «Обзор: Погода, глобальное потепление и изменение климата» . Изменение климата: жизненно важные признаки планеты . Проверено 14 июля 2020 г.
- Национальная конференция законодателей штатов
- «Государственные стандарты и цели портфеля возобновляемых источников энергии» . Национальная конференция законодателей штатов . 17 апреля 2020 г. Проверено 3 июня 2020 г.
- Нэшнл Географик
- Уэлч, Крейг (13 августа 2019 г.). «Арктическая вечная мерзлота быстро тает. Это затрагивает всех нас» . Нэшнл Географик . Архивировано из оригинала 14 августа 2019 года . Проверено 25 августа 2019 г.
- Национальная научная цифровая библиотека
- Флеминг, Джеймс Р. (17 марта 2008 г.). «Изменение климата и антропогенное парниковое потепление: подборка ключевых статей, 1824–1995 гг., с поясняющими эссе» . Архив проекта Национальной научной цифровой библиотеки PALE:ClassicArticles . Проверено 7 октября 2019 г.
- Совет по защите природных ресурсов
- «Что такое план чистой энергии?» . Совет по защите природных ресурсов . 29 сентября 2017 года . Проверено 3 августа 2020 г.
- Нью-Йорк Таймс
- Радд, Кевин (25 мая 2015 г.). «Париж не может быть вторым Копенгагеном» . Нью-Йорк Таймс . Архивировано из оригинала 3 февраля 2018 года . Проверено 26 мая 2015 г.
- НОАА
- НОАА (10 июля 2011 г.). «Полярные противоположности: Арктика и Антарктика» . Архивировано из оригинала 22 февраля 2019 года . Проверено 20 февраля 2019 г.
- Хаддлстон, Амара (17 июля 2019 г.). «Поздравляю Юнис Фут с 200-летием, пионера науки о скрытом климате» . NOAA Climate.gov . Проверено 8 октября 2019 г.
- Наш мир в данных
- Ричи, Ханна; Розер, Макс (15 января 2018 г.). «Землепользование» . Наш мир в данных . Проверено 1 декабря 2019 г.
- Ричи, Ханна (18 сентября 2020 г.). «Отрасль за сектором: откуда берутся глобальные выбросы парниковых газов?» . Наш мир в данных . Проверено 28 октября 2020 г.
- Розер, Макс (2022). «Почему возобновляемые источники энергии так быстро стали дешевыми?» . Наш мир в данных . Проверено 4 апреля 2022 г.
- Исследовательский центр Пью
- Исследовательский центр Пью (16 октября 2020 г.). «Многие люди во всем мире обеспокоены изменением климата так же, как и распространением инфекционных заболеваний» . Проверено 19 августа 2021 г.
- Политический
- Тамма, Паола; Шаарт, Элин; Гурзу, Анка (11 декабря 2019 г.). «План Европы по «зеленому курсу» обнародован» . Политик . Проверено 29 декабря 2019 г.
- РИВМ
- Документальный фильм «Морская слепота» (голландское телевидение) (на голландском языке). RIVM: Национальный институт общественного здравоохранения и окружающей среды Нидерландов. 11 октября 2016 г. Архивировано из оригинала 17 августа 2018 г. . Проверено 26 февраля 2019 г.
- Салон
- Леопольд, Эвелин (25 сентября 2019 г.). «Как лидеры планировали предотвратить климатическую катастрофу в ООН (пока Трамп тусовался в подвале)» . Салон . Проверено 20 ноября 2019 г.
- НаукаБлоги
- Глейк, Питер (7 января 2017 г.). «Заявления крупных научных академий, обществ и ассоциаций об изменении климата (обновление за январь 2017 г.)» . Научные блоги . Проверено 2 апреля 2020 г.
- Научный американец
- Огберн, Стефани Пейдж (29 апреля 2014 г.). «Индийские муссоны становятся все более экстремальными» . Научный американец . Архивировано из оригинала 22 июня 2018 года.
- Смитсоновский институт
- Винг, Скотт Л. (29 июня 2016 г.). «Изучение климата прошлого необходимо для подготовки к сегодняшнему быстро меняющемуся климату» . Смитсоновский институт . Проверено 8 ноября 2019 г.
- Консорциум устойчивого развития
- «Одна четверть глобальных потерь лесов постоянна: вырубка лесов не замедляется» . Консорциум устойчивого развития . 13 сентября 2018 года . Проверено 1 декабря 2019 г.
- РКИК ООН
- «Что такое конференции ООН по изменению климата?» . РКИК ООН . Архивировано из оригинала 12 мая 2019 года . Проверено 12 мая 2019 г.
- «Что такое Рамочная конвенция ООН об изменении климата?» . РКИК ООН .
- Союз обеспокоенных ученых
- «Ценообразование на выбросы углерода 101» . Союз неравнодушных ученых . 8 января 2017 года . Проверено 15 мая 2020 г.
- Порок
- Сегалов, Михаил (2 мая 2019 г.). «Великобритания объявила климатическую чрезвычайную ситуацию: что теперь?» . Порок . Проверено 30 июня 2019 г.
- Грань
- Кальма, Жюстин (27 декабря 2019 г.). «2019 год стал годом деклараций о «чрезвычайной климатической ситуации»» . Грань . Проверено 28 марта 2020 г.
- Вокс
- Робертс, Д. (20 сентября 2019 г.). «Для достижения 100% использования возобновляемых источников энергии необходимо дешевое хранение энергии. Но насколько дешевое?» . Вокс . Проверено 28 мая 2020 г.
- Всемирная организация здравоохранения
- «ВОЗ призывает к срочным действиям по защите здоровья от изменения климата – подпишите призыв» . Всемирная организация здравоохранения . Ноябрь 2015 г. Архивировано из оригинала 3 января 2021 г. Проверено 2 сентября 2020 г.
- Институт мировых ресурсов
- Батлер, Ретт А. (31 марта 2021 г.). «Глобальная потеря лесов в 2020 году увеличится» . Монгабай . Архивировано из оригинала 1 апреля 2021 года. ● Монгабай представляет собой график данных WRI из «Утрата лесов / Сколько древесного покрова ежегодно теряется в мире?» . исследование.WRI.org . Институт мировых ресурсов – Глобальный обзор лесов. Январь 2021 г. Архивировано из оригинала 2 августа 2023 г.
- Левин, Келли (8 августа 2019 г.). «Насколько эффективна земля в удалении углеродного загрязнения? Мнение МГЭИК» . Институт мировых ресурсов . Проверено 15 мая 2020 г.
- Сеймур, Фрэнсис; Гиббс, Дэвид (8 декабря 2019 г.). «Леса в специальном докладе МГЭИК о землепользовании: 7 вещей, которые нужно знать» . Институт мировых ресурсов .
- Йельский климатические связи
- Пич, Сара (2 ноября 2010 г.). «Исследователь из Йельского университета Энтони Лейзеровиц об обучении и общении с американской общественностью» . Йельский климатические связи. Архивировано из оригинала 7 февраля 2019 года . Проверено 30 июля 2018 г.
Внешние ссылки
- Межправительственная группа экспертов по изменению климата: МГЭИК ( IPCC )
- ООН: Изменение климата ( ООН )
- Метеорологическое бюро: Климатический справочник ( Метеорологическое бюро )
- Национальное управление океанических и атмосферных исследований: климат ( НОАА )
| |||||
| |||||
| |||||
| |||||