Частицы
| Часть серии о |
| Загрязнение |
|---|
 |
Твердые частицы или атмосферные твердые частицы ( см . ниже другие названия ) представляют собой микроскопические частицы твердого или жидкого вещества, взвешенные в воздухе . Термин «аэрозоль» твердых частиц и воздуха обычно относится к смеси , а не только к твердым частицам. [ 1 ] Источники твердых частиц могут быть природными или антропогенными . [ 2 ] Они оказывают воздействие на климат и осадки человека , которые отрицательно влияют на здоровье , помимо прямого вдыхания.

Типы атмосферных частиц включают взвешенные твердые частицы; грудные и респирабельные частицы; [ 3 ] частицы, обозначаемые PM 10 , которые представляют собой крупные частицы диаметром вдыхаемые крупные 10 микрометров (мкм) или менее; мелкие частицы, обозначенные PM 2,5 , диаметром 2,5 мкм или менее; [ 4 ] ультрамелкие частицы диаметром 100 нм или менее; и сажа .
Взвешенные в воздухе твердые частицы являются канцерогенами первой группы . [ 5 ] Particulates are the most harmful form (other than ultra-fines) of air pollution[6] as they can penetrate deep into the lungs and brain from blood streams, causing health problems such as heart disease, lung disease, cancer and preterm birth.[7] There is no safe level of particulates. Worldwide, exposure to PM2.5 contributed to 4.1 million deaths from heart disease, stroke, lung cancer, chronic lung disease, and respiratory infections in 2016.[8] Overall, ambient particulate matter is one of the leading risk factor for premature death globally.[9]
Sources
[edit]
Human activities generate significant amounts of particulates. For example:
- Burning of fossil fuels (e.g., aircraft),[10][11][12] joss paper,[13][14][15] waste,[16] firecrackers[17] and biomass including wood[18] and crop residue.
- Construction (including activities of building rehabilitation/ refurbishment or demolition).[19][20][21][22]
- Renovation.[23][24]
- Roadworks, diesel exhausts of the heavy equipments used, emission from the production of building materials, etc.[25][26][27][28]
- Dusty materials that are not cleaned up or properly covered (e.g., in construction sites, landfills and ceramics production facilities; ashes left from burning or wildfires).[29][30][31]
- Metalworking (e.g., welding).[32]
- Woodworking.[33][34]
- Glass reprocessing.
- Industries.[4]
- Cooking (frying, boiling, grilling).[35]
- Agricultural activities (e.g., ploughing and soil tilling).[36]
- Power plants.[37]
- Waste incineration.[38][39]
- Road dust from tyre and road wear[40] and road dust from unpaved road.[41]
- Wet cooling towers in cooling systems.
- Various industrial processes such as mining,[42][43] smelting[44] and oil refining.[45]
- Disasters[46] (both natural or caused by humans, e.g., wildfires, earthquakes, wars,[47][48] and September 11 attacks, etc.).
- Microplastics (gaining attention as a type of airborne PM).[49][50]
Human-made (anthropogenic) aerosols account for about 10 percent of the total mass of aerosols in the atmosphere as estimated in 2010. The remaining 90 percent comes from natural sources such as volcanoes, dust storms, forest and grassland fires, living vegetation and sea spray, emitting particulates such as volcanic ash, desert dust, soot and sea salt.[51]
Domestic combustion and wood smoke
[edit]In the United Kingdom domestic combustion is the largest single source of PM2.5 and PM10 annually, with domestic wood burning in both closed stoves and open fires responsible for 38% of PM2.5 in 2019.[52][53][54] To tackle the problem some new laws were introduced since 2021. In some towns and cities in New South Wales wood smoke may be responsible for 60% of fine particle air pollution in the winter.[55]
There are a few ways to reduce wood smoke, e.g., buying the right wood heater and maintaining it well,[56] choosing the right firewood[57] and burning it the right way.[58] There are also regulations in some countries where people can report smoke pollution to the local council. [59]
Composition
[edit]Red/orange: desert (mineral) dust
Blue: sea salt
Green: smoke
White: sulfate particles[60][61]
The composition and toxicity of aerosols, including particles, depends on their source and atmospheric chemistry and varies widely. Wind-blown mineral dust[62] tends to be made of mineral oxides and other material blown from the Earth's crust; this particulate is light-absorbing.[63] Sea salt[64] is considered the second-largest contributor in the global aerosol budget, and consists mainly of sodium chloride originated from sea spray; other constituents of atmospheric sea salt reflect the composition of sea water, and thus include magnesium, sulfate, calcium, potassium, and others. In addition, sea spray aerosols may contain organic compounds like fatty acids and sugars, which influence their chemistry.[65]
Some secondary particles derive from the oxidation of primary gases such as sulfur and nitrogen oxides into sulfuric acid (liquid) and nitric acid (gaseous) or from biogenic emissions. The precursors for these aerosols—i.e. the gases from which they originate—may have an anthropogenic origin (from biomass and fossil fuel combustion) as well as a natural biogenic origin. In the presence of ammonia, secondary aerosols often take the form of ammonium salts; i.e. ammonium sulfate and ammonium nitrate (both can be dry or in aqueous solution); in the absence of ammonia, secondary compounds take an acidic form as sulfuric acid (liquid aerosol droplets) and nitric acid (atmospheric gas).
Secondary sulfate and nitrate aerosols are strong light-scatterers.[66] This is mainly because the presence of sulfate and nitrate causes the aerosols to increase to a size that scatters light effectively.
Organic matter (OM) found in aerosols can be either primary or secondary, the latter part deriving from the oxidation of volatile organic compounds (VOCs); organic material in the atmosphere may either be biogenic or anthropogenic. Organic matter influences the atmospheric radiation field by both scattering and absorption. Some aerosols are predicted to include strongly light-absorbing material and are thought to yield large positive radiative forcing. Some secondary organic aerosols (SOAs) resulting from combustion products of internal combustion engines, have been identified as a danger to health.[67] Particulate toxicity has been found to vary by region and source contribution which affects the particles chemical composition.
The chemical composition of the aerosol directly affects how it interacts with solar radiation. The chemical constituents within the aerosol change the overall refractive index. The refractive index will determine how much light is scattered and absorbed.
The composition of particulate matter that generally causes visual effects, haze, consists of sulfur dioxide, nitrogen oxides, carbon monoxide, mineral dust, and organic matter. The particles are hygroscopic due to the presence of sulfur, and SO2 is converted to sulfate when high humidity and low temperatures are present. This causes reduced visibility and red-orange-yellow colors.[68]
Size distribution
[edit]Human-produced aerosols such as particle pollution tend to have a smaller radius than aerosol particles of natural origin (such as windblown dust). The false-color maps in the map of distribution of aerosol particles on the right show where there are natural aerosols, human pollution, or a mixture of both, monthly.
Smaller aerosols in the North
[edit]The size distribution time series shows that in the planet's most southerly latitudes, nearly all the aerosols are large, but in the high northern latitudes, smaller aerosols are very abundant. Most of the Southern Hemisphere is covered by the ocean, where the largest source of aerosols is natural sea salt from dried sea spray. Because the land is concentrated in the Northern Hemisphere, the amount of small aerosols from fires and human activities is greater there than in the Southern Hemisphere. Overland, patches of large-radius aerosols appear over deserts and arid regions, most prominently, the Sahara Desert in North Africa and the Arabian Peninsula, where dust storms are common. Places where human-triggered or natural fire activity is common (land-clearing fires in the Amazon from August–October, for example, or lightning-triggered fires in the forests of northern Canada in Northern Hemisphere summer) are dominated by smaller aerosols. Human-produced (fossil fuel) pollution is largely responsible for the areas of small aerosols over developed areas such as the eastern United States and Europe, especially in their summer.[69][better source needed]
Satellite measurements of aerosols, called aerosol optical thickness, are based on the fact that the particles change the way the atmosphere reflects and absorbs visible and infrared light. As shown in this page, an optical thickness of less than 0.1 (palest yellow) indicates a crystal clear sky with maximum visibility, whereas a value of 1 (reddish-brown) indicates very hazy conditions.[better source needed]
Deposition processes
[edit]In general, the smaller and lighter a particle is, the longer it will stay in the air. Larger particles (greater than 10 micrometers in diameter) tend to settle to the ground by gravity in a matter of hours. The smallest particles (less than 1 micrometer) can stay in the atmosphere for weeks and are mostly removed by precipitation. There are evidence that aerosols can "travel across the ocean". For example, in September 2017 wildfires burning across the western United States and Canada, and the smoke was found to have arrived over the United Kingdom and northern France in three days, as shown by satellite images.[70] Diesel particulate matter is highest near the source of emission.[71] Any information regarding DPM and the atmosphere, flora, height, and distance from major sources is useful to determine health effects.
Control
[edit]Technologies
[edit]Particulate matter emissions are highly regulated in most industrialized countries. Due to environmental concerns, most industries are required to operate some kind of dust collection system.[72] These systems include inertial collectors (cyclonic separators), fabric filter collectors (baghouses), electrostatic filters used in facemasks,[73] wet scrubbers, and electrostatic precipitators.
Cyclonic separators are useful for removing large, coarse particles and are often employed as a first step or "pre-cleaner" to other more efficient collectors. Well-designed cyclonic separators can be very efficient in removing even fine particulates,[74] and may be operated continuously without requiring frequent shutdowns for maintenance.[citation needed]
Fabric filters or baghouses are the most commonly employed in general industry.[75] They work by forcing dust-laden air through a bag-shaped fabric filter leaving the particulate to collect on the outer surface of the bag and allowing the now clean air to pass through to either be exhausted into the atmosphere or in some cases recirculated into the facility. Common fabrics include polyester and fiberglass and common fabric coatings include PTFE (commonly known as Teflon). The excess dust buildup is then cleaned from the bags and removed from the collector.
Wet scrubbers pass the dirty air through a scrubbing solution (usually a mixture of water and other compounds) allowing the particulate to attach to the liquid molecules.[84] Electrostatic precipitators electrically charge the dirty air as it passes through. The now charged air then passes through large electrostatic plates which attract the charged particle in the airstream collecting them and leaving the now clean air to be exhausted or recirculated.[85]
Measures
[edit]For general building construction, some places that have acknowledged the possible health risks of construction dust for decades legally require the relevant contractor to adopt effective dust control measures, although inspections, fines and imprisonments are rare in recent years (for example, two prosecutions with a total fines of HKD$6000 in Hong Kong in the year 2021).[86][87]
Some of the mandatory dust control measures include[88][83][89][90] load, unload, handle, transfer, store or dispose of cement or dry pulverized fuel ash in a completely enclosed system or facility, and fit any vent or exhaust with an effective fabric filter or equivalent air pollution control system or equipment, enclose the scaffolding of the building with dust screens, use impervious sheeting to enclose both material hoist and debris chute, wet debris with water before it is dumped into a debris chute, have water sprayed on the facade surface before and during grinding work, use grinder equipped with vacuum cleaner for facade grinding work, spray water continuously on the surface for any pneumatic or power-driven drilling, cutting, polishing or other mechanical breaking operation that causes dust emission, unless there is the operation of an effective dust extraction and filtering device, provide hoarding of not less than 2.4 m in height along the whole length of the site boundary, have hard paving on open area and wash every vehicle that leaves the construction sites. Use of automatic sprinkler equipment, automatic carwash equipment and installation of video surveillance system for the pollution control facilities and retain the videos for one month for future inspections.
Besides removing particulates from the source of pollution, they may also be cleaned in the open air (e.g. smog tower, moss wall, and water truck),[91] while other control measures employ the use of barriers.[92]
Measurement
[edit]Particulates have been measured in increasingly sophisticated ways since air pollution was first systematically studied in the early 20th century. The earliest methods included relatively crude Ringelmann charts, which were grey-shaded cards against which emissions from smokestacks could be visually compared, and deposit gauges, which collected the soot deposited in a particular location so it could be weighed. Automated, modern methods of measuring particulates include optical photodetectors, tapered element oscillating microbalances, and Aethalometers.[93] Besides measuring the total mass of particles per unit volume of air (particle mass concentration), sometimes it is more useful to measure the total number of particles per unit volume of air (particle number concentration). This can be done by using a condensation particle counter (CPC).[94][95]
To measure the atomic composition of particulate samples, techniques such as X-ray spectrometry can be used.[96]
Climate effects
[edit]This section may be too technical for most readers to understand. (August 2024) |

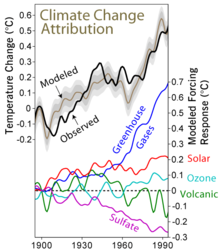
Atmospheric aerosols affect the climate of the Earth by changing the amount of incoming solar radiation and outgoing terrestrial longwave radiation retained in the Earth's system. This occurs through several distinct mechanisms which are split into direct, indirect[98][99] and semi-direct aerosol effects. The aerosol climate effects are the biggest source of uncertainty in future climate predictions.[100] The Intergovernmental Panel on Climate Change (IPCC) stated in 2001:[101]
While the radiative forcing due to greenhouse gases may be determined to a reasonably high degree of accuracy... the uncertainties relating to aerosol radiative forcings remain large, and rely to a large extent on the estimates from global modeling studies that are difficult to verify at the present time.
Aerosol radiative
[edit]
Direct
[edit]
The direct aerosol effect consists of any direct interaction of radiation with atmospheric aerosols, such as absorption or scattering. It affects both short and longwave radiation to produce a net negative radiative forcing.[102] The magnitude of the resultant radiative forcing due to the direct effect of an aerosol is dependent on the albedo of the underlying surface, as this affects the net amount of radiation absorbed or scattered to space. For example, if a highly scattering aerosol is above a surface of low albedo it has a greater radiative forcing than if it was above a surface of high albedo. The converse is true of absorbing aerosol, with the greatest radiative forcing arising from a highly absorbing aerosol over a surface of high albedo.[98] The direct aerosol effect is a first-order effect and is therefore classified as a radiative forcing by the IPCC.[100] The interaction of an aerosol with radiation is quantified by the single-scattering albedo (SSA), the ratio of scattering alone to scattering plus absorption (extinction) of radiation by a particle. The SSA tends to unity if scattering dominates, with relatively little absorption, and decreases as absorption increases, becoming zero for infinite absorption. For example, the sea-salt aerosol has an SSA of 1, as a sea-salt particle only scatters, whereas soot has an SSA of 0.23, showing that it is a major atmospheric aerosol absorber.[citation needed]
Indirect
[edit]The Indirect aerosol effect consists of any change to the Earth's radiative budget due to the modification of clouds by atmospheric aerosols and consists of several distinct effects. Cloud droplets form onto pre-existing aerosol particles, known as cloud condensation nuclei (CCN). Droplets condensing around human-produced aerosols such as found in particulate pollution tend to be smaller and more numerous than those forming around aerosol particles of natural origin (such as windblown dust).[51]
For any given meteorological conditions, an increase in CCN leads to an increase in the number of cloud droplets. This leads to more scattering of shortwave radiation i.e. an increase in the albedo of the cloud, known as the cloud albedo effect, First indirect effect or Twomey effect.[99] Evidence supporting the cloud albedo effect has been observed from the effects of ship exhaust plumes[103] and biomass burning[104] on cloud albedo compared to ambient clouds. The Cloud albedo aerosol effect is a first order effect and therefore classified as a radiative forcing by the IPCC.[100]
An increase in cloud droplet number due to the introduction of aerosol acts to reduce the cloud droplet size, as the same amount of water is divided into more droplets. This has the effect of suppressing precipitation, increasing the cloud lifetime, known as the cloud lifetime aerosol effect, second indirect effect or Albrecht effect.[100] This has been observed as the suppression of drizzle in ship exhaust plume compared to ambient clouds,[105] and inhibited precipitation in biomass burning plumes.[106] This cloud lifetime effect is classified as a climate feedback (rather than a radiative forcing) by the IPCC due to the interdependence between it and the hydrological cycle.[100] However, it has previously been classified as a negative radiative forcing.[107]
Semi-direct
[edit]The Semi-direct effect concerns any radiative effect caused by absorbing atmospheric aerosol such as soot, apart from direct scattering and absorption, which is classified as the direct effect. It encompasses many individual mechanisms, and in general is more poorly defined and understood than the direct and indirect aerosol effects. For instance, if absorbing aerosols are present in a layer aloft in the atmosphere, they can heat surrounding air which inhibits the condensation of water vapour, resulting in less cloud formation.[108] Additionally, heating a layer of the atmosphere relative to the surface results in a more stable atmosphere due to the inhibition of atmospheric convection. This inhibits the convective uplift of moisture,[109] which in turn reduces cloud formation. The heating of the atmosphere aloft also leads to a cooling of the surface, resulting in less evaporation of surface water. The effects described here all lead to a reduction in cloud cover i.e. an increase in planetary albedo. The semi-direct effect classified as a climate feedback) by the IPCC due to the interdependence between it and the hydrological cycle.[100] However, it has previously been classified as a negative radiative forcing.[107]
Specific aerosol roles
[edit]Sulfate
[edit]Sulfate aerosols are mostly inorganic sulfur compounds like (SO42-),HSO4- and H2SO4-,[110] which are mainly produced when sulfur dioxide reacts with water vapor to form gaseous sulfuric acid and various salts (often through an oxidation reaction in the clouds), which are then thought to experience hygroscopic growth and coagulation and then shrink through evaporation.[111][112] Some of them are biogenic (typically produced via atmospheric chemical reactions with dimethyl sulfide from mostly marine plankton[113]) or geological via volcanoes or weather-driven from wildfires and other natural combustion events,[112] but in the recent decades anthropogenic sulfate aerosols produced through combustion of fossil fuels with a high sulfur content, primarily coal and certain less-refined fuels, like aviation and bunker fuel, had dominated.[114] By 1990, global human-caused emissions of sulfur into the atmosphere became "at least as large" as all natural emissions of sulfur-containing compounds combined, and were at least 10 times more numerous than the natural aerosols in the most polluted regions of Europe and North America,[115] where they accounted for 25% or more of all air pollution.[116] This led to acid rain,[117][118] and also contributed to heart and lung conditions [116] and even the risk of preterm birth and low birth weight.[119] Sulfate pollution also has a complex relationship with NOx pollution and ozone, reducing the also harmful ground-level ozone, yet capable of damaging the stratospheric ozone layer as well.[120]
Once the problem became clear, the efforts to remove this pollution through flue-gas desulfurization measures and other pollution controls were largely successful,[121] reducing their prevalence by 53% and causing healthcare savings valued at $50 billion annually in the United States alone.[122][116][123] Yet, around the same time, research had shown that sulfate aerosols were affecting both the visible light received by the Earth and its surface temperature,[124] and as the so-called global dimming) began to reverse in the 1990s in line with the reduced anthropogenic sulfate pollution,[125][126][127] climate change accelerated.[128] As of 2021, state-of-the-art CMIP6 models estimate that total cooling from the currently present aerosols is between 0.1 °C (0.18 °F) to 0.7 °C (1.3 °F);[129] the IPCC Sixth Assessment Report uses the best estimate of 0.5 °C (0.90 °F),[130] with the uncertainty mainly caused by contradictory research on the impacts of aerosols of clouds.[131][132][133][134][135][136] Some are certain that they cool the planet, though, and this led to solar geoengineering proposals known as stratospheric aerosol injection, which seeks to replicate and enhance the cooling from sulfate pollution while minimizing the negative effects on health through deploying in the stratosphere, where only a fraction of the current sulfur pollution would be needed to avoid multiple degrees of warming,[137] but the assessment of costs and benefits remains incomplete,[138] even with hundreds of studies into the subject completed by the early 2020s.[139]
Black carbon
[edit]Black carbon (BC), or carbon black, or elemental carbon (EC), often called soot, is composed of pure carbon clusters, skeleton balls and fullerenes, and is one of the most important absorbing aerosol species in the atmosphere. It should be distinguished from organic carbon (OC): clustered or aggregated organic molecules on their own or permeating an EC buckyball. Black carbon from fossil fuels is estimated by the IPCC in the Fourth Assessment Report of the IPCC, 4AR, to contribute a global mean radiative forcing of +0.2 W/m2 (was +0.1 W/m2 in the Second Assessment Report of the IPCC, SAR), with a range +0.1 to +0.4 W/m2. A study published in 2013 however, states that "the best estimate for the industrial-era (1750 to 2005) direct radiative forcing of atmospheric black carbon is +0.71 W/m2 with 90% uncertainty bounds of (+0.08, +1.27) W/m2" with "total direct forcing by all-black carbon sources, without subtracting the preindustrial background, is estimated as +0.88 (+0.17, +1.48) W/m2".[140]
Instances
[edit]Volcanoes are a large natural source of aerosol and have been linked to changes in the Earth's climate often with consequences for the human population. Eruptions linked to changes in climate include the 1600 eruption of Huaynaputina which was linked to the Russian famine of 1601–1603,[141][142][143] leading to the deaths of two million, and the 1991 eruption of Mount Pinatubo which caused a global cooling of approximately 0.5 °C lasting several years.[144][145] Research tracking the effect of light-scattering aerosols in the stratosphere during 2000 and 2010 and comparing its pattern to volcanic activity show a close correlation. Simulations of the effect of anthropogenic particles showed little influence at present levels.[146][147]
Aerosols are also thought to affect weather and climate on a regional scale. The failure of the Indian monsoon has been linked to the suppression of evaporation of water from the Indian Ocean due to the semi-direct effect of anthropogenic aerosol.[148]
Recent studies of the Sahel drought[149] and major increases since 1967 in rainfall in Australia over the Northern Territory, Kimberley, Pilbara and around the Nullarbor Plain have led some scientists to conclude that the aerosol haze over South and East Asia has been steadily shifting tropical rainfall in both hemispheres southward.[148][150]
Health effects
[edit]

Size, shape, and solubility matter
[edit]Size
[edit]Particle size is the main determinant of where in the respiratory tract it will come to rest when inhaled. Larger particles are generally filtered in the nose and throat via cilia and mucus, but particulate matter smaller than about 10 micrometers can settle in the bronchi and lungs and cause health problems. The 10-micrometer size does not represent a strict boundary between respirable and non-respirable particles but has been agreed upon for monitoring of airborne PM by most regulatory agencies. Because of their small size, particles on the order of 10 micrometers or less (coarse particulate matter, PM10) can penetrate the deepest part of the lungs such as the bronchioles or alveoli.[151] When asthmatics are exposed to these conditions it can trigger bronchoconstriction.[152]
Similarly, fine particulate matter (PM2.5) tends to penetrate into the gas exchange regions of the lung (alveoli), and very small particles (ultrafine particulate matter PM0.1) may pass through the lungs to affect other organs. Penetration of particles is not wholly dependent on their size; shape and chemical composition also play a part. To avoid this complication, simple nomenclature is used to indicate the different degrees of relative penetration of a PM particle into the cardiovascular system. Inhalable particles penetrate no further than the bronchi as they are filtered out by the cilia. Thoracic particles can penetrate right into terminal bronchioles.
In analogy, the inhalable dust fraction is the fraction of dust entering the nose and mouth which may be deposited anywhere in the respiratory tract. The thoracic fraction is the fraction that enters the thorax and is deposited within the lung's airways. The respirable fraction is what is deposited in the gas exchange regions (alveoli).[153]
The smallest particles, nanoparticles, which are less than 180 nanometers in size, may be even more damaging to the cardiovascular system.[154][155] Nanoparticles can pass through cell membranes and migrate into other organs, including the brain. Particles emitted from modern diesel engines (commonly referred to as Diesel Particulate Matter, or DPM) are typically in the size range of 100 nanometers (0.1 micrometers). These soot particles also carry carcinogens like benzopyrenes adsorbed on their surface.
Particulate mass is not a proper measure of the health hazard. A particle of 10 μm diameter has approximately the same mass as 1 million particles of 100 nm diameter, but is much less hazardous, as it is unlikely to enter the alveoli. Legislative limits for engine emissions based on mass are therefore not protective. Proposals for new regulations exist in some countries,[which?] with suggestions to limit the particle surface area or the particle count (numerical quantity) / particle number concentration (PNC) instead.[156][157]
Solubility
[edit]The site and extent of absorption of inhaled gases and vapors are determined by their solubility in water. Absorption is also dependent upon air flow rates and the partial pressure of the gases in the inspired air. The fate of a specific contaminant is dependent upon the form in which it exists (aerosol or particulate). Inhalation also depends upon the breathing rate of the subject.[158]
Shape
[edit]Another complexity not entirely documented is how the shape of PM can affect health, except for the needle-like shape of asbestos fibres which can lodge in the lungs. Geometrically angular shapes have more surface area than rounder shapes, which in turn affects the binding capacity of the particle to other, possibly more dangerous substances.[citation needed] The table below lists the colours and shapes of some common atmospheric particulates:[159]
| Type of particulate | Color | Shape |
|---|---|---|
| Portland cement | Gray | Irregular |
| Smolder smoke | White | Spherical |
| Soot | Black | Fractal aggregate |
| Water droplets | White | Spherical |
| Loess | Yellow Brown | Irregular |
| Lokon volcanic ash | Dark Brown | Irregular |
| Sahara sand (Libya) | Brown | Irregular |
-
 Scanning electron microscopy of glass powder originated from glass bottles
 -
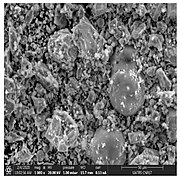 Scanning electron microscopy of cement
 -
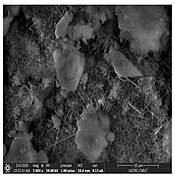 Scanning electron microscopy of mortar glass powder (10%) which seems to have fibre-like structure
 -
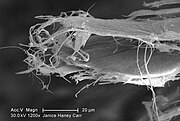 Scanning electron microscopy of white asbestos with needle-like shape fibre


Composition, quantity, and duration are important
[edit]This section needs expansion. You can help by adding to it. (February 2023) |

Composition of particles can vary greatly depending on their sources and how they are produced. For example, dust emitted from the burning of living and dead vegetation would be different from those emitted from the burning of joss paper or construction wastes. Particles emitted from fuel combustion are not the same as those emitted from waste combustion. The particulate matter generated from the fire of a recycling yard[160] or a ship full of scrap metal[161][162] may contain more toxic substances than other types of burning.
Different types of building refurbishment activities produce different kinds of dust too. The composition of PM generated from cutting or mixing concrete made with Portland Cement would be different from those generated from cutting or mixing concrete made with different types of slag (e.g. GGBFS, EAF slag[163]), fly ash or even EAF dust (EAFD),[164] while EFAD, slag and fly ash are likely to be more toxic as they contain heavy metals. Besides slag cement that is sold and used as an environmental friendly product,[165][166][167] fake (adulterated) cement, where different types of slag, fly ash or other unknown substances are added, is also very common in some places[168][169] due to the much lower production cost.[170] To address to the quality[171] and toxicity problems, some places are starting to ban the use of EAF slag in cement used in buildings.[172] Composition of welding fumes varies a lot as well and it depends on the metals in the material being welded, the composition of the coatings, electrode, etc., and hence a lot of health problems (e.g., lead poisoning, metal Fume Fever, cancers, nausea, irritation, kidney and liver damage, central nervous system problems, asthma, pneumonia, etc.) can be resulted from the different types of toxic emissions.[173]
Studies have found that blood lead levels of people in China are highly correlated to ambient PM2.5 concentration as well as top soil lead content, indicating that air and soil (e.g., by the inhalation of resuspended soil particles, consuming of contaminated crops or water, etc.) are important sources of lead exposure.[174][175]
Besides composition, quantity and duration of exposure are also important, since they would affect the triggering and severity of a disease. Particles that get into indoor would directly affect indoor air quality. Possible secondary contamination, similar to third-hand smoke, is also of concern.[176][177]
In a nutshell, while background concentration is important, only "improvement in air quality" or "decrease in ambient concentration of PM" do not necessarily mean better health. The health impact mainly depends on the toxicity (or source[178]) of the particulate matter a person is exposed to, the amount he is exposed to and for how long, and also the size, shape, and solubility of the PM.
Since construction and refurbishment projects are prominent sources of particulate matter, it implicates that such projects, which are very common in some places,[179][180] should be avoided in health facilities that already commenced and under operation as far as possible. For inevitable projects, better plannings and mitigation measures regarding PM emission should be introduced. Use of power tools, heavy equipments, diesel fuels and potentially toxic building materials (e.g. concrete, metals, solder, paint, etc.) should be strictly monitored to ensure that patients who are there seeking for disease treatments or chances to survive are not adversely affected.
Health problems
[edit]This section needs to be updated. (July 2023) |


The effects of inhaling particulate matter that have been widely studied in humans and animals include COVID-19,[181][182][183][184][185] asthma, lung cancer, respiratory diseases like silicosis, [186] [187] cardiovascular disease, premature delivery, birth defects, low birth weight, developmental disorders,[188][189][190][191] neurodegenerative disorders[192][193] mental disorders,[194][195][196] and premature death. Outdoor fine particulates with diameter less than 2.5 microns accounts for 4.2 million annual deaths worldwide, and more than 103 million disability-adjusted life-years lost, making it the fifth leading risk factor for death. Air pollution has also been linked to a range of other psychosocial problems.[195] Particulates may cause tissue damage by entering organs directly, or indirectly by systemic inflammation. Adverse effects may occur even at exposure levels lower than published air quality standards deemed safe.[197][198]
Anthropogenic fine particulates as main hazard
[edit]Increased levels of fine particles in the air as a result of anthropogenic particulate air pollution "is consistently and independently related to the most serious effects, including lung cancer[199] and other cardiopulmonary mortality".[200] The association between a large number of deaths[201] and other health problems and particulate pollution was first demonstrated in the early 1970s[202] and has been reproduced many times since. PM pollution is estimated to cause 22,000–52,000 deaths per year in the United States (from 2000)[203] contributed to ~370,000 premature deaths in Europe during 2005.[204] and 3.22 million deaths globally in 2010 per the global burden of disease collaboration.[205] A study by the European Environment Agency estimates that 307,000 people have died prematurely in 2019 due to fine particle pollution in the 27 EU member states.[206]
A study in 2000 conducted in the U.S. explored how fine particulate matter may be more harmful than coarse particulate matter. The study was based on six different cities. They found that deaths and hospital visits that were caused by particulate matter in the air were primarily due to fine particulate matter.[207] Similarly, a 1987 study of American air pollution data found that fine particles and sulfates, as opposed to coarser particles, most consistently and significantly correlated to total annual mortality rates in standard metropolitan statistical areas.[208]
A study published in 2022 in GeoHealth concluded that eliminating energy-related fossil fuel emissions in the United States would prevent 46,900–59,400 premature deaths each year and provide $537–$678 billion in benefits from avoided PM2.5-related illness and death.[209]
Infertility, pregnancy, fetuses and birth defects
[edit]Higher rates of infertility have been correlated with exposure to particulates.[210] Maternal PM2.5 exposure during pregnancy is also associated with high blood pressure in children.[211]
Inhalation of PM2.5 – PM10 is associated with elevated risk of adverse pregnancy outcomes, such as low birth weight.[212] Exposure to PM2.5 has been associated with greater reductions in birth weight than exposure to PM10.[213] PM exposure can cause inflammation, oxidative stress, endocrine disruption, and impaired oxygen transport access to the placenta,[214] all of which are mechanisms for heightening the risk of low birth weight.[215] Overall epidemiologic and toxicological evidence suggests that a causal relationship exists between long-term exposures to PM2.5 and developmental outcomes (i.e. low birth weight).[213] Studies investigating the significance of trimester-specific exposure have proven to be inconclusive,[216] and results of international studies have been inconsistent in drawing associations of prenatal particulate matter exposure and low birth weight.[213] As perinatal outcomes have been associated with lifelong health[217][218] and exposure to particulate matter is widespread, this issue is of critical public health importance.
Cardiovascular and respiratory disease
[edit]PM2.5 leads to high plaque deposits in arteries, causing vascular inflammation and atherosclerosis – a hardening of the arteries that reduces elasticity, which can lead to heart attacks and other cardiovascular problems.[219] A 2014 meta analysis reported that long term exposure to particulate matter is linked to coronary events. The study included 11 cohorts participating in the European Study of Cohorts for Air Pollution Effects (ESCAPE) with 100,166 participants, followed for an average of 11.5 years. An increase in estimated annual exposure to PM 2.5 of just 5 μg/m3 was linked with a 13% increased risk of heart attacks.[220] Not only affecting human cells and tissues, PM also impacts bacteria which cause disease in humans.[221] Biofilm formation, antibiotic tolerance, and colonisation of both Staphylococcus aureus and Streptococcus pneumoniae was altered by black carbon exposure.
The largest US study on acute health effects of coarse particle pollution between 2.5 and 10 micrometers in diameter was published 2008 and found an association with hospital admissions for cardiovascular diseases but no evidence of an association with the number of hospital admissions for respiratory diseases.[222] After taking into account fine particle levels (PM2.5 and less), the association with coarse particles remained but was no longer statistically significant, which means the effect is due to the subsection of fine particles.
The Mongolian government agency recorded a 45% increase in the rate of respiratory illness in the past five years (reported in 2011).[223] Bronchial asthma, chronic obstructive pulmonary disease, and interstitial pneumonia were the most common ailments treated by area hospitals. Levels of premature death, chronic bronchitis, and cardiovascular disease are increasing at a rapid rate.[68]
Cognitive hazards and mental health
[edit]The effects of air pollution and particulate matter on cognitive performance has become an active area of research.[224]
Air pollution may increase the risk of developmental disorders (e.g., autism),[188][189][190][191] neurodegenerative disorders,[192][193] mental disorders,[194][195][196] and suicide,[194][196][225] although studies on the link between depression and some air pollutants are not consistent.[226] At least one study has identified "the abundant presence in the human brain of magnetite nanoparticles that match precisely the high-temperature magnetite nanospheres, formed by combustion and/or friction-derived heating, which are prolific in urban, airborne particulate matter (PM)."[227]
Particulates also appear to have a role in the pathogenesis of Alzheimer's disease and premature brain aging. There is increasing evidence to suggest a correlation between PM2.5 exposure and the prevalence of neurodegenerative diseases such as Alzheimer's. Several epidemiological studies have suggested a link between PM2.5 exposure and cognitive decline, particularly in the development of neurodegenerative diseases such as Alzheimer's.
Using geospatial analytical techniques, "NIEHS-funded researchers were able to confirm a strong association between cases of Parkinson's disease and fine particulate matter (known as PM2.5) across the U.S. In the study, regions of the country with a high rate of Parkinson's disease were associated generally with higher levels of PM2.5, of which sources include motor vehicles, wildfires, and power plants."[228] While the exact mechanisms behind the link between PM2.5 exposure and cognitive decline are not fully understood, research suggests that the fine particles may be able to enter the brain through the olfactory nerve and cause inflammation and oxidative stress, which can damage brain cells and contribute to the development of neurodegenerative diseases.[229]
Increased death
[edit]The World Health Organization (WHO) estimated in 2005 that "... fine particulate air pollution (PM(2.5)), causes about 3% of mortality from cardiopulmonary disease, about 5% of mortality from cancer of the trachea, bronchus, and lung, and about 1% of mortality from acute respiratory infections in children under 5 years, worldwide."[230] A 2011 study concluded that traffic exhaust is the single most serious preventable cause of heart attack in the general public, the cause of 7.4% of all attacks.[231]
Particulate matter studies in Bangkok, Thailand from 2008 indicated a 1.9% increased risk of dying from cardiovascular disease, and 1.0% risk of all disease for every 10 micrograms per cubic meter. Levels averaged 65 in 1996, 68 in 2002, and 52 in 2004. Decreasing levels may be attributed to conversions of diesel to natural gas combustion as well as improved regulations.[232]
Racial disparities
[edit]There have been many studies linking race to increased proximity to particulate matter, and thus susceptibility to adverse health effects of long term exposure. A U.S. study showed that "the proportions of Black residents in a tract was linked to higher asthma rates".[233] Many scholars link this disproportionality to racial housing segregation and their respective inequalities in "toxic exposures".[233] This reality is made worse by the finding that "health care occurs in the context of broader historic and contemporary social and economic inequality and persistent racial and ethnic discrimination in many sectors of American life".[234] Residential proximity to particulate emitting facilities increases exposure to PM 2.5 which is linked to increased morbidity and mortality rates.[235] Multiple studies confirm the burden of PM emissions is higher among non-White and poverty ridden populations,[235] though some say that income does not drive these differences.[236] This correlation between race and housing related health repercussions stems from a longstanding environmental justice problem linked to the practice of historic redlining. An example of these factors contextualized is an area of Southeastern Louisiana, colloquially dubbed 'Cancer Alley' for its high concentration of cancer related deaths due to neighboring chemical plants.[237] Cancer Alley being a majority African American community, with the neighborhood nearest to the plant being 90% Black,[237] perpetuates the scientific narrative that Black populations are located disproportionately closer to areas of high PM output than White populations. A 2020 article relates the long-term health effects of living in high PM concentrations to increased risk, spread, and mortality rates from the SARS-CoV-2 or COVID-19, and faults a history of racism for this outcome.[237]
Wildfire smoke risk
[edit]In regions where wildfires are persistent the risk of particulate exposure increased. Smoke from wildfires may impact sensitive groups such as the elderly, children, pregnant women, and people with lung, and cardiovascular disease.[238] It was found that in the 2008 wildfire season in California, the particulate matter was much more toxic to human lungs, as increased neutrophil infiltrate, cell influx and edema was observed versus particulate matter from ambient air.[239] Furthermore, particulate matter from wildfires have been linked to be a triggering factor of acute coronary events such as ischemic heart disease.[240] Wildfires also have been associated with increased emergency department visits due to particulate matter exposure, as well as an increased risk of asthma related events.[241][242] A link between PM2.5 from wildfires and increased risk of hospitalizations for cardiopulmonary diseases has been discovered.[243] Evidence also suggest wildfire smoke reduces mental performance.[244]
Energy industry knowledge and response to adverse health effects
[edit]
Major energy companies understood at least since the 1960s that use of their products causes widespread adverse health effects and death but continued aggressive political lobbying in the United States and elsewhere against clean air regulation and launched major corporate propaganda campaigns to sow doubt regarding the causative link between the burning of fossil fuels and major risks to human life. Internal company memoranda reveal that energy industry scientists and executives knew that air pollutants created by fossil fuels lodge deep in human lung tissue, and cause birth defects in children of oil industry workers. The industry memos acknowledge that automobiles "are by far the greatest sources of air pollution" and also that air pollution causes adverse health effects and lodges toxins, including carcinogens, "deep into the lungs which would otherwise be removed in the throat".[246]
In response to mounting public concern, the industry eventually created the Global Climate Coalition, an industry lobby group, to derail governments' attempts to regulate air pollution and to create confusion in the public mind about the necessity of such regulation. Similar lobbying and corporate public relations efforts were undertaken by the American Petroleum Institute, a trade association of the oil and gas industry, and the climate change denier private think tank, The Heartland Institute. "The response from fossil-fuel interests has been from the same playbook – first they know, then they scheme, then they deny and then they delay. They've fallen back on delay, subtle forms of propaganda and the undermining of regulation," said Geoffrey Supran, a Harvard University researcher of the history of fossil-fuel companies and climate change. These efforts have been compared, by policy analysts such as Carroll Muffett of the Center for International Environmental Law, to the tobacco industry strategy of lobbying and corporate propaganda campaigns to create doubt regarding the causal connection between cigarette smoking and cancer and to forestall its regulation. In addition, industry-funded advocates, when appointed to senior government positions in the United States, have revised scientific findings showing the deadly effects of air pollution and have rolled back its regulation.[246][247][248]
Effects on vegetation
[edit]This section needs expansion. You can help by adding to it. (February 2024) |
Particulate matter can clog stomatal openings of plants and interfere with photosynthesis functions.[249] In this manner, high particulate matter concentrations in the atmosphere can lead to growth stunting or mortality in some plant species.[citation needed]
Regulation
[edit]Most governments have created regulations both for the emissions allowed from certain types of pollution sources (motor vehicles, industrial emissions etc.) and for the ambient concentration of particulates. The IARC and WHO designate particulates a Group 1 carcinogen. Particulates are the deadliest form of air pollution due to their ability to penetrate deep into the lungs and blood streams unfiltered, causing respiratory diseases, heart attacks, and premature death.[250] In 2013, the ESCAPE study involving 312,944 people in nine European countries revealed that there was no safe level of particulates and that for every increase of 10 μg/m3 in PM10, the lung cancer rate rose 22%. For PM2.5 there was a 36% increase in lung cancer per 10 μg/m3.[199] In a 2014 meta-analysis of 18 studies globally including the ESCAPE data, for every increase of 10 μg/m3 in PM2.5, the lung cancer rate rose 9%.[251]
Limits / standards set by governments
[edit]| Country/ Region | PM2.5 (μg/m3) | PM10 (μg/m3) | No. of exceedances allowed per year | ||
|---|---|---|---|---|---|
| Yearly avg. | Daily avg. (24-hour) | Yearly avg. | Daily avg (24-hour) | ||
| Australia [252] | 8 | 25 | 25 | 50 | None |
| China [253] | 35 | 75 | 70 | 150 | None |
| European Union [254][a][b] | 25 | None | 40 | 50 | PM2.5: None; PM10: 35 |
| Hong Kong [255][c] | 35 | 75 | 50 | 100 | PM2.5: 9; PM10: 9 |
| Japan [256][257][d][e] | 15 | 35 | None | 100 | None |
| South Korea [258][259][f][g] | 15 | 35 | 50 | 100 | None |
| Taiwan [260][261] | 15 | 35 | 50 | 100 | None |
| United States [262] | 9[h] | 35[i] | None[j] | 150[k] | PM2.5: Not applicable;[l] PM10: 1 |
| World Health Organization [264] | 5 | 15 | 15 | 45 | 3-4 |
Canada
[edit]In Canada the standard for particulate matter is set nationally by the federal-provincial Canadian Council of Ministers of the Environment (CCME). Jurisdictions (provinces and territories) may set more stringent standards. The CCME standard for particulate matter 2.5 (PM2.5) as of 2015 is 28 μg/m3 (calculated using the 3-year average of the annual 98th percentile of the daily 24-hr average concentrations) and 10 μg/m3 (3-year average of annual mean). PM2.5 standards will increase in stringency in 2020.[265]
European Union
[edit]The European Union has established the European emission standards, which include limits for particulates in the air:[254]
| European Air Quality Index | Good | Fair | Moderate | Poor | Very poor | Extremely poor |
|---|---|---|---|---|---|---|
| Particles less than 2.5μm (PM2,5) | 0–10 μg/m3 | 10–20 μg/m3 | 20–25 μg/m3 | 25–50 μg/m3 | 50–75 μg/m3 | 75–800 μg/m3 |
| Particles less than 10μm (PM10) | 0–20 μg/m3 | 20–40 μg/m3 | 40–50 μg/m3 | 50–100 μg/m3 | 100–150 μg/m3 | 150–1200 μg/m3 |
United Kingdom
[edit]To mitigate the problem of wood burning, starting from May 2021, traditional house coal (bituminous coal) and wet wood, two of the most polluting fuels, can no longer be sold. Wood sold in volumes of less than 2m3 must be certified as 'Ready to Burn', which means it has a moisture content of 20% or less. Manufactured solid fuels must also be certified as 'Ready to Burn' to ensure they meet sulphur and smoke emission limits.[266] Starting from January 2022, all new wood burning stoves have to meet new EcoDesign standards (Ecodesign stoves produce 450 times more toxic air pollution than gas central heating. Older stoves, which are now banned from sale, produce 3,700 times more).[267]
In 2023, the amount of smoke that burners in "smoke control areas" - most England's towns and cities - can emit per hour is reduced from 5g to 3g. Violation will result in an on-the-spot fine of up to £300. Those who do not comply may even get a criminal record.[268]
United States
[edit]
The United States Environmental Protection Agency (EPA) has set standards for PM10 and PM2.5 concentrations.[262] (See National Ambient Air Quality Standards.)
California
[edit]This section needs to be updated. (September 2016) |

In October 2008, the Department of Toxic Substances Control (DTSC), within the California Environmental Protection Agency, announced its intent to request information regarding analytical test methods, fate and transport in the environment, and other relevant information from manufacturers of carbon nanotubes.[270] DTSC is exercising its authority under the California Health and Safety Code, Chapter 699, sections 57018–57020.[271] These sections were added as a result of the adoption of Assembly Bill AB 289 (2006).[271] They are intended to make information on the fate and transport, detection and analysis, and other information on chemicals more available. The law places the responsibility to provide this information to the department on those who manufacture or import the chemicals.
On 22 January 2009, a formal information request letter[272] was sent to manufacturers who produce or import carbon nanotubes in California, or who may export carbon nanotubes into the State.[273] This letter constitutes the first formal implementation of the authorities placed into statute by AB 289 and is directed to manufacturers of carbon nanotubes, both industry, and academia within the State, and to manufacturers outside California who export carbon nanotubes to California. This request for information must be met by the manufacturers within one year. DTSC is waiting for the upcoming 22 January 2010 deadline for responses to the data call-in.
The California Nano Industry Network and DTSC hosted a full-day symposium on 16 November 2009 in Sacramento, California. This symposium provided an opportunity to hear from nanotechnology industry experts and discuss future regulatory considerations in California.[274]
DTSC is expanding the Specific Chemical Information Call-in to members of the nanometal oxides, the latest information can be found on their website.[275]
Colorado
[edit]
Key points in the Colorado Plan include reducing emission levels and solutions by sector. Agriculture, transportation, green electricity, and renewable energy research are the main concepts and goals in this plan. Political programs such as mandatory vehicle emissions testing and the prohibition of smoking indoors are actions taken by local government to create public awareness and participation in cleaner air. The location of Denver next to the Rocky Mountains and wide expanse of plains makes the metro area of Colorado's capital city a likely place for smog and visible air pollution.[citation needed]
Affected areas
[edit]
To analyse the air pollution trend, 480 cities around the world (Ukraine excluded) was mapped by air experts[276] to calculate the average PM2.5 level of the first nine months of 2019 against that of 2022.[277] Average levels of PM2.5 were measured using aqicn.org's World Air Quality Index data, and a formula developed by AirNow was used to convert the PM2.5 figure into micrograms per cubic meter of air (μg/m3) values.
Among the 70 capital cities investigated, Baghdad, Iraq is the worst performing one, with PM2.5 levels going up +31.6 μg/m3. Ulan Bator (Ulaanbaatar), the capital city of Mongolia, is performing the best, with PM2.5 levels dropping by -23.4 μg/m3. Previously it was as one of the most polluted capital cities in the world. An air quality improvement plan in 2017 appears to be showing positive results.
Out of the 480 cities, Dammam in Saudi Arabia is performing the worst with PM2.5 levels going up +111.1 μg/m3. The city is a significant center for the Saudi oil industry and home to both the largest airport in the world and the largest port in the Persian Gulf. It is currently the most polluted city surveyed.
In Europe, the worst performing cities are located in Spain. They are Salamanca and Palma, with PM2.5 levels increase by +5.1 μg/m3 and +3.7 μg/m3 respectively. The best performing city is Skopje, the capital city of North Macedonia, with PM2.5 levels dropping by -12.4 μg/m3. It was once the most polluted capital city in Europe and still has a long way to go to achieve clean air.
In the U.S., Salt Lake City, Utah and Miami, Florida are the two cities with the highest PM2.5 level increases (+1.8 μg/m3). Salt Lake City suffers from a weather event known as 'inversion'. Located in a valley, cooler, polluted air is trapped close to ground level under the warmer air above when inversion occurs. On the other hand, Omaha, Nebraska is performing the best and has a decrease of -1.1 μg/m3 in PM2.5 levels.
The cleanest city in this report is Zürich, Switzerland with PM2.5 levels of just 0.5 μg/m3, placed first in both 2019 and 2022. The second cleanest city is Perth, with 1.7 μg/m3 and PM2.5 levels dropping by -6.2 μg/m3 since 2019. Of the top ten cleanest cities, five are from Australia. They are Hobart, Wollongong, Launceston, Sydney and Perth. Honolulu is the only U.S. city in the top ten list, ranking tenth with levels of 4 μg/m3, with a tiny increase since 2019.
Almost all of the top ten most polluted cities are in the Middle East and Asia. The worst is Dammam in Saudi Arabia with a PM2.5 level of 155 μg/m3. Lahore in Pakistan is the second worst with 98.1 μg/m3. The third is Dubai, home to the world's tallest building. In the bottom ten are three cities from India, Muzaffarnagar, Delhi and New Delhi. Here is a list of the 30 most polluted cities by PM2.5, Jan to Sep 2022:[276]
| City | Country / Region | 1st 9 months average PM2.5 (μg/m3) | |
|---|---|---|---|
| 2022 | 2019 | ||
| Dammam | 155 | 43.9 | |
| Lahore | 98.1 | 64.6 | |
| Dubai | 97.7 | 47.5 | |
| Baghdad | 60.5 | 29 | |
| Dhaka | 55.3 | 48.7 | |
| Muzaffarnagar | 53.9 | 60.5 | |
| Delhi | 51.6 | 59.8 | |
| Oaxaca | 51.1 | 13.5 | |
| New Delhi | 50.1 | 54.2 | |
| Manama | 48 | 43.4 | |
| Patna | 47.9 | 53.5 | |
| Peshawar | 47 | 46.7 | |
| Ghāziābād | 46.6 | 56.9 | |
| Lucknow | 46.4 | 54.1 | |
| Hawalli | 46.2 | 40.4 | |
| Hapur | 45.7 | 53.3 | |
| Chandigarh | 44.9 | 39.7 | |
| Jaipur | 43.5 | 40.6 | |
| Kampala | 42.9 | 48.3 | |
| Khorramshahr | 42 | 30 | |
| Pokhara | 41.8 | 18.2 | |
| Abu Dhabi | 40.2 | 44.7 | |
| Xi'an | 36.6 | 40 | |
| Xuchang | 36.4 | 41.4 | |
| Xinxiang | 36.3 | 46.4 | |
| Anyang | 36.1 | 45.9 | |
| Shijiazhuang | 36 | 44.9 | |
| Taiyuan | 35.9 | 39.2 | |
| East London | 35.9 | 7.1 | |
| Gandhinagar | 35.5 | 42.9 | |
There are limits to the above survey. For example, not every city in the world is covered, and that the number of monitoring stations for each city would not be the same. The data is for reference only.
Australia
[edit]PM10 pollution in coal mining areas in Australia such as the Latrobe Valley in Victoria and the Hunter Region in New South Wales significantly increased during 2004 to 2014. Although the increase did not significantly add to non-attainment statistics the rate of increase has risen each year during 2010 to 2014.[278]
China
[edit]Some cities in Northern China and South Asia have had concentrations above 200 μg/m3.[279] The PM levels in Chinese cities were extreme between 2010 - 2014, reaching an all-time high in Beijing on 12 January 2013, of 993 μg/m3,[68] but has been improving thanks to clean air actions.[280][281]
To monitor the air quality of south China, the U.S. Consulate Guangzhou set a PM2.5 and PM10 monitor on Shamian Island in Guangzhou and displays readings on its official website and social platforms.[282]
Europe
[edit]This section needs expansion. You can help by adding to it. (February 2024) |

Italy
[edit]
South Korea
[edit]As of 2017, South Korea has the worst air pollution among the developed nations in the OECD (Organization for Economic Cooperation and Development).[283] According to a study conducted by NASA and NIER, 52% of PM2.5 measured in Olympic Park, Seoul in May and June 2016 came from local emissions. The rest was trans-boundary pollution coming from China's Shandong Province (22%), North Korea (9%), Beijing (7%), [[Shanghai (5%), and a combined 5% from China's Liaoning Province, Japan and the West Sea.[284] In December 2017, the environmental ministers from South Korea and China signed the China-Korea Environmental Cooperation Plan (2018–22), a five-year plan to jointly solve issues in the air, water, soil and waste. An environmental cooperation centre was also launched in 2018 to aid cooperation.[285]
Thailand
[edit]Air quality of Thailand is getting worse in 2023, which is described as a "post-COVID back-to-normal situation". In addition to the capital Bangkok, air quality in Chiang Mai, a popular tourist destination, is also deteriorating. Chiang Mai was listed as the most polluted city in a live ranking by a Swiss air quality company on 27 March 2023. The ranking includes data from about 100 world cities for which measured PM2.5 data is available.[286][287]
Ulaanbaatar
[edit]Mongolia's capital city Ulaanbaatar has an annual average mean temperature of about 0 °C, making it the world's coldest capital city. About 40% of the population lives in apartments, 80% of which are supplied with central heating systems from three combined heat and power plants. In 2007, the power plants consumed almost 3.4 million tons of coal. The pollution control technology is in poor condition. [citation needed]
The other 60% of the population reside in shantytowns (Ger districts), which have developed due to the country's new market economy and the very cold winter seasons. The poor in these districts cook and heat their wood houses with indoor stoves fueled by wood or coal. The resulting air pollution is characterized by raised sulfur dioxide and nitrogen oxide levels and very high concentrations of airborne particles and particulate matter (PM).[68] Annual seasonal average particulate matter concentrations have been recorded as high as 279 μg/m3 (micrograms per cubic meter).[citation needed] The World Health Organization's recommended annual mean PM10 level is 20 μg/m3,[288] which means that Ulaanbaatar's PM10 annual mean levels are 14 times higher than recommended.[citation needed]
During the winter months, in particular, the air pollution obscures the air, affecting the visibility in the city to such an extent that airplanes on some occasions are prevented from landing at the airport.[289]
In addition to stack emissions, another source unaccounted for in the emission inventory is fly ash from ash ponds, the final disposal place for fly ash that has been collected in settling tanks. Ash ponds are continually eroded by wind during the winter.[290]
United States
[edit]-
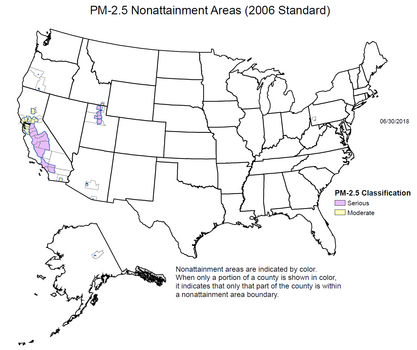 U.S. counties violating national PM2.5 standards, June 2018
 -
 U.S. counties violating national PM10 standards, June 2018


From the "State of Air 2022" report compiled by the American Lung Association using data from the U.S. Environmental Protection Agency from 2018 to 2020,[291] California cities are the most polluted cities (by PM2.5) in the U.S. while the East Coast is cleaner.
However, another study has come up with a very different conclusion. According to Forbes, a travel insurance comparison site InsureMyTrip conducted a survey of 50 U.S. cities in 2020 and ranked them by cleanliness with criteria like hand sanitizer demand, cleanliness of restaurants, quantity of recycling collectors, satisfaction of garbage disposal, electric vehicle market share and pollution.[292] On their top ten cleanest cities list, seven are from California, including Long Beach (No. 1), San Diego (No. 2), Sacramento (No. 3), San Jose (No. 6), Oakland (No. 7), Bakersfield (No. 9), and San Francisco (No. 10). The discrepancies maybe due to the differences in data choice, calculation methods, definitions of "cleanliness" and a large variation of air quality across the same state, etc. This again shows that one need to be very careful when drawing conclusions from the many air quality rankings available on the internet.
In mid-2023, air quality in eastern U.S. lowered significantly as particulates from Canada's wildfires blew down. According to NASA, some of the fires were ignited by lightning.[293][12]
See also
[edit]- Air filter
- Air quality index | Air quality law
- ASTDR
- Bioaerosol
- Carbon black
- CCN (Cloud condensation nuclei)
- Chip formation
- Cleanroom
- Contamination control
- Criteria air contaminants
- Dust
- Exposure assessment | Exposure science
- Fertilizer | Pesticides
- Fog | Pea soup fog
- Fugitive dust
- Heavy industry
- List of least polluted cities by particulate matter concentration
- List of most polluted cities by particulate matter concentration
- Metal swarf | Sawdust
- NIEHS
- Non-exhaust emissions
- Occupational dust exposure
- Respirator
- Recycling
- Scrubber
- Suspended solids
Health effects:
- Health effects of coal ash
- Health effects of pesticides
- Health impact of asbestos
- Health impacts of sawdust
Health-related:
Other names
[edit]- atmospheric aerosol particles
- particulate matter (PM)
- suspended particulate matter (SPM)
Notes
[edit]- ^ PM10 limit since 1 January 2005
- ^ PM2.5 limit since 1 January 2015
- ^ Since 1 January 2014
- ^ PM10 referred to as Suspended Particulate Matter
- ^ PM2.5 limit since 21 September 2009
- ^ PM10 limit since 4 December 2006
- ^ PM2.5 limit since 27 March 2018
- ^ annual limit since 2024
- ^ daily limit since 2007
- ^ annual limit removed in 2006
- ^ daily limit since 1987[263]
- ^ 3-year average of annual 98th percentile
References
[edit]- ^ Seinfeld J, Pandis S (1998). Atmospheric Chemistry and Physics: From Air Pollution to Climate Change (2nd ed.). Hoboken, New Jersey: John Wiley & Sons. p. 97. ISBN 978-0-471-17816-3.
- ^ Plainiotis S, Pericleous KA, Fisher BE, Shier L (January 2010). "Application of Lagrangian particle dispersion models to air quality assessment in the Trans-Manche region of Nord-Pas-de-Calais (France) and Kent (Great Britain)" (PDF). International Journal of Environment and Pollution. 40 (1/2/3): 160–74. doi:10.1504/IJEP.2010.030891.
- ^ Brown JS, Gordon T, Price O, Asgharian B (April 2013). "Thoracic and respirable particle definitions for human health risk assessment". Particle and Fibre Toxicology. 10: 12. doi:10.1186/1743-8977-10-12. PMC 3640939. PMID 23575443.
- ^ Jump up to: a b US EPA, OAR (19 April 2016). "Particulate Matter (PM) Basics". US EPA. Retrieved 5 October 2019.
- ^ "EHP – Outdoor Particulate Matter Exposure and Lung Cancer: A Systematic Review and Meta-Analysis". ehp.niehs.nih.gov. Archived from the original on 29 May 2016. Retrieved 29 December 2016.
- ^ Wasley, Andrew; Heal, Alexandra; Harvey, Fiona; Lainio, Mie (13 June 2019). "Revealed: UK government failing to tackle rise of serious air pollutant". The Guardian.
- ^ Thangavel, Prakash; Park, Duckshin; Lee, Young-Chul (19 June 2022). "Recent Insights into Particulate Matter (PM2.5)-Mediated Toxicity in Humans: An Overview". International Journal of Environmental Research and Public Health. 19 (12): 7511. doi:10.3390/ijerph19127511. ISSN 1660-4601. PMC 9223652. PMID 35742761.
- ^ "STATE OF GLOBAL AIR/2018 A SPECIAL REPORT ON GLOBAL EXPOSURE TO AIR POLLUTION AND ITS DISEASE BURDEN" (PDF). Health Effects Institute. 2018.
- ^ "The Weight of Numbers: Air Pollution and PM2.5". Undark. Retrieved 6 September 2018.
- ^ Omidvarborna; et al. (2015). "Recent studies on soot modeling for diesel combustion". Renewable and Sustainable Energy Reviews. 48: 635–647. Bibcode:2015RSERv..48..635O. doi:10.1016/j.rser.2015.04.019.
- ^ "Air quality, EASA Eco".
- ^ Jump up to: a b Lee, Giyoon; Ahn, Jinho; Park, Seung-Myung; Moon, Jonghan; Park, Rokjin; Sim, Min Sub; Choi, Hanna; Park, Jinsoo; Ahn, Joon-Young (17 September 2023). "Sulfur isotope-based source apportionment and control mechanisms of PM2.5 sulfate in Seoul, South Korea during winter and early spring (2017–2020)". Science of the Total Environment. 905. doi:10.1016/j.scitotenv.2023.167112. PMID 37717778. S2CID 262046328.
- ^ Lin C, Huang RJ, Duan J, Zhong H, Xu W, Wu Y, Zhang R (April 2022). "Large contribution from worship activities to the atmospheric soot particles in northwest China". Environ Pollut. 299: 118907. Bibcode:2022EPoll.29918907L. doi:10.1016/j.envpol.2022.118907. PMID 35091017. S2CID 246355499.
- ^ Giang, Lam Van; Thanh, Tran; Hien, Truong Thanh; Tan, Lam Van; Thi Bich Phuong, Tran; Huu Loc, Ho (2021). "Heavy metals emissions from joss paper burning rituals and the air quality around a specific incinerator". Materials Today: Proceedings. 38: 2751–2757. doi:10.1016/j.matpr.2020.08.686. S2CID 226353498.
- ^ Shen H, Tsai CM, Yuan CS, Jen YH, Ie IR (January 2017). "How incense and joss paper burning during the worship activities influences ambient mercury concentrations in indoor and outdoor environments of an Asian temple?". Chemosphere. 167: 530–540. Bibcode:2017Chmsp.167..530S. doi:10.1016/j.chemosphere.2016.09.159. PMID 27764746.
- ^ Ramadan, Bimastyaji Surya; Rosmalina, Raden Tina; Syafrudin; Munawir; Khair, Hafizhul; Rachman, Indriyani; Matsumoto, Toru (2023). "Potential Risks of Open Waste Burning at the Household Level: A Case Study of Semarang, Indonesia". Aerosol and Air Quality Research. 23 (5). Taiwan Association for Aerosol Research: 220412. doi:10.4209/aaqr.220412. ISSN 1680-8584. S2CID 257202752.
- ^ Shah R, Limaye S, Ujagare D, Madas S, Salvi S (2019). "Personal exposures to particulate matter <2.5 μm in mass median aerodynamic diameter (PM2.5) pollution during the burning of six most commonly used firecrackers in India". Lung India. 36 (4): 324–329. doi:10.4103/lungindia.lungindia_440_18. PMC 6625239. PMID 31290418.
- ^ Roy, Rajarshi; Schooff, Brian; Li, Xiaolong; Montgomery, Scott; Tuttle, Jacob; Wendt, Jost O. L.; Dickson, Kingsley; Iverson, Brian; Fry, Andrew (1 May 2023). "Ash aerosol particle size distribution, composition, and deposition behavior while co-firing coal and steam-exploded biomass in a 1.5 MWth combustor". Fuel Processing Technology. 243: 107674. doi:10.1016/j.fuproc.2023.107674. S2CID 256529257.
- ^ Azarmi, Farhad; Kumar, Prashant (2016). "Ambient exposure to coarse and fine particle emissions from building demolition". Atmospheric Environment. 137: 62–79. Bibcode:2016AtmEn.137...62A. doi:10.1016/j.atmosenv.2016.04.029.
- ^ "Emissions of air pollutants in the UK – Particulate matter (PM10 and PM2.5)".
- ^ "Building works responsible for 18% of UK large particle pollution".
- ^ "Delhi's deadly dust: how construction sites are choking the city".
- ^ "Particulate matter emissions from activities of building refurbishment".
- ^ "一家三口中鉛毒 疑含鉛船用油漆髹浴室門所致 衛生署提家中裝修注意事項 (14:05)". 明報新聞網 - 即時新聞 instant news (in Traditional Chinese). June 2024.
- ^ "SF Concrete Plant That Was Focus of NBC Bay Area Investigative Report, Ordered to Shut Down". 11 March 2022.
- ^ Scoop, pollution at Yau Tong Cement batching plant. HK: TVB.
- ^ Orirental Daily News once again revealed that the Yau Tong Concrete Plant violated regulations and emitted a large amount of smoke and dust, up to 40 meters. HK: Oriental Daily News.
- ^ Kholodov A, Zakharenko A, Drozd V, Chernyshev V, Kirichenko K, Seryodkin I, Karabtsov A, Olesik S, Khvost E, Vakhnyuk I, Chaika V, Stratidakis A, Vinceti M, Sarigiannis D, Hayes AW, Tsatsakis A, Golokhvast K (February 2020). "Identification of cement in atmospheric particulate matter using the hybrid method of laser diffraction analysis and Raman spectroscopy". Heliyon. 6 (2): e03299. Bibcode:2020Heliy...603299K. doi:10.1016/j.heliyon.2020.e03299. PMC 7042420. PMID 32128461.
- ^ "Cut down construction dust" (PDF).
- ^ "Proper Covering of Dusty Material on Dump Trucks". www.epd.gov.hk.
- ^ "Dusty Material - an overview | ScienceDirect Topics". www.sciencedirect.com.
- ^ Kim JY, Chen JC, Boyce PD, Christiani DC (March 2005). "Exposure to welding fumes is associated with acute systemic inflammatory responses". Occup Environ Med. 62 (3): 157–63. doi:10.1136/oem.2004.014795. PMC 1740976. PMID 15723880.
- ^ Bruschweiler ED, Danuser B, Huynh CK, Wild P, Schupfer P, Vernez D, Boiteux P, Hopf NB (2012). "Generation of polycyclic aromatic hydrocarbons (PAHs) during woodworking operations". Front Oncol. 2: 148. doi:10.3389/fonc.2012.00148. PMC 3475003. PMID 23087908.
- ^ "Woodworking health topics - Inhaling wood dust".
- ^ Patel, Sameer; Sankhyan, Sumit; Boedicker, Erin K.; DeCarlo, Peter F.; Farmer, Delphine K.; Goldstein, Allen H.; Katz, Erin F.; Nazaroff, William W; Tian, Yilin; Vanhanen, Joonas; Vance, Marina E. (16 June 2020). "Indoor Particulate Matter during HOMEChem: Concentrations, Size Distributions, and Exposures". Environmental Science & Technology. 54 (12): 7107–7116. Bibcode:2020EnST...54.7107P. doi:10.1021/acs.est.0c00740. ISSN 0013-936X. PMID 32391692. Archived from the original on 28 April 2023. Retrieved 11 April 2024.
- ^ "Dust advice for businesses - EPA Victoria".
- ^ Henneman L, Choirat C, Dedoussi I, Dominici F, Roberts J, Zigler C (November 2023). "Mortality risk from United States coal electricity generation". Science. 382 (6673): 941–946. Bibcode:2023Sci...382..941H. doi:10.1126/science.adf4915. PMC 10870829. PMID 37995235.
- ^ Lin Y, Zou J, Yang W, Li CQ (March 2018). "A Review of Recent Advances in Research on PM2.5in China". Int J Environ Res Public Health. 15 (3): 438. doi:10.3390/ijerph15030438. PMC 5876983. PMID 29498704.
- ^ Sharma R, Sharma M, Sharma R, Sharma V (2013). "The impact of incinerators on human health and environment". Rev Environ Health. 28 (1): 67–72. doi:10.1515/reveh-2012-0035. PMID 23612530. S2CID 21271240.
- ^ Non-exhaust Particulate Emissions from Road Transport. OECD. 2020. doi:10.1787/4a4dc6ca-en. ISBN 978-92-64-88885-2. S2CID 136987659.
- ^ Khan RK, Strand MA (2018). "Road dust and its effect on human health: a literature review". Epidemiol Health. 40: e2018013. doi:10.4178/epih.e2018013. PMC 5968206. PMID 29642653.
- ^ Fan, Long; Liu, Shimin (2021). "Respirable nano-particulate generations and their pathogenesis in mining workplaces: a review". International Journal of Coal Science & Technology. 8 (2): 179–198. doi:10.1007/s40789-021-00412-w. S2CID 233890096.
- ^ Petavratzi, E.; Kingman, S.; Lowndes, I. (2005). "Particulates from mining operations: A review of sources, effects and regulations". Minerals Engineering. 18 (12): 1183–1199. Bibcode:2005MiEng..18.1183P. doi:10.1016/j.mineng.2005.06.017.
- ^ Jeong H, Choi JY, Ra K (March 2021). "Potentially toxic elements pollution in road deposited sediments around the active smelting industry of Korea". Sci Rep. 11 (1): 7238. doi:10.1038/s41598-021-86698-x. PMC 8012626. PMID 33790361.
- ^ McLaughlin, Tim (6 January 2022). "Harmful soot unchecked as Big Oil battles EPA over testing". Reuters.
- ^ Chandrappa, R.; Chandra Kulshrestha, U. (2016). "Air Pollution and Disasters". Sustainable Air Pollution Management. Environmental Science and Engineering. pp. 325–343. doi:10.1007/978-3-319-21596-9_8. ISBN 978-3-319-21595-2. PMC 7121041.
- ^ "Sand, Dust and Particulates Public Health".
- ^ Zalakeviciute, Rasa; Mejia, Danilo; Alvarez, Hermel; Bermeo, Xavier; Bonilla-Bedoya, Santiago; Rybarczyk, Yves; Lamb, Brian (2022). "WarImpact on Air Quality in Ukraine". Sustainability. 14 (21): 13832. doi:10.3390/su142113832.
- ^ Xie Y, Li Y, Feng Y, Cheng W, Wang Y (April 2022). "Inhalable microplastics prevails in air: Exploring the size detection limit". Environ Int. 162: 107151. Bibcode:2022EnInt.16207151X. doi:10.1016/j.envint.2022.107151. PMID 35228011.
- ^ Liu C, Li J, Zhang Y, Wang L, Deng J, Gao Y, Yu L, Zhang J, Sun H (July 2019). "Widespread distribution of PET and PC microplastics in dust in urban China and their estimated human exposure". Environ Int. 128: 116–124. Bibcode:2019EnInt.128..116L. doi:10.1016/j.envint.2019.04.024. PMID 31039519.
- ^ Jump up to: a b Hardin M, Kahn R (2 November 2010). "Aerosols and Climate Change".
- ^ "Emissions of air pollutants". 22 February 2023.
- ^ Hawkes N (May 2015). "Air pollution in UK: the public health problem that won't go away". BMJ. 350: h2757. doi:10.1136/bmj.h2757. PMID 26001592. S2CID 40717317.
- ^ Carrington, Damian (16 February 2021). "Wood burning at home now biggest cause of UK particle pollution". The Guardian. Retrieved 13 February 2022.
- ^ "Wood burning heaters and your health - Fact sheets".
- ^ "How to choose and maintain a wood heater - EPA Victoria".
- ^ "How to choose the right wood for your wood heater - EPA Victoria".
- ^ "How to light and maintain your wood heater fire - EPA Victoria".
- ^ "Smoke and the law - EPA Victoria".
- ^ "Simulating the Transport of Aerosols with GEOS-5, GMAO".
- ^ "GMAO - Global Modeling and Assimilation Office Research Site". gmao.gsfc.nasa.gov.
- ^ "Primary and Secondary Sources of Aerosols: Soil dust". Climate Change 2001: Working Group 1. UNEP. 2001. Archived from the original on 28 February 2008. Retrieved 6 February 2008.
- ^ Перро В., Брунс Э.А., Эзелл М.Дж., Джонсон С.Н., Ю.Ю., Александр М.Л. и др. (февраль 2012 г.). «Неравновесное образование и рост вторичных органических аэрозолей в атмосфере» . Труды Национальной академии наук Соединенных Штатов Америки . 109 (8): 2836–41. Бибкод : 2012PNAS..109.2836P . дои : 10.1073/pnas.1119909109 . ПМК 3286997 . ПМИД 22308444 .
- ^ «Первичные и вторичные источники аэрозолей: морская соль» . Изменение климата 2001: Рабочая группа 1 . ЮНЕП. 2001. Архивировано из оригинала 28 февраля 2008 года . Проверено 6 февраля 2008 г.
- ^ Шиффер, Дж. М.; Мэйл, Ле; Пратер, К.А.; Амаро, РЕ; Грассиан, В.Х. (2018). «Морской аэрозоль: где морская биология встречается с химией атмосферы» . Центральная научная служба ACS . 4 (12): 1617–1623. дои : 10.1021/accentsci.8b00674 . ПМК 6311946 . ПМИД 30648145 .
- ^ «Первичные и вторичные источники аэрозолей: первичные биогенные аэрозоли» . Изменение климата 2001: Рабочая группа 1 . ЮНЕП. 2001. Архивировано из оригинала 28 февраля 2008 года . Проверено 6 февраля 2008 г.
- ^ Бэрринджер, Фелисити (18 февраля 2012 г.). «Ученые обнаруживают новые опасности в крошечных, но широко распространенных частицах загрязнения воздуха» . Нью-Йорк Таймс . Проверено 19 февраля 2012 г.
- ^ Перейти обратно: а б с д «Монголия: Загрязнение воздуха в Улан-Баторе – первоначальная оценка текущей ситуации и последствий мер по снижению выбросов» (PDF) . Всемирный банк. 2010. Архивировано из оригинала (PDF) 19 сентября 2016 года.
- ^ Перейти обратно: а б «Размер аэрозоля, Земная обсерватория» . НАСА. 31 августа 2016 г.
 В данную статью включен текст из этого источника, находящегося в свободном доступе .
- ^ «Американский аэрозоль в Париже» . 15 сентября 2017 г.
- ^ Госвами А., Барман Дж., Раджпут К., Лахлани Х.Н. (2013). «Исследование поведения твердых частиц и химического состава при различных стратегиях горения» . Серия технических документов SAE . Том. 1. дои : 10.4271/2013-01-2741 . Проверено 17 июня 2016 г.
- ^ «Влияние твердых частиц на климат, экосистему и здоровье растений» (PDF) . www.ijates.com. Апрель 2014 года . Проверено 3 февраля 2016 г.
- ^ «Что такое фильтры PM 2,5 и почему они эффективны?» . Маски Пурака .
- ^ Чен, Дж.; Цзян, ЗА; Чен, Дж. (2018). «Влияние объемного расхода входящего воздуха на производительность двухступенчатого циклонного сепаратора» . АСУ Омега . 3 (10): 13219–13226. дои : 10.1021/acsomega.8b02043 . ПМК 6644756 . ПМИД 31458040 .
- ^ Доминик ДальСанто (февраль 2011 г.). «Энциклопедия пылеулавливания» .
- ^ «Комплексная программа помощи в восстановлении зданий» .
- ^ «Операция Строение Яркое 2.0» .
- ^ «DEVB - Пресс-релизы: запуск операции Building Bright (с фотографиями, 2009 г.)» .
- ^ «Наблюдательная служба Гонконга арестовала 49 подозреваемых в мошенничестве с ремонтом жилья, связанном с контрактами на сумму 500 миллионов гонконгских долларов» . 6 января 2023 г.
- ^ Вы выедете, потому что идет ремонт наружных стен здания?» [Вы выедете, потому что идет ремонт наружных стен здания ] (на китайском языке). «
- ^ Трудно ли жить в реабилитируемом здании?» [Проблема покупки дома: Трудно ли жить в реабилитируемом здании?] (на китайском языке). « Проблема покупки дома:
- ^ «Операция Building Bright улучшает условия жизни жителей (с фото/видео)» .
- ^ Перейти обратно: а б «Электронное законодательство Гонконга, РЕГЛАМЕНТ КОНТРОЛЯ ЗАГРЯЗНЕНИЯ ВОЗДУХА (СТРОИТЕЛЬНОЙ ПЫЛЬЮ) (глава 311, раздел 43) от 16 июня 1997 г., LN 304 от 1997 г.» .
- ^ «Мониторинг методом контроля — мокрый скруббер для твердых частиц» . 25 мая 2016 г.
- ^ «Мониторинг методами контроля – электрофильтры» . 24 мая 2016 г.
- ^ «Правоохранительная деятельность и статистика в соответствии с Постановлением о контроле за загрязнением воздуха и Постановлением о защите озонового слоя 2021 года» .
- ^ «Строительный подрядчик оштрафован за проведение работ по сносу зданий в Шек О без соответствующих мер по борьбе с пылью» .
- ^ «Проблемы загрязнения и практические решения» .
- ^ «Правительство Дели наложит штрафы за нарушение антипылевых норм» . 6 октября 2022 г.
- ^ «Правила управления объектами строительства объектов контроля загрязнения атмосферного воздуха» .
- ^ «Пересмотренный GRAP для борьбы со сценарием неблагоприятного качества воздуха» .
- ^ «Достижения в области контроля загрязнения окружающей среды на объектах строительной деятельности, 2004 год» .
- ^ «Краткое содержание твердых частиц в Соединенном Королевстве» (PDF) . Экспертная группа по качеству воздуха . Дефра. 2005 . Проверено 28 июня 2023 г.
- ^ «Счетчики частиц конденсата» . Центр атмосферных наук . Университет Манчестера . Проверено 5 июля 2023 г.
- ^ Департамент окружающей среды, продовольствия и сельского хозяйства (Defra) webmaster@defra gsi gov uk. «Сеть по количеству и концентрации частиц – Defra, Великобритания» . uk-air.defra.gov.uk .
- ^ Гилфрич, Дж; Беркхальтер, П; Биркс, Л. (1973). «Рентгеновская спектрометрия загрязнения воздуха твердыми частицами — количественное сравнение методов» . Анальная химия . 45 (12): 2002–9. дои : 10.1021/ac60334a033 . ПМИД 4762375 .
- ^ Форстер, Пирс М.; Смит, Кристофер Дж.; Уолш, Тристрам; Лэмб, Уильям Ф.; и др. (2023). «Индикаторы глобального изменения климата 2022: ежегодное обновление крупномасштабных индикаторов состояния климатической системы и влияния человека» (PDF) . Данные науки о системе Земли . 15 (6). Программа «Коперник»: 2295–2327. Бибкод : 2023ESSD...15.2295F . дои : 10.5194/essd-15-2295-2023 . Рис. 2(а).
- ^ Перейти обратно: а б Хейвуд, Джеймс; Буше, Оливье (ноябрь 2000 г.). «Оценки прямого и косвенного радиационного воздействия тропосферных аэрозолей: обзор». Обзоры геофизики . 38 (4): 513–543. Бибкод : 2000RvGeo..38..513H . дои : 10.1029/1999RG000078 . S2CID 129107853 .
- ^ Перейти обратно: а б Туми С. (1977). «Влияние загрязнения на коротковолновое альбедо облаков» . Журнал атмосферных наук . 34 (7): 1149–1152. Бибкод : 1977JAtS...34.1149T . doi : 10.1175/1520-0469(1977)034<1149:TIOPOT>2.0.CO;2 .
- ^ Перейти обратно: а б с д и ж Форстер П., Рамасвами В., Артаксо П., Бернтсен Т., Беттс Р., Фэйи Д.В., Хейвуд Дж. и др. (октябрь 2007 г.). «Вклад Рабочей группы I в Четвертый оценочный отчет Межправительственной группы экспертов по изменению климата в 2007 году: Физическая научная основа» . Соломон С., Цинь Д., Мэннинг М., Чен З., Маркиз М., Аверит К.Б., Тиньор М., Миллер Х.Л. (ред.). Изменения в составе атмосферы и радиационном воздействии . Кембридж, Великобритания и Нью-Йорк, штат Нью-Йорк, США: Издательство Кембриджского университета. стр. 129–234.
- ^ «6.7.8 Обсуждение неопределенностей» . Третий оценочный доклад МГЭИК – Изменение климата, 2001 г. Архивировано из оригинала 28 февраля 2002 года . Проверено 14 июля 2012 г.
- ^ Чарльсон Р.Дж., Шварц С.Е., Хейлз Дж.М., Сесс Р.Д., Коакли Дж.А., Хансен Дж.Э., Хофманн DJ (январь 1992 г.). «Воздействие на климат антропогенных аэрозолей». Наука . 255 (5043): 423–30. Бибкод : 1992Sci...255..423C . дои : 10.1126/science.255.5043.423 . ПМИД 17842894 . S2CID 26740611 .
- ^ Акерман А.С., Тун О.Б., Тейлор Дж.П., Джонсон Д.В., Хоббс П.В., Ферек Р.Дж. (2000). «Влияние аэрозолей на альбедо облаков: оценка параметризации Туми восприимчивости к облакам с использованием измерений следов кораблей» . Журнал атмосферных наук . 57 (16): 2684–2695. Бибкод : 2000JAtS...57.2684A . doi : 10.1175/1520-0469(2000)057<2684:EOAOCA>2.0.CO;2 .
- ^ Кауфман Ю.Дж., Фрейзер Р.С. (1997). «Влияние частиц дыма на облака и воздействие на климат» . Наука . 277 (5332): 1636–1639. дои : 10.1126/science.277.5332.1636 .
- ^ Ферек Р.Дж., Гаррет Т., Хоббс П.В., Стрейдер С., Джонсон Д., Тейлор Дж.П., Нильсен К., Акерман А.С., Коган Ю., Лю К., Альбрехт Б.А. и др. (2000). «Подавление моросящего дождя на следах судов». Журнал атмосферных наук . 57 (16): 2707–2728. Бибкод : 2000JAtS...57.2707F . doi : 10.1175/1520-0469(2000)057<2707:DSIST>2.0.CO;2 . hdl : 10945/46780 . S2CID 40273867 .
- ^ Розенфельд Д. (1999). «TRMM обнаружила первые прямые свидетельства того, что дым от лесных пожаров препятствует выпадению осадков» . Письма о геофизических исследованиях . 26 (20): 3105–3108. Бибкод : 1999GeoRL..26.3105R . дои : 10.1029/1999GL006066 .
- ^ Перейти обратно: а б Хансен Дж., Сато М., Руди Р. (1997). «Радиационное воздействие и реагирование на климат» . Журнал геофизических исследований . 102 (Д6): 6831–6864. Бибкод : 1997JGR...102.6831H . дои : 10.1029/96JD03436 .
- ^ Акерман А.С., Тун О.Б., Стивенс Д.Е., Хеймсфилд А.Дж., Раманатан В., Велтон Э.Дж. (май 2000 г.). «Уменьшение тропической облачности сажей» . Наука . 288 (5468): 1042–7. Бибкод : 2000Sci...288.1042A . дои : 10.1126/science.288.5468.1042 . ПМИД 10807573 .
- ^ Корен И., Кауфман Ю.Дж., Ремер Л.А., Мартинс Й.В. (февраль 2004 г.). «Измерение влияния дыма Амазонки на подавление образования облаков». Наука . 303 (5662): 1342–5. Бибкод : 2004Sci...303.1342K . дои : 10.1126/science.1089424 . ПМИД 14988557 . S2CID 37347993 .
- ^ Рива, Матье; Чен, Южи; Чжан, Юэ; Лей, Цзыин; Олсон, Николь Э.; Бойер, Халли К.; Нараян, Света; Да, Линдси Д.; Грин, Хилари С.; Цуй, Тяньцюй; Чжан, Женфа; Бауманн, Карстен; Форт, Майк; Эдгертон, Эрик; Будисулисторини, Шри Х. (6 августа 2019 г.). «Увеличение соотношения изопрена, эпоксидиола и неорганического сульфата в аэрозоле приводит к обширному превращению неорганического сульфата в сероорганические формы: влияние на физико-химические свойства аэрозоля» . Экологические науки и технологии . 53 (15): 8682–8694. Бибкод : 2019EnST...53.8682R . дои : 10.1021/acs.est.9b01019 . ISSN 0013-936X . ПМК 6823602 . ПМИД 31335134 .
- ^ Сейнфельд, Джон Х.; Пандис, Спирос Н. (1998). Химия и физика атмосферы — от загрязнения воздуха до изменения климата. Джон Уайли и сыновья, Inc. ISBN 978-0-471-17816-3
- ^ Перейти обратно: а б Легра, Бернар; Дюшан, Клер; Селлитто, Паскуале; Подглаен, Орельен; Карбони, Элиза; Сидданс, Ричард; Отлично, Йенс-Уве; Хайкин, Сергей; Плогер, Феликс (23 ноября 2022 г.). «Эволюция и динамика шлейфа Хунга Тонга в стратосфере» . Химия и физика атмосферы . 22 (22): 14957–14970. дои : 10.5194/acp-22-14957-2022 . S2CID 253875202 .
- ^ Чарльсон, Роберт Дж.; Вигли, Том М.Л. (1994). «Сульфатный аэрозоль и изменение климата» . Научный американец . 270 (2): 48–57. Бибкод : 1994SciAm.270b..48C . doi : 10.1038/scientificamerican0294-48 . ISSN 0036-8733 . JSTOR 24942590 .
- ^ Аллен, Боб (6 апреля 2015 г.). «Атмосферные аэрозоли: что это такое и почему они так важны?» . НАСА . Проверено 17 апреля 2023 г.
- ^ МГЭИК, 1990: Глава 1: Парниковые газы и аэрозоли [RT Watson, H. Rodhe, H. Oeschger и U. Siegenthaler]. В: Изменение климата: научная оценка МГЭИК [Дж.Тоутон, Г.Дж.Дженкинс и Дж.Дж.Эфраумс (ред.)]. Издательство Кембриджского университета, Кембридж, Великобритания и Нью-Йорк, штат Нью-Йорк, США, стр. 31–34,
- ^ Перейти обратно: а б с Последствия кислотных дождей – здоровье человека. Архивировано 18 января 2008 г. в Wayback Machine . Epa.gov (2 июня 2006 г.). Проверено 9 февраля 2013 г.
- ^ «Влияние кислотных дождей – поверхностные воды и водные животные» . Агентство по охране окружающей среды США . Архивировано из оригинала 14 мая 2009 года.
- ^ Лайкенс, GE; Дрисколл, Коннектикут; Бусо, округ Колумбия (1996). «Долгосрочные последствия кислотных дождей: реакция и восстановление лесной экосистемы» (PDF) . Наука . 272 (5259): 244. Бибкод : 1996Sci...272..244L . дои : 10.1126/science.272.5259.244 . S2CID 178546205 . Архивировано (PDF) из оригинала 24 декабря 2012 года . Проверено 9 февраля 2013 г.
- ^ Ван, X.; Дин, Х.; Райан, Л.; Сюй, X. (1 мая 1997 г.). «Связь между загрязнением воздуха и низким весом при рождении: исследование на уровне сообщества» . Перспективы гигиены окружающей среды . 105 (5): 514–20. дои : 10.1289/ehp.97105514 . ISSN 0091-6765 . ПМЦ 1469882 . ПМИД 9222137 . S2CID 2707126 .
- ^ Галстук, X.; и др. (2003). «Влияние сульфатного аэрозоля на баланс NOx и озона в тропосфере: модельное моделирование и данные TOPSE» . Дж. Геофиз. Рез . 108 (D4): 8364. Бибкод : 2003JGRD..108.8364T . дои : 10.1029/2001JD001508 .
- ↑ Закон о чистом воздухе сокращает кислотные дожди на востоке США. Архивировано 8 августа 2018 г., в Wayback Machine , ScienceDaily , 28 сентября 1998 г.
- ^ «Тенденции выбросов в атмосферу – продолжающийся прогресс до 2005 года» . Агентство по охране окружающей среды США . 8 июля 2014 года. Архивировано из оригинала 17 марта 2007 года . Проверено 17 марта 2007 г.
- ^ Моисей, Элизабет; Карденас, Беатрис; Седдон, Джессика (25 февраля 2020 г.). «Самый успешный договор о загрязнении воздуха, о котором вы никогда не слышали» .
- ^ Стэнхилл, Г.; С. Коэн (2001). «Глобальное затемнение: обзор доказательств широкомасштабного и значительного снижения глобальной радиации с обсуждением его вероятных причин и возможных последствий для сельского хозяйства». Сельскохозяйственная и лесная метеорология . 107 (4): 255–278. Бибкод : 2001AgFM..107..255S . дои : 10.1016/S0168-1923(00)00241-0 .
- ^ Коэн, Шабтай; Стэнхилл, Джеральд (1 января 2021 г.), Летчер, Тревор М. (ред.), «Глава 32 - Изменения солнечного излучения: роль широко распространенных тенденций приземного солнечного излучения в изменении климата: затемнение и прояснение» , Изменение климата (Третий Edition) , Elsevier, стр. 687–709, doi : 10.1016/b978-0-12-821575-3.00032-3 , ISBN 978-0-12-821575-3 , S2CID 234180702 , получено 26 апреля 2023 г.
- ^ «Вероятно, количество солнцезащитных кремов в мире уменьшилось, сообщают ученые НАСА» . НАСА . 15 марта 2007 г. Архивировано из оригинала 22 декабря 2018 г. . Проверено 28 июня 2023 г.
- ^ «Сегодня яркое солнце? Это из-за атмосферы» . Хранитель . 2017. Архивировано из оригинала 20 мая 2017 года . Проверено 19 мая 2017 г.
- ^ Сеневиратне, СИ; Чжан, X.; Аднан, М.; Бади, В.; Деречинский, К.; Ди Лука, А.; Гош, С.; Искандар, И.; Коссин Дж.; Льюис, С.; Отто, Ф.; Пинто, И.; Сато, М.; Висенте-Серрано, СМ; Венер, М.; Чжоу, Б. (2021). Массон-Дельмотт, В.; Чжай, П.; Пиран, А.; Коннорс, СЛ; Пеан, К.; Бергер, С.; Кауд, Н.; Чен, Ю.; Гольдфарб, Л. (ред.). «Экстремальные погодные и климатические явления в условиях меняющегося климата» (PDF) . Изменение климата 2021: Физическая научная основа. Вклад Рабочей группы I в шестой оценочный доклад Межправительственной группы экспертов по изменению климата . 2021 : 1238. Бибкод : 2021АГУФМ.У13Б..05К . дои : 10.1017/9781009157896.007 .
- ^ Джиллетт, Натан П.; Кирхмайер-Янг, Меган; Риб, Орельен; Сиогама, Хидео; Хегерль, Габриэле К.; Кнутти, Рето; Гастино, Гийом; Джон, Жасмин Г.; Ли, Лицзюань; Назаренко Лариса; Розенблум, Нэн; Селанд, Эйвинд; Ву, Тунвэнь; Юкимото, Сейджи; Зин, Тило (18 января 2021 г.). «Ограничение вклада человека в наблюдаемое потепление с доиндустриального периода» (PDF) . Природа Изменение климата . 11 (3): 207–212. Бибкод : 2021NatCC..11..207G . дои : 10.1038/s41558-020-00965-9 . S2CID 231670652 .
- ^ МГЭИК, 2021: Резюме для политиков . В: Изменение климата 2021: Физическая научная основа. Вклад Рабочей группы I в шестой оценочный доклад Межправительственной группы экспертов по изменению климата [Массон-Дельмотт, В., П. Чжай, А. Пирани, С.Л. Коннорс, К. Пеан, С. Бергер, Н. Код, Ю. Чен, Л. Гольдфарб, М. И. Гомис, М. Хуанг, К. Лейтцелл, Э. Лонной, Дж. Б. Р. Мэтьюз, Т. К. Мэйкок, Т. Уотерфилд, О. Елекчи, Р. Ю и Б. Чжоу (ред.)]. Издательство Кембриджского университета, Кембридж, Великобритания и Нью-Йорк, штат Нью-Йорк, США, стр. 3–32, дои : 10.1017/9781009157896.001 .
- ^ Эндрю, Тавана (27 сентября 2019 г.). «За прогнозом: как облака влияют на температуру» . Наука, лежащая в основе прогноза . ЛУИСВИЛЛ, Кентукки (ВОЛНА) . Проверено 4 января 2023 г.
- ^ Маккой, Дэниел Т.; Филд, Пол; Гордон, Хэмиш; Эльзессер, Грегори С.; Гросвенор, Дэниел П. (6 апреля 2020 г.). «Распутывание причинно-следственной связи в корректировке аэрозольных облаков в средних широтах» . Химия и физика атмосферы . 20 (7): 4085–4103. Бибкод : 2020ACP....20.4085M . дои : 10.5194/acp-20-4085-2020 .
- ^ Розенфельд, Дэниел; Чжу, Яннянь; Ван, Минхуай; Чжэн, Ютун; Горен, Том; Ю, Шаокай (2019). «Концентрации капель, вызванные аэрозолями, преобладают над поверхностью и водой океанических облаков низкого уровня» (PDF) . Наука . 363 (6427): eaav0566. дои : 10.1126/science.aav0566 . ПМИД 30655446 . S2CID 58612273 .
- ^ Глассмайер, Франциска; Хоффманн, Фабиан; Джонсон, Джилл С.; Ямагучи, Таканобу; Карслоу, Кен С.; Файнголд, Грэм (29 января 2021 г.). «Охлаждение аэрозольно-облачного климата завышено по данным судовых путей» . Наука . 371 (6528): 485–489. Бибкод : 2021Sci...371..485G . дои : 10.1126/science.abd3980 . ПМИД 33510021 .
- ^ Мансхаузен, Питер; Уотсон-Пэррис, Дункан; Кристенсен, Мэтью В.; Ялканен, Юкка-Пекка; Стир, Филип Стир (7 марта 2018 г.). «Невидимые следы кораблей показывают большую чувствительность облаков к аэрозолям» . Природа . 610 (7930): 101–106. дои : 10.1038/s41586-022-05122-0 . ПМЦ 9534750 . ПМИД 36198778 .
- ^ Джонгеблуд, Украина; Шауэр, AJ; Коул-Дай, Дж.; Ларрик, CG; Вуд, Р.; Фишер, Т.П.; Карн, ЮАР; Салими, С.; Эдуард, СР; Чжай, С.; Гэн, Л.; Александр Б. (2 января 2023 г.). «Недооценка пассивной дегазации вулканической серы подразумевает завышенную оценку антропогенного аэрозольного воздействия» . Письма о геофизических исследованиях . 50 (1): e2022GL102061. Бибкод : 2023GeoRL..5002061J . дои : 10.1029/2022GL102061 . S2CID 255571342 .
- ^ Вижени, Даниэле; Слесарев, Эрик; МакМартин, Дуглас Дж; Маховальд, Натали М; Гудейл, Кристин Л ; Ся, Лили (1 сентября 2020 г.). «То, что растет, должно упасть: последствия отложений в сценарии сульфатной геоинженерии» . Письма об экологических исследованиях . 15 (9): 094063. Бибкод : 2020ERL....15i4063V . дои : 10.1088/1748-9326/ab94eb . ISSN 1748-9326 .
- ^ Эндрю Чарльтон-Перес и Элеонора Хайвуд. «Затраты и выгоды геоинженерии в стратосфере» (PDF) . Архивировано из оригинала (PDF) 14 января 2017 года . Проверено 17 февраля 2009 г.
- ^ Трисос, Кристофер Х.; Геден, Оливер; Сеневиратне, Соня И.; Сугияма, Масахиро; ван Алст, Маартен; Бала, Говиндасами; Мах, Кэтрин Дж.; Гинзбург, Вероника; де Конинк, Хелен; Патт, Энтони (2021). «Блок межрабочей группы SRM: Модификация солнечного излучения» (PDF) . Изменение климата 2021: Физическая научная основа. Вклад Рабочей группы I в шестой оценочный доклад Межправительственной группы экспертов по изменению климата . 2021 : 1238. Бибкод : 2021АГУФМ.У13Б..05К . дои : 10.1017/9781009157896.007 .
- ^ Бонд, TC (2013). «Ограничивающая роль черного углерода в климатической системе: научная оценка» . Журнал геофизических исследований: Атмосфера . 118 (11): 5380–5552. Бибкод : 2013JGRD..118.5380B . дои : 10.1002/jgrd.50171 .
- ^ «Извержение 1600 года вызвало глобальные разрушения». Архивировано 15 февраля 2011 года в Wayback Machine , Geology Times , 25 апреля 2008 года, по состоянию на 13 ноября 2010 года.
- ↑ Андреа Томпсон, «Вулкан 1600 года вызвал глобальные потрясения» , NBC News, 5 мая 2008 г., по состоянию на 13 ноября 2010 г.
- ^ «Извержение Уайнапутины в Перу в 1600 году вызвало глобальные потрясения». Архивировано 28 апреля 2010 года в Wayback Machine , Science Centric.
- ^ Маккормик, М. Патрик; Томасон, Ларри В.; Трепте, Чарльз Р. (февраль 1995 г.). «Атмосферные последствия извержения горы Пинатубо». Природа . 373 (6513): 399–404. Бибкод : 1995Natur.373..399M . дои : 10.1038/373399a0 . S2CID 46437912 .
- ^ Стоу Л.Л., Кэри Р.М., Пеллегрино П.П. (1992). «Мониторинг аэрозольного слоя горы Пинатубо с помощью данных NOAA/11 AVHRR» . Письма о геофизических исследованиях (представлена рукопись). 19 (2): 159–162. Бибкод : 1992GeoRL..19..159S . дои : 10.1029/91GL02958 .
- ^ Перкинс, Сид (4 марта 2013 г.). «Земля не такая горячая благодаря вулканам» . Наука . doi : 10.1126/article.26322 (неактивен 31 января 2024 г.).
{{cite journal}}: CS1 maint: DOI неактивен по состоянию на январь 2024 г. ( ссылка ) - ^ Нили III Р.Р., Тун О.Б., Соломон С., Вернье Дж.П., Альварес С., Инглиш Дж.М., Розенлоф К.Х., Миллс М.Дж., Бардин К.Г., Дэниел Дж.С., Тайер Дж.П. (2013). «Недавнее антропогенное увеличение содержания SO2 в Азии оказало минимальное влияние на стратосферный аэрозоль». Письма о геофизических исследованиях . 40 (5): 999–1004. Бибкод : 2013GeoRL..40..999N . дои : 10.1002/grl.50263 . hdl : 1721.1/85851 . S2CID 54922537 .
умеренные извержения вулканов, а не антропогенные воздействия, являются основным источником наблюдаемого увеличения количества стратосферных аэрозолей.
- ^ Перейти обратно: а б Чунг CE, Раманатан V (2006). «Ослабление градиентов ТПО в Северной Индии и муссонные осадки в Индии и Сахеле». Журнал климата . 19 (10): 2036–2045. Бибкод : 2006JCli...19.2036C . дои : 10.1175/JCLI3820.1 . S2CID 10435613 .
- ^ «Загрязнители и их влияние на водный и радиационный бюджеты» . Архивировано из оригинала 16 декабря 2008 года.
- ^ «Австралийские осадки и азиатские аэрозоли» (PDF) . Архивировано из оригинала (PDF) 16 июня 2012 года.
- ^ Регион 4: Лабораторные и полевые операции – PM 2,5 (2008 г.). PM 2.5 Цели и история. Агентство по охране окружающей среды США.
- ^ Бальмес, Джон Р.; Хорошо, Джонатан М.; Шеппард, Дин (ноябрь 1987 г.). «Симптоматическая бронхоспазм после кратковременного вдыхания диоксида серы». Американский обзор респираторных заболеваний . 136 (5): 1117–1121. дои : 10.1164/ajrccm/136.5.1117 . ПМИД 3674573 .
- ^ Ньювенхейсен, MJ (2003). Оценка воздействия в профессиональной и экологической эпидемиологии. Лондон: Издательство Оксфордского университета. [ нужна страница ]
- ^ «Частицы загрязнения приводят к повышенному риску сердечного приступа» . Bloomberg LP, 17 января 2008 г. Архивировано из оригинала 29 июня 2011 г.
Загрязнители, которых много в городских районах, имеют размер менее 0,18 микрометра и вызывают в четыре раза больше скоплений артерий, чем частицы, в четыре раза большие, сказал Хесус Араужо, директор по охране окружающей среды. кардиология в Калифорнийском университете в Лос-Анджелесе.
- ^ Араужо, Хесус А.; и др. (17 января 2008 г.). «Загрязнители окружающей среды в виде сверхмелких частиц способствуют раннему атеросклерозу и системному окислительному стрессу» . Исследование кровообращения . 102 (5): 589–596. дои : 10.1161/CIRCRESAHA.107.164970 . ПМК 3014059 . ПМИД 18202315 .
- ^ Хенниг, Фрауке; Касс, Ульрих; Хеллак, Брайан; Куппер, Мириам; Кульбуш, Томас А.Дж.; Стафоджа, Массимо; Хоффманн, Барбара (февраль 2018 г.). «Количество сверхмелких и мелких частиц, концентрация на площади поверхности и ежедневная смертность от конкретных причин в Рурской области, Германия, 2009–2014 гг.» . Перспективы гигиены окружающей среды . 126 (2): 027008. doi : 10.1289/EHP2054 . ISSN 0091-6765 . ПМК 6066351 . ПМИД 29467106 .
- ^ Де Хесус, Альма Лорелей; и др. (2019). «Сверхмелкие частицы и PM 2,5 в воздухе городов по всему миру: являются ли они репрезентативными?» . Интернационал окружающей среды . 129 : 118–135. дои : 10.1016/j.envint.2019.05.021 . ПМИД 31125731 . S2CID 164216753 .
- ^ Липпманн, М., Коэн, Б.С., Шлезингер, Р.С. (2003). Наука о здоровье окружающей среды. Нью-Йорк: Издательство Оксфордского университета. [ нужна страница ]
- ^ «Матрица рассеяния типичной городской цементной пыли антропогенного происхождения и распознавание репрезентативных атмосферных частиц» .
- ^ «Опасности пожара на свалке металлолома в вашем районе» . 10 октября 2022 г.
- ^ «Пожар грузового судна потушен в гавани Виктория в Гонконге после 15-часового горения и распространения дыма по всему городу» . 3 июня 2021 г.
- ^ «Вонь от горящего корабля с металлическими отходами разносится по Гонконгу» .
- ^ «Шлак электродуговой печи (ЭДП)» . 3 июня 2021 г.
- ^ Наир, Абхилаш Т.; Мэтью, Аниш; ар, Арчана; Акбар, М. Абдул (2022). «Использование опасной пыли электродуговых печей в строительной отрасли: подход к более чистому производству» . Журнал чистого производства . 377 : 134282. Бибкод : 2022JCPro.37734282N . дои : 10.1016/j.jclepro.2022.134282 . S2CID 252553231 .
- ^ «Устойчивость» .
- ^ «Отчет об устойчивом развитии Жилищного управления Гонконга за 2012/13 год» (PDF) . Архивировано из оригинала (PDF) 28 июня 2023 года.
- ^ «Жилищное управление Гонконга – Экологический отчет 2020/21» . Архивировано из оригинала 28 июня 2023 года.
- ^ «Новости цементной отрасли от Global Cement» . Архивировано из оригинала 3 декабря 2022 года.
- ^ «Город «осаждён» нечестными цементными заводами, группы по борьбе с контрафакцией обнаружили 13 из них за один год» [Город «осаждён» нечестными цементными заводами, группы по борьбе с контрафакцией обнаружили 13 из них за один год] (на китайском языке).
- ^ «Растущее значение шлакового цемента в мировой цементной промышленности» . 6 июля 2022 г.
- ^ «Взгляд на новые правила рынка недвижимости. Шлакового дома больше нет . Шлак будет запрещен с 2021 года» (на китайском языке). 10 декабря 2020 г.
- ^ Новая редакция предпродажного договора дома запрещает "сталеплавильный шлак" и строителей будут штрафовать за нарушения] " Новая редакция договора предпродажи дома запрещает "сталеплавильный шлак" и строителей будут штрафовать за нарушения" [ (на китайском языке) .
- ^ «Сварка – дымы и газы, ответы по охране труда» . 10 февраля 2023 г.
- ^ Ли Ю, Чэнь Дж, Бу С, Ван С, Гэн Х, Гуань Г, Чжао Ц, Ао Л, Цюй В, Чжэн Ю, Цзинь Ю, Тан Дж (май 2021 г.). «Уровень свинца в крови и связанные с ним факторы риска у взрослых китайцев с 1980 по 2018 год». Экотоксикол Энвайрон Саф . 218 : 112294. Бибкод : 2021EcoES.21812294L . дои : 10.1016/j.ecoenv.2021.112294 . ПМИД 33984660 .
- ^ Хань З, Го Икс, Чжан Б, Ляо Дж, Не Л (июнь 2018 г.). «Уровни свинца в крови детей в городских и пригородных районах Китая (1997–2015 гг.): Временные и пространственные вариации и влияющие факторы». Научная Тотальная Окружающая среда . 625 : 1659–1666. Бибкод : 2018ScTEn.625.1659H . дои : 10.1016/j.scitotenv.2017.12.315 . ПМИД 29996461 . S2CID 51617692 .
- ^ Рен, Дж.; Тан, М.; Новоселац, А. (2022). «Экспериментальное исследование по количественной оценке осаждения частиц из воздуха на одежду и ресуспендирования из нее с использованием метода флуоресцентного отслеживания» . Строительство и окружающая среда . 209 : 108580. Бибкод : 2022BuEnv.20908580R . дои : 10.1016/j.buildenv.2021.108580 . ПМЦ 8620412 . ПМИД 34848915 .
- ^ «Работник строительной площадки в грязной одежде и обуви вошел в чайный ресторан. Пользователи сети раскритиковали уборщицу, которая была вся в грязи и устала от цемента: она была мертвой сестрой » . Гонконг 01 (на китайском языке). Проверено . 14 августа 2023 г.
- ^ Остро, Б.; Тобиас, А.; Керол, X.; Аластуэй, А.; Амато, Ф.; Пей, Дж.; Перес, Н.; Саньер, Дж. (2011). «Влияние источников твердых частиц на ежедневную смертность: перекрестное исследование в Барселоне, Испания» . Перспективы гигиены окружающей среды . 119 (12): 1781–1787. дои : 10.1289/ehp.1103618 . ПМК 3261985 . ПМИД 21846610 .
- ^ «10-летний план развития больниц» .
- ^ «Отдел архитектурных услуг – Строящиеся капитальные объекты» .
- ^ Ренард, Дж.Б.; Сурчин, Дж.; Аннеси-Маэсано, И.; Делоне, Г.; Пуанселе, Э.; Диксо, Г. (2022). «Связь между загрязнением PM 2,5 и смертностью от Covid-19 в Западной Европе в период 2020–2022 годов» . Наука об общей окружающей среде . 848 : 157579. Бибкод : 2022ScTEn.84857579R . doi : 10.1016/j.scitotenv.2022.157579 . ПМЦ 9310379 . ПМИД 35901896 .
- ^ Пероне, Гаэтано (2022). «Оценка влияния длительного воздействия девяти загрязнителей атмосферного воздуха на пространственное распространение COVID-19 и связанную с ним смертность в 107 итальянских провинциях» . Научные отчеты . 12 (1): 13317. Бибкод : 2022NatSR..1213317P . дои : 10.1038/s41598-022-17215-x . ПМЦ 9349267 . ПМИД 35922645 .
- ^ Кисер, Дэниел; Эльханан, Гай; Меткалф, Уильям Дж.; Шнидер, Брендан; Гржимски, Джозеф Дж. (2021). «Показатель положительных результатов теста на SARS-CoV-2 в Рино, штат Невада: связь с PM 2,5 во время задымления от лесных пожаров в 2020 году на западе США» . Журнал науки о воздействии и экологической эпидемиологии . 31 (5): 797–803. дои : 10.1038/s41370-021-00366-w . ПМЦ 8276229 . ПМИД 34257389 .
- ^ Солимини, Анджело; Филиппони, Ф.; Фегателли, Д. Алунни; Капуто, Б.; Де Марко, СМ; Спаньоли, А.; Вестри, Арканзас (2021 г.). «Глобальная связь между случаями Covid-19 и твердыми частицами в воздухе на региональном уровне» . Научные отчеты . 11 (1): 6256. doi : 10.1038/s41598-021-85751-z . ПМЦ 7973572 . ПМИД 33737616 .
- ^ «Из-за металлов и, возможно, даже коронавируса, дым лесных пожаров опаснее, чем вы думаете» . Лос-Анджелес Таймс . 22 июля 2021 г.
- ^ «Силикоз, информационные бюллетени по вопросам охраны труда» . 13 июня 2023 г.
- ^ Предотвращение силикоза и смертности от пескоструйной обработки (отчет). Центры по контролю и профилактике заболеваний . 1992. doi : 10.26616/NIOSHPUB92102 .
- ^ Перейти обратно: а б Флорес-Пажо, Мари-Клер; Офнер, Марианна; До, Минь Т.; Лавин, Эрик; Вильнев, Поль Дж. (ноябрь 2016 г.). «Расстройства детского аутистического спектра, воздействие диоксида азота и загрязнение воздуха твердыми частицами: обзор и метаанализ». Экологические исследования . 151 : 763–776. Бибкод : 2016ER....151..763F . дои : 10.1016/j.envres.2016.07.030 . ПМИД 27609410 .
- ^ Перейти обратно: а б Чун, ХиГён; Люнг, Шерил; Вэнь, Ши У; Макдональд, Джуди; Шин, Хвашин Х. (январь 2020 г.). «Воздействие загрязнения воздуха на мать и риск аутизма у детей: систематический обзор и метаанализ» . Загрязнение окружающей среды . 256 : 113307. Бибкод : 2020EPoll.25613307C . дои : 10.1016/j.envpol.2019.113307 . ПМИД 31733973 .
- ^ Перейти обратно: а б Лам, Джулин; Саттон, Патрис; Калькбреннер, Эми; Виндхэм, Гейл; Халладей, Алисия; Костас, Эрика; Лоулер, Синди; Дэвидсон, Лизетт; Дэниелс, Наталин; Ньюшаффер, Крейг; Вудрафф, Трейси (21 сентября 2016 г.). «Систематический обзор и метаанализ многочисленных загрязнителей воздуха и расстройств аутистического спектра» . ПЛОС ОДИН . 11 (9): e0161851. Бибкод : 2016PLoSO..1161851L . дои : 10.1371/journal.pone.0161851 . ПМК 5031428 . ПМИД 27653281 .
- ^ Перейти обратно: а б Вайскопф, Марк Г.; Киумурцоглу, Марианти-Анна; Робертс, Андреа Л. (декабрь 2015 г.). «Загрязнение воздуха и расстройства аутистического спектра: причинно-следственная связь или взаимосвязь?» . Текущие отчеты о состоянии окружающей среды . 2 (4): 430–439. дои : 10.1007/s40572-015-0073-9 . ПМЦ 4737505 . ПМИД 26399256 .
- ^ Перейти обратно: а б Фу, Пэнфэй; Юнг, Кен Кин Лам (15 сентября 2020 г.). «Загрязнение воздуха и болезнь Альцгеймера: систематический обзор и метаанализ». Журнал болезни Альцгеймера . 77 (2): 701–714. дои : 10.3233/JAD-200483 . ПМИД 32741830 . S2CID 220942039 .
- ^ Перейти обратно: а б Цай, Цунг-Лин; Линь, Ю-Тин; Хван, Бин-Фан; Накаяма, Сёдзи Ф.; Цай, Чон-Хау; Сунь, Сянь-Лян; Ма, Чаочен; Юнг, Чау-Рен (октябрь 2019 г.). «Мелкие твердые частицы являются потенциальным определяющим фактором болезни Альцгеймера: системный обзор и метаанализ». Экологические исследования . 177 : 108638. Бибкод : 2019ER....17708638T . дои : 10.1016/j.envres.2019.108638 . ПМИД 31421449 . S2CID 201057595 .
- ^ Перейти обратно: а б с Брейтуэйт, Изобель; Чжан, Шуо; Киркбрайд, Джеймс Б.; Осборн, Дэвид П.Дж.; Хейс, Джозеф Ф. (декабрь 2019 г.). «Воздействие загрязнения воздуха (твердыми частицами) и связь с депрессией, тревогой, биполярным расстройством, психозом и риском самоубийства: систематический обзор и метаанализ» . Перспективы гигиены окружающей среды . 127 (12): 126002. doi : 10.1289/EHP4595 . ПМЦ 6957283 . ПМИД 31850801 .
- ^ Перейти обратно: а б с Лу, Джексон Дж. (апрель 2020 г.). «Загрязнение воздуха: систематический обзор его психологических, экономических и социальных последствий». Современное мнение в психологии . 32 : 52–65. дои : 10.1016/j.copsyc.2019.06.024 . ПМИД 31557706 . S2CID 199147061 .
- ^ Перейти обратно: а б с Лю, Цицзин; Ван, Ваньчжоу; Гу, Сюэлинь; Дэн, Фуронг; Ван, Сюэцинь; Линь, Хуалян; Го, Синьбяо; У, Шаовэй (февраль 2021 г.). «Связь между загрязнением воздуха твердыми частицами и риском депрессии и самоубийства: систематический обзор и метаанализ». Наука об окружающей среде и исследования загрязнения . 28 (8): 9029–9049. Бибкод : 2021ESPR...28.9029L . дои : 10.1007/s11356-021-12357-3 . ПМИД 33481201 . S2CID 231677095 .
- ^ Шрауфнагель, Дин Э.; Бальмес, Джон Р.; Коул, Клейтон Т.; Де Маттейс, Сара; Юнг, Сун-Хи; Мортимер, Кевин; Перес-Падилья, Роджер; Райс, Мэри Б.; Риохас-Родригес, Орас; Суд, Акшай; Терстон, Джордж Д.; Или Тереза; Ванкер, Анесса; Вуэбблс, Дональд Дж. (февраль 2019 г.). «Загрязнение воздуха и неинфекционные заболевания» . Грудь 155 (2): 409–416. дои : 10.1016/j.chest.2018.10.042 . ПМК 6904855 . ПМИД 30419235 .
- ^ Кэррингтон, Дамиан; Макмаллан, Лидия; Блайт, Гарри; Робертс, Саймон; Халли-Джонс, Фрэнк (17 мая 2019 г.). «Выяснилось: загрязнение воздуха может нанести вред «каждому органу тела» » . Хранитель .
- ^ Перейти обратно: а б Раашу-Нильсен, Оле; Андерсен, Зорана Дж; Билен, Роб; Самоли, Евангелия; Стафоджа, Массимо; Вайнмайр, Гудрун; и др. (август 2013 г.). «Загрязнение воздуха и заболеваемость раком легких в 17 европейских когортах: проспективный анализ Европейского исследования когорт по воздействию загрязнения воздуха (ESCAPE)» . Ланцет онкологии . 14 (9): 813–822. дои : 10.1016/S1470-2045(13)70279-1 . ПМИД 23849838 .
- ^ Коэн А.Дж., Росс Андерсон Х., Остро Б., Панди К.Д., Кржижановский М., Кюнцли Н. и др. (2005). «Глобальное бремя болезней из-за загрязнения атмосферного воздуха». Журнал токсикологии и гигиены окружающей среды. Часть А. 68 (13–14): 1301–7. Бибкод : 2005JTEHA..68.1301C . дои : 10.1080/15287390590936166 . ПМИД 16024504 . S2CID 23814778 .
- ^ «Загрязнение воздуха и сердечно-сосудистые заболевания» . Национальный институт наук о здоровье окружающей среды. Архивировано из оригинала 14 мая 2011 года.
- ^ Лаве, Лестер Б .; Сескин, Евгений П. (июнь 1973 г.). «Анализ связи между смертностью в США и загрязнением воздуха». Журнал Американской статистической ассоциации . 68 (342): 284–290. дои : 10.1080/01621459.1973.10482421 . eISSN 1537-274X . ISSN 0162-1459 .
- ^ Мокдад А.Х., Маркс Дж.С., Строуп Д.Ф., Гербердинг Дж.Л. (март 2004 г.). «Фактические причины смерти в США, 2000 г.». ДЖАМА . 291 (10): 1238–45. дои : 10.1001/jama.291.10.1238 . ПМИД 15010446 . S2CID 14589790 .
- ^ Перейти обратно: а б Европейское агентство по окружающей среде (2009). Пространственная оценка концентрации PM 10 и озона в Европе (2005 г.) . Офис публикаций. дои : 10.2800/165 . ISBN 978-92-9167-988-1 . [ нужна страница ]
- ^ Лим С.С., Вос Т., Флаксман А.Д., Данаи Г., Сибуя К., Адэр-Рохани Х. и др. (декабрь 2012 г.). «Сравнительная оценка риска бремени болезней и травм, связанных с 67 факторами риска и группами факторов риска в 21 регионе, 1990-2010 годы: систематический анализ для исследования глобального бремени болезней 2010 года» . Ланцет . 380 (9859): 2224–60. дои : 10.1016/s0140-6736(12)61766-8 . ПМК 4156511 . ПМИД 23245609 .
- ^ «Загрязнение воздуха в Европе: это наиболее пострадавшие города для жизни» . Евроньюс . 24 декабря 2021 г. Проверено 1 апреля 2022 г.
- ^ Ладен, Ф; Неас, LM; Докери, Д.В.; Шварц, Дж (октябрь 2000 г.). «Связь мелких твердых частиц из разных источников с ежедневной смертностью в шести городах США» . Перспективы гигиены окружающей среды . 108 (10): 941–947. дои : 10.1289/ehp.00108941 . ПМК 1240126 . ПМИД 11049813 .
- ^ Озкайнак, Халук; Терстон, Джордж Д. (декабрь 1987 г.). «Связь между уровнем смертности в США в 1980 году и альтернативными показателями концентрации частиц в воздухе». Анализ рисков . 7 (4): 449–461. Бибкод : 1987РискА...7..449О . дои : 10.1111/j.1539-6924.1987.tb00482.x . ПМИД 3444932 .
- ^ Майу, Николас А.; Абель, Дэвид В.; Холлоуэй, Трейси; Патц, Джонатан А. (16 мая 2022 г.). «Общенациональная и региональная польза для здоровья от выбросов PM 2,5 , связанных с качеством воздуха, от удаления выбросов, связанных с энергетикой, в Соединенных Штатах» . ГеоЗдоровье . 6 (5): e2022GH000603. Бибкод : 2022GHeal...6..603M . дои : 10.1029/2022GH000603 . ПМК 9109601 . ПМИД 35599962 .
- ^ Кэррингтон, Дамиан (17 февраля 2021 г.). «Загрязнение воздуха значительно повышает риск бесплодия, показывают исследования» . Хранитель .
- ^ Чжан М., Мюллер Н.Т., Ван Х, Хонг Х, Аппель Л.Дж., Ван Х (июль 2018 г.). «Воздействие на мать твердых частиц размером ≤2,5 мкм во время беременности и риск высокого кровяного давления в детстве» . Гипертония . 72 (1): 194–201. doi : 10.1161/ГИПЕРТЕНЗИЯХА.117.10944 . ПМК 6002908 . ПМИД 29760154 .
- ^ Сапкота А., Челиковский А.П., Нахман К.Е., Коэн А.Дж., Ритц Б. (1 декабря 2012 г.). «Воздействие твердых частиц и неблагоприятные исходы родов: всесторонний обзор и метаанализ». Качество воздуха, атмосфера и здоровье . 5 (4): 369–381. Бибкод : 2012AQAH....5..369S . дои : 10.1007/s11869-010-0106-3 . S2CID 95781433 .
- ^ Перейти обратно: а б с Сакс Дж. «Итоговый отчет 2009 г.: Комплексная научная оценка твердых частиц» . Национальный центр экологической оценки Агентства по охране окружающей среды США, Research Triangle Park Nc, Группа оценки экологических сред . Проверено 31 марта 2017 г.
- ^ Эриксон AC, Арбор Л (26 ноября 2014 г.). «Общее патоэтиологическое воздействие загрязнения воздуха твердыми частицами и социальной среды на развитие плода и плаценты» . Журнал окружающей среды и общественного здравоохранения . 2014 : 901017. doi : 10.1155/2014/901017 . ПМЦ 4276595 . ПМИД 25574176 .
- ^ Ли ПК, Талботт Э.О., Робертс Дж.М., Катов Дж.М., Билоник Р.А., Стоун Р.А. и др. (август 2012 г.). «Воздействие загрязнения окружающего воздуха и изменения артериального давления во время беременности» . Экологические исследования . 117 : 46–53. Бибкод : 2012ER....117...46L . дои : 10.1016/j.envres.2012.05.011 . ПМЦ 3656658 . ПМИД 22835955 .
- ^ Вудрафф Т.Дж., Паркер Дж.Д., Дэрроу Л.А., Слама Р., Белл М.Л., Чой Х. и др. (апрель 2009 г.). «Методологические вопросы исследований загрязнения воздуха и репродуктивного здоровья» . Экологические исследования . 109 (3): 311–320. Бибкод : 2009ER....109..311W . дои : 10.1016/j.envres.2008.12.012 . ПМК 6615486 . ПМИД 19215915 .
- ^ Бирн CD, Филлипс DI (ноябрь 2000 г.). «Фетальное происхождение заболеваний у взрослых: эпидемиология и механизмы» . Журнал клинической патологии . 53 (11): 822–8. дои : 10.1136/jcp.53.11.822 . ПМЦ 1731115 . ПМИД 11127263 .
- ^ Баркер DJ (ноябрь 1990 г.). «Фетальное и младенческое происхождение болезней взрослых» . БМЖ . 301 (6761): 1111. doi : 10.1136/bmj.301.6761.1111 . ПМЦ 1664286 . ПМИД 2252919 .
- ^ Поуп К.А. , Бернетт Р.Т., Тун М.Дж., Калле Э.Э., Кревски Д., Ито К., Терстон Г.Д. (март 2002 г.). «Рак легких, сердечно-легочная смертность и длительное воздействие загрязнения воздуха мелкими частицами» . ДЖАМА . 287 (9): 1132–41. дои : 10.1001/jama.287.9.1132 . ПМК 4037163 . ПМИД 11879110 .
- ^ в ЕС Предел PM 2,5 гноится: новое исследование связало PM с сердечным приступом Чезарони Г., Форастьер Ф., Стафоджа М., Андерсен З.Дж., Бадалони С., Билен Р. и др. (январь 2014 г.). «Длительное воздействие загрязнения окружающего воздуха и частота острых коронарных событий: проспективное когортное исследование и метаанализ в 11 европейских когортах проекта ESCAPE» . БМЖ . 348 : f7412. дои : 10.1136/bmj.f7412 . ПМЦ 3898420 . ПМИД 24452269 .
- ^ Хасси С.Дж., Первес Дж., Олкок Н., Фернандес В.Е., Монкс П.С., Кетли Дж.М. и др. (май 2017 г.). «Загрязнение воздуха изменяет биопленки Staphylococcus aureus и Streptococcus pneumoniae, толерантность к антибиотикам и колонизацию» (PDF) . Экологическая микробиология . 19 (5): 1868–1880. Бибкод : 2017EnvMi..19.1868H . дои : 10.1111/1462-2920.13686 . ПМК 6849702 . ПМИД 28195384 .
- ^ «Национальное исследование изучает риски для здоровья, связанные с загрязнением крупными частицами» . www.newswise.com .
- ^ «Монголия: загрязнение воздуха в Улан-Баторе связано с кризисом общественного здравоохранения» .
- ^ Мэтьюз, Дилан (27 декабря 2021 г.). «Как люди могли прожить на два года дольше» . Вокс .
- ^ Саймонс, Анджела (15 декабря 2022 г.). «Уровень самоубийств растет по мере ухудшения качества воздуха, показывают исследования» . Евроньюс . Проверено 19 декабря 2022 г.
- ^ Фан, Шу-Цзюнь; Генрих, Иоахим; Блум, Майкл С.; Чжао, Тянь-Юй; Ши, Тун-Син; Фэн, Вэнь-Ру; Сунь, Йи; Шен, Цзи-Чуань; Ян, Чжи-Цун; Ян, Бо-И; Донг, Гуан-Хуэй (январь 2020 г.). «Загрязнение атмосферного воздуха и депрессия: систематический обзор с метаанализом до 2019 года» . Наука об общей окружающей среде . 701 : 134721. Бибкод : 2020ScTEn.70134721F . doi : 10.1016/j.scitotenv.2019.134721 . ПМИД 31715478 . S2CID 207944384 . Архивировано из оригинала 31 марта 2022 года . Проверено 26 января 2022 г.
- ^ Махер, Барбара А.; Ахмед, Имад AM; Карлуковский, Василий; Макларен, Дональд А.; Фулдс, Пенелопа Г.; Олсоп, Дэвид; Манн, Дэвид М.А.; Торрес-Хардон, Рикардо; Кальдерон-Гарсидуэнас, Лилиан (27 сентября 2016 г.). «Наночастицы загрязнения магнетитом в человеческом мозге» . Труды Национальной академии наук . 113 (39): 10797–10801. Бибкод : 2016PNAS..11310797M . дои : 10.1073/pnas.1605941113 . ПМК 5047173 . ПМИД 27601646 .
- ^ «Болезнь Паркинсона» .
- ^ Каннинен, К.М.; Лампинен, Р.; Рантанен, Л.М.; Одендал, Л.; Джалава, П.; Чу, С.; Уайт, Арканзас (1 июня 2020 г.). «Культуры обонятельных клеток для изучения последствий загрязнения воздуха для здоровья: последствия нейродегенерации» . Нейрохимия Интернэшнл . 136 : 104729. doi : 10.1016/j.neuint.2020.104729 . ПМИД 32201281 . S2CID 214585295 – через ScienceDirect.
- ^ Коэн А.Дж., Росс Андерсон Х., Остро Б., Панди К.Д., Кржижановский М., Кюнцли Н. и др. (2005). «Глобальное бремя болезней из-за загрязнения атмосферного воздуха». Журнал токсикологии и гигиены окружающей среды. Часть А. 68 (13–14): 1301–7. Бибкод : 2005JTEHA..68.1301C . дои : 10.1080/15287390590936166 . ПМИД 16024504 . S2CID 23814778 .
- ^ Наврот Т.С., Перес Л., Кюнцли Н., Мунтерс Э., Немери Б. (февраль 2011 г.). «Значение триггеров инфаркта миокарда для общественного здравоохранения: сравнительная оценка риска». Ланцет . 377 (9767): 732–40. дои : 10.1016/S0140-6736(10)62296-9 . ПМИД 21353301 . S2CID 20168936 . «Принимая во внимание OR и распространенность воздействия, самый высокий PAF был оценен для воздействия дорожного движения (7,4%)...»:»... Коэффициенты [O]dds и частоты каждого триггера были использованы для расчета, относящегося к населению. фракции (PAF), которые оценивают долю случаев, которых можно было бы избежать, если бы фактор риска был устранен, PAF зависят не только от силы фактора риска на индивидуальном уровне, но и от его частоты в обществе... [T] Распространенность воздействия триггеров в соответствующих Временное окно контроля варьировалось от 0,04% для употребления кокаина до 100% для загрязнения воздуха... Принимая во внимание OR и распространенность воздействия, самый высокий PAF был оценен для воздействия дорожного движения (7,4%).
- ^ «Ресурсы и информация» (PDF) . www16.baq2008.org . Архивировано из оригинала (PDF) 17 декабря 2008 года.
- ^ Перейти обратно: а б Смайли, Кевин Т. (2019). «Расовое и экологическое неравенство в пространственных закономерностях распространенности астмы на юге США». Юго-восточный географ . 59 (4): 389–402. дои : 10.1353/sgo.2019.0031 . S2CID 210244838 . Проект МУЗА 736789 .
- ^ «Ошибка: Eur. Phys. JC22, 695–705 (2002) – DOI 10.1007/s100520100827 Опубликовано в Интернете: 7 декабря 2001 г.». Европейский физический журнал C . 24 (4): 665–666. Август 2002 г. Бибкод : 2002EPJC...24..665. . дои : 10.1007/s10052-002-0987-x . S2CID 195313204 .
- ^ Перейти обратно: а б Микати, Ихаб; Бенсон, Адам Ф.; Любен, Томас Дж.; Сакс, Джейсон Д.; Ричмонд-Брайант, Дженнифер (1 апреля 2018 г.). «Различия в распределении источников выбросов твердых частиц по расе и уровню бедности» . Американский журнал общественного здравоохранения . 108 (4): 480–485. дои : 10.2105/AJPH.2017.304297 . ПМК 5844406 . ПМИД 29470121 .
- ^ «Городское загрязнение воздуха и неравенство в отношении здоровья: отчет семинара» . Перспективы гигиены окружающей среды . 109 (с3): 357–374. 1 июня 2001 г. doi : 10.1289/ehp.01109s3357 .
- ^ Перейти обратно: а б с Джервис, Рик; Гомес, Алан (12 октября 2020 г.). «Расизм превратил их район в «Раковую аллею». Теперь они умирают от Covid-19» . США сегодня .
- ^ Агентство по охране окружающей среды США, OAR (12 ноября 2018 г.). «Как дым от пожаров может повлиять на ваше здоровье» . Агентство по охране окружающей среды США . Проверено 26 ноября 2020 г.
- ^ Вегессер Т.К., Пинкертон К.Е., Последний JA (июнь 2009 г.). «Пожары в Калифорнии в 2008 году: токсичность крупных и мелких твердых частиц» . Перспективы гигиены окружающей среды . 117 (6): 893–7. дои : 10.1289/ehp.0800166 . ПМК 2702402 . ПМИД 19590679 .
- ^ Хайкервал А., Акрам М., Дель Монако А., Смит К., Сим М.Р., Мейер М. и др. (июль 2015 г.). «Влияние воздействия мелких твердых частиц (PM 2,5 ) во время лесных пожаров на состояние сердечно-сосудистой системы» . Журнал Американской кардиологической ассоциации . 4 (7): e001653. дои : 10.1161/JAHA.114.001653 . ПМК 4608063 . ПМИД 26178402 .
- ^ Рид С.Э., Консидайн Э.М., Уотсон Г.Л., Телеска Д., Пфистер Г.Г., Джерретт М. (август 2019 г.). «Связь между здоровьем органов дыхания и озоном и мелкими твердыми частицами во время лесных пожаров» . Интернационал окружающей среды . 129 : 291–298. Бибкод : 2019EnInt.129..291R . дои : 10.1016/j.envint.2019.04.033 . ПМИД 31146163 .
- ^ Хайкервал А., Акрам М., Сим М.Р., Мейер М., Абрамсон М.Дж., Деннекамп М. (январь 2016 г.). «Воздействие мелких твердых частиц (PM 2,5 ) во время длительного периода лесных пожаров и посещений отделений неотложной помощи по поводу астмы» . Респирология . 21 (1): 88–94. дои : 10.1111/соответственно 12613 . ПМИД 26346113 . S2CID 22910313 .
- ^ ДеФлорио-Баркер С., Крукс Дж., Рейес Дж., Раппольд А.Г. (март 2019 г.). «Сердечно-легочные эффекты воздействия мелких твердых частиц на пожилых людей в периоды лесных пожаров и без них в Соединенных Штатах, 2008-2010 гг.» . Перспективы гигиены окружающей среды . 127 (3): 37006. дои : 10.1289/EHP3860 . ПМК 6768318 . ПМИД 30875246 .
- ^ Цзян, Кевин (27 июня 2023 г.). «Что такое «дымной мозг»? Как загрязнение воздуха может нанести вред нашему познанию и психическому здоровью» . Торонто Стар .
- ^ Ричи, Ханна; Розер, Макс (2021). «Какие источники энергии самые безопасные и чистые?» . Наш мир в данных . Архивировано из оригинала 15 января 2024 года. Источники данных: Markandya & Wilkinson (2007); НКДАР ООН (2008; 2018); Совакул и др. (2016); МГЭИК ДО5 (2014 г.); Пель и др. (2017); Эмбер Энерджи (2021).
- ^ Перейти обратно: а б The Guardian , 18 марта 2021 г. «Нефтяные компании десятилетия назад знали, что ископаемое топливо представляет серьезную угрозу для здоровья, свидетельствуют факты; эксклюзив: документы, просмотренные Guardian. Шоу-компании нарушали правила чистого воздуха, несмотря на то, что осознавали вред, причиняемый загрязнением воздуха»
- ^ The Guardian «75 способов, которыми Трамп сделал Америку грязнее, а планету теплее: за последние четыре года Трамп подорвал защиту окружающей среды для американских земель, животных и людей»
- ^ Союз обеспокоенных ученых, 27 апреля 2020 г. «Призрак нефтяной промышленности пишет смертоносную антиэкологическую политику Трампа»
- ^ Хоган CM (2010). Эмили Моноссон и К. Кливленд (ред.). «Абиотический фактор» . Энциклопедия Земли . Национальный совет по науке и окружающей среде.
- ^ Агентство по охране окружающей среды США, OAR (26 апреля 2016 г.). «Воздействие твердых частиц (ТЧ) на здоровье и окружающую среду» . Агентство по охране окружающей среды США . Проверено 5 октября 2019 г.
- ^ Хамра Г.Б., Гуха Н., Коэн А., Ладен Ф., Раашу-Нильсен О., Самет Дж.М. и др. (сентябрь 2014 г.). «Воздействие твердых частиц на открытом воздухе и рак легких: систематический обзор и метаанализ» . Перспективы гигиены окружающей среды . 122 (9): 906–11. дои : 10.1289/ehp.1408092 . ПМЦ 4154221 . ПМИД 24911630 .
- ^ Департамент окружающей среды (25 февраля 2016 г.). «Национальные меры по охране окружающей среды (качество окружающего воздуха)» . Федеральный реестр законодательства . Проверено 16 ноября 2018 г.
- ^ «Стандарты качества окружающего воздуха» (PDF) . Архивировано (PDF) из оригинала 30 апреля 2013 года . Проверено 30 апреля 2013 г.
- ^ Перейти обратно: а б «Стандарты качества воздуха – Окружающая среда – Европейская комиссия» . Ec.europa.eu . Проверено 1 февраля 2015 г.
- ^ «Цели качества воздуха» . Департамент охраны окружающей среды, Гонконг. 19 декабря 2012 года . Проверено 27 июля 2013 г.
- ^ «Меры по борьбе с мелкими твердыми частицами (PM 2.5 ) | Бюро по охране окружающей среды Токийского города по борьбе с воздухом, шумом, вибрацией и запахом» . Kankyo.metro.tokyo.jp. Архивировано из оригинала 28 февраля . 2015 г. .
- ^ «Стандарты качества воздуха» (PDF) .
- ^ "Дом" . airkorea.or.kr .
- ^ «Экологические стандарты по мелкой пыли ужесточены до уровня развитых стран... «плохой» уровень, вероятно, увеличится в четыре раза» .
- ^ « Управление по контролю за взвешенными частицами» . Проверено 16 ноября 2015 г. .
- ^ «ОБЪЕКТ: Причина для беспокойства: загрязнение воздуха: группы – Taipei Times» . www.taipeitimes.com . 5 февраля 2014 г.
- ^ Перейти обратно: а б «Пм Наакс | Нас Эпа» . Epa.gov . Проверено 1 февраля 2015 г.
- ^ «Агентство по охране окружающей среды – Твердые частицы (PM-10)» . Epa.gov. 28 июня 2006 г. Проверено 1 февраля 2015 г.
- ^ «Глобальные рекомендации ВОЗ по качеству воздуха» (PDF) . ВОЗ .
- ^ «Канадские стандарты качества окружающего воздуха (CAAQS) для мелких твердых частиц (PM 2,5 ) и озона» (PDF) . Архивировано из оригинала (PDF) 20 декабря 2016 года . Проверено 11 декабря 2016 г.
- ^ «Горите лучше: вносим изменения для более чистого воздуха» .
- ^ «Руководство по сжиганию дров в Лондоне» .
- ^ «Сжигатели дров: каковы новые правила и будут ли они запрещены?» . Independent.co.uk . 6 февраля 2023 г.
- ^ Тенденции качества воздуха - Как интерпретировать графики
- ^ «Интернет-страница нанотехнологий» . Департамент контроля токсичных веществ. Архивировано 2008. 1 января 2010 года.
- ^ Перейти обратно: а б «Веб-страница приема химической информации» . Департамент контроля токсичных веществ. 2008. Архивировано из оригинала 18 марта 2010 года . Проверено 28 декабря 2009 г.
- ^ Вонг Дж. (22 января 2009 г.), Письмо с вызовом (PDF) , заархивировано из оригинала (PDF) 27 января 2017 г. , получено 28 декабря 2009 г.
- ^ «Список контактов CNT, документ от 22 и 26 января 2009 г.» (PDF) . Архивировано из оригинала (PDF) 31 января 2017 года . Проверено 28 декабря 2009 г.
- ^ «Архив симпозиумов по нанотехнологиям DTSC» . Департамент контроля токсичных веществ. Архивировано из оригинала 1 января 2010 года.
- ^ Прием химической информации: Nanomaterials dtsc.ca.gov. Архивировано 1 января 2010 г. на Wayback Machine.
- ^ Перейти обратно: а б с «Города, в которых загрязнение воздуха выросло и снизилось больше всего с 2019 года» . 20 февраля 2023 г.
- ^ «Составлено на карте: новое исследование показывает изменения загрязнения воздуха в городах по всему миру» . Форбс .
- ^ Оливер Милман (1 апреля 2015 г.). «Призыв к действиям по борьбе с загрязнением окружающей среды, поскольку выбросы, связанные с респираторными заболеваниями, удваиваются» . Хранитель . Проверено 3 апреля 2015 г.
выбросы основного загрязнителя, вызывающего респираторные заболевания, удвоились за последние пять лет
- ^ Ли, Цзе; Ду, Хуэйюнь; Ван, Зифа; Сунь, Йеле; Ян, Вэньи; Ли, Цзяньцзюнь; Тан, Сяо; Фу, Пинцин (1 апреля 2017 г.). «Быстрое формирование сильной региональной зимней дымки над кластером мегаполисов на Северо-Китайской равнине» . Загрязнение окружающей среды . 223 : 605–615. Бибкод : 2017EPoll.223..605L . дои : 10.1016/j.envpol.2017.01.063 . ISSN 0269-7491 . ПМИД 28159396 .
- ^ Чжун, Сяое; Ляо, Цзе, Е; Цзян, Лифэн; Лю, Лянкэ; Ван, Яцян; Ван, Чжоу, Цзыцзян; 2022). за 6 часов PM 2.5 с 1960 по 2020 год в Китае» . Реконструкция наборов данных « 14 (7): 3197–3211. Бибкод : 2022ESSD...14.3197Z : 10.5194 / 14-3197-2022 . ISSN 1866-3508 . essd doi -
- ^ «Китай: ежегодные уровни PM 2,5, Пекин, 2022» . Статистика . Проверено 1 апреля 2023 г.
- ^ Генеральное консульство Соединенных Штатов Америки в Гуанчжоу, Китай (nd). «Мониторинг качества воздуха консульства США и StateAir» . Госдепартамент США. Архивировано из оригинала 1 июля 2011 года . Проверено 24 декабря 2014 г.
- ^ «Вооруженная данными НАСА, Южная Корея борется с удушающим смогом» . ЭНЕРГЕТИЧЕСКИЙ ЯДЕРНЫЙ РЕАКТОР .
- ^ «Исследование НАСА и NIER показало, что 48% твердых частиц поступает из-за пределов Южной Кореи» .
- ^ «Китай и Южная Корея налаживают сотрудничество в области окружающей среды» . 26 июня 2018 г.
- ^ «Загрязнение воздуха душит Таиланд, поскольку участники кампании призывают к более строгим законам» .
- ^ «Из-за загрязнения воздуха 200 000 человек были госпитализированы за одну неделю, поскольку испарения, выбросы и дым обрушились на Таиланд» . 13 марта 2023 г.
- ^ «Загрязнение атмосферного (наружного) воздуха» . www.who.int .
- ^ «Авиационное загрязнение» .
- ^ «Глава 1 — Летучая зола — Инженерный материал — Факты о летучей золе для инженеров-дорожников — Переработка — Устойчивое развитие — Тротуары — Федеральное управление шоссейных дорог» . Федеральное управление автомобильных дорог (FHWA) .
- ^ «Рейтинги городов, состояние воздуха, Американская ассоциация легких» .
- ^ «Самые грязные и чистые города Америки (самые худшие вас удивят)» . Форбс .
- ^ «Маска N95 — ваша лучшая защита от дыма лесных пожаров | Время» . 7 июня 2023 г.
Дальнейшее чтение
[ редактировать ]Контроль
[ редактировать ]- «Лучшие методы обеспечения качества воздуха в помещении при реконструкции вашего дома» . Агентство по охране окружающей среды США . 7 января 2015 г.
- «Примеры борьбы с пылью на рабочем месте» . Агентство по охране окружающей среды Виктория .
Здоровье
[ редактировать ]- Кэррингтон, Дамиан (17 сентября 2019 г.). «Частицы загрязнения воздуха обнаружены на стороне плаценты плода – исследование» . TheGuardian.com .
- Лю XQ, Хуан Дж, Сун С, Чжан ТЛ, Лю ЮП, Ю Л (2023). «Токсичность для развития нервной системы, вызванная воздействием PM 2.5 , и ее возможная роль в нейродегенеративных и психических расстройствах». Hum Exp Токсикол . 42 : 9603271231191436. Бибкод : 2023HETox..4291436L . дои : 10.1177/09603271231191436 . ПМИД 37537902 . S2CID 260485784 .
- InsideEPA.com: Исследование связывает токсичность воздуха с сердечными заболеваниями у мышей на фоне разногласий EPA [ мертвая ссылка ]
- Г. Инверницци и др., Твердые частицы табака в сравнении с выхлопами дизельных автомобилей: образовательная перспектива . Борьба против табака 13, S.219–221 (2004 г.)
- Хант, А.; Авраам, Дж.Л.; Джадсон, Б.; Берри, CL (2003). «Токсикологические и эпидемиологические данные, полученные на основе описания мелких твердых частиц лондонского смога 1952 года в тканях легких при архивном вскрытии» . Перспективы гигиены окружающей среды . 111 (9): 1209–1214. дои : 10.1289/ehp.6114 . ПМК 1241576 . ПМИД 12842775 .
Более
[ редактировать ]- «Курс по загрязнению твердыми частицами» . Агентство по охране окружающей среды США . 12 сентября 2014 г.
- Войланд, Адам. «Аэрозоли: крошечные частицы, большое воздействие». НАСА, 2 ноября 2010 г., Аэрозоли: крошечные частицы, большое воздействие
- Глава Межправительственной группы экспертов по изменению климата (главный международный научный орган по изменению климата), посвященная атмосферным аэрозолям и их радиационному воздействию.
- Прейнинг, Отмар и Э. Джеймс Дэвис (ред.), «История аэрозольной науки», Австрийская академия наук, ISBN 3-7001-2915-7 (Пбк.)
- Елонек З., Дробняк А., Масталерз М., Елонек И. (декабрь 2020 г.). «Экологические последствия качества угольных брикетов и кускового древесного угля, используемого для гриля». Научная Тотальная Окружающая среда . 747 : 141267. Бибкод : 2020ScTEn.74741267J . doi : 10.1016/j.scitotenv.2020.141267 . ПМИД 32777507 . S2CID 221100463 .
- Хиндс, Уильям К., Аэрозольная технология: свойства, поведение и измерение частиц в воздухе , Wiley-Interscience, ISBN 0-471-19410-7
- Зангари, Шелби и др., Изменения качества воздуха в Нью-Йорке во время пандемии COVID-19. Наука об общей окружающей среде 742 (2020)
- НАРСТО (2004 г.) Наука о твердых частицах для политиков: оценка НАРСТО. П. Макмерри, М. Шеперд и Дж. Викери, ред. Издательство Кембриджского университета, Кембридж, Англия. ISBN 0 52 184287 5 .
- «70 лет со дня великого лондонского смога 1952 года, качество воздуха в современном контексте» . 5 декабря 2022 г.
- «Основной источник загрязнения воздуха: фермы - Институт Земли» .
- «Нелегальное место для барбекю в Гонконге, что-нибудь пожевать | South China Morning Post» . 4 декабря 2021 г.
- АЛВЕС, Селия А.; Евтюгина, Маргарита; Висенте, Эстела; Висенте, Ана; Гонсалвес, Катя; НЕТО, Ана Изабель; НУНЕС, Тереза; Ковац, Нора (15 сентября 2022 г.). «Угольный гриль на открытом воздухе: выбросы твердых частиц и газовой фазы, органическая экспертиза и экотоксикологическая оценка - ScienceDirect» . Атмосферная среда . 285 : 119240. doi : 10.1016/j.atmosenv.2022.119240 . S2CID 249860528 .
- Папахристопулу, Кириакула; Раптис, Иоаннис-Панагиотис; Гкикас, Антонис; Фунтулакис, Илиас; Масум, Акрити; Казадзис, Стелиос (2022). «Режим оптической толщины аэрозоля над мегаполисами мира» . Химия и физика атмосферы . 22 (24): 15703–15727. Бибкод : 2022ACP....2215703P . дои : 10.5194/acp-22-15703-2022 .
- Огаса, Никк (2021). «Загрязнение воздуха помогает лесным пожарам создавать свои собственные молнии» . Наука . дои : 10.1126/science.abj6782 . S2CID 236389007 .
- «Вес цифр: загрязнение воздуха и PM 2,5 » . Журнал «Undark» . Проверено 27 сентября 2019 г.
- ДЖЕФФ ЧАРЛТОН Планирование пандемии: обзор уровней защиты респираторов и масок.
Внешние ссылки
[ редактировать ]Контроль
[ редактировать ]- Контроль пыли при строительстве и сносе
- Контроль строительной пыли с помощью вытяжного устройства (4-страничный PDF-файл с фотографиями)
- Остерегайтесь пыли - Hilti Россия | Контроль пыли - Hilti Россия
- Что такое местная вытяжная вентиляция (МВВ)?
- Сварочный дым: защитите своих работников
- Учебный комплект «Инструментарий по охране окружающей среды» от Строительной ассоциации Гонконга, содержащий множество иллюстрированных полезных советов по контролю загрязнения твердыми частицами. Архивировано из оригинала 3 июля 2023 года.
Другие
[ редактировать ]- Минута Земли НАСА: Меня зовут аэрозоль
- Аэрозольные механизмы SARS-CoV-2, Аэрозольное общество
- Текущая глобальная карта PM 1 распространения | Текущая глобальная карта PM 1 и PM 2,5 распространения | Текущая глобальная карта PM 1 , PM 2,5 и PM 10 распространения
- Текущая глобальная карта аэрозольной оптической толщины органического вещества в зеленом свете
- Качество воздуха в реальном времени | О
- Карта качества воздуха | О
- Факты загрязнения по индексу качества воздуха и жизни
- Воздействие загрязнителей воздуха на здоровье . ЭПД Гонконг. * Архивировано из оригинала 5 января 2014 года.
- Источники вдыхаемых и мелкодисперсных взвешенных частиц . ЭПД Гонконг. * Архивировано из оригинала 21 сентября 2024 г.
- Роль Precision Environmental Health в предотвращении заболеваний
| Базы данных органов управления : Национальные |
|---|