Экономика России
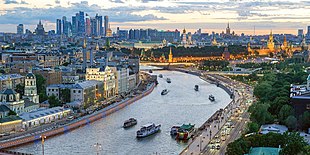 Москва , финансовый центр России | |
| Валюта | Российский рубль (RUB или руб или ₽) |
|---|---|
| Календарный год [1] | |
Торговые организации | ВТО , БРИКС , ЕАЭС , СНГ , ФСЭГ , АТЭС , G20 и другие. |
Группа стран |
|
| Статистика | |
| Население | |
| GDP | |
| GDP rank | |
GDP growth |
|
GDP per capita | |
GDP per capita rank | |
GDP by sector |
|
| |
Population below poverty line | |
Labor force | |
Labor force by occupation |
|
| Unemployment |
|
Average gross salary | RUB 76,604 / €700 per month |
| RUB 66,645 / €609 per month | |
Main industries | Complete range of mining and extractive industries producing coal, oil, gas, chemicals, and metals; all forms of machine building from rolling mills to high-performance aircraft and space vehicles; defence industries (including radar, missile production, advanced electronic components), shipbuilding; road and rail transportation equipment; communications equipment; agricultural machinery, tractors, and construction equipment; electric power generating and transmitting equipment; medical and scientific instruments; consumer durables, textiles, foodstuffs, handicrafts |
| External | |
| Exports | |
Export goods | Crude petroleum, refined petroleum, natural gas, coal, wheat, iron (2019) |
Main export partners |
|
| Imports | |
Import goods | Cars and vehicle parts, packaged medicines, broadcasting equipment, aircraft, computers (2019) |
Main import partners |
|
FDI stock | |
Gross external debt | |
| Public finances | |
| 3.8% of GDP (2022)[20] | |
| Revenues | 49.606 ₽ trillion[18] 33.22% of GDP (2022)[18] |
| Expenses | 53.038 ₽ trillion[18] 35.52% of GDP (2022)[18] |
All values, unless otherwise stated, are in US dollars. | |
Экономика России является высокодоходной , [26] промышленно развитый, [27] смешанная рыночная экономика . [28] она занимает одиннадцатое место в мире по номинальному ВВП и шестое место по паритету покупательной способности (ППС). По данным МВФ, [5] и четвертая по величине экономика по ВВП (ППС) по данным Всемирного банка. [29] Россия обладает огромными запасами природных ресурсов, особенно с точки зрения запасов российского природного газа и нефти , и, таким образом, значительная экономическая мощь заключена в ее экспорте . [30] Из-за нестабильного курса валюты ее ВВП, измеряемый в долларах, резко колеблется. [31] Россия была последней крупной экономикой, присоединившейся к Всемирной торговой организации (ВТО), став ее членом в 2012 году. [32]
Обширная география России является важным фактором, определяющим ее экономическую деятельность, поскольку страна владеет значительной долей мировых природных ресурсов . [33] Его широко называют энергетической сверхдержавой ; [34] поскольку она обладает крупнейшими в мире запасами природного газа , [35] 2-е место по запасам угля , [36] 8th-largest oil reserves,[37] and the largest oil shale reserves in Europe.[38] It is the world's leading natural gas exporter,[39] the 2nd-largest natural gas producer,[40] the 2nd-largest oil exporter[41] and producer[42] and third largest coal exporter.[43] Russia's foreign exchange reserves are the world's 5th-largest.[44] It has a labour force of roughly 70 million people, which is the world's 7th-largest.[45] Russia is the world's 3rd-largest exporter of arms.[46] The oil and gas sector accounted up to roughly 34% of Russia's federal budget revenues,[47] and up to 54% of its exports in 2021.[48][49]
Russia's inequality of household income and wealth has remained comparatively high over time, which has been significantly caused by the large variance between Russian geographic regions and their differing levels of energy reserves.[50] For instance, the nation's Gini coefficient was 36 in 2020 in comparison to the value of 39.8 in 2021 within the United States.[51] Russia has the world's 5th-largest number of billionaires.[52]
Following the 2022 Russian invasion of Ukraine, the country has faced extensive sanctions and other negative financial actions from the Western world and its allies which have the aim of isolating the Russian economy from the Western financial system.[53] However, Russia's economy has shown resilience to such measures broadly, and has maintained economic stability and growth—driven primarily by high military expenditure,[54] household consumption, soaring wages,[55] low unemployment,[13] and government expenditure.[56] Yet, experts predict the sanctions will have a long-term negative effect on the Russian economy.[57]
History
The Russian economy has been volatile over the past multiple decades. After 1989, its institutional environment was transformed from a command economy based upon socialist organizations to a capitalistic system. Its industrial structure dramatically shifted away over the course of several years from heavy investment in manufacturing as well as in traditional Soviet agriculture towards free market related developments in natural gas and oil extraction in additional to businesses exploring mining. A service economy also expanded during this time. The academic analyst Richard Connolly has argued that, over the last four centuries in a broad sense, there were four main characteristics of the Russian economy that have shaped the system and persisted despite the political upheavals. First of all the weakness of the legal system means that impartial courts do not rule and contracts are problematic. Second is the underdevelopment of modern economic activities, with very basic peasant agriculture dominant into the 1930s. Third is technological underdevelopment, eased somewhat by borrowing from the West in the 1920s. And fourth lower living standards compared to Western Europe and North America.[58]
Russian Empire
This article has multiple issues. Please help improve it or discuss these issues on the talk page. (Learn how and when to remove these template messages)
|
The economy of the Russian Empire covers the economic history of Russia from 1721 to the October Revolution of 1917 (which ushered in a period of civil war, culminating in the creation of the Soviet Union).
Russian national income per capita increased and moved to closer to the most developed economies of Northern and Western Europe from the late 17th century to the 1740s.[59] After the 1740s, the Russian economy stagnated and declined. In the 18th century, Russian national income per capita was about 40–70% of British per capita income but higher than Poland's.[59] By 1860, Russian GDP per capita was similar to that of Japan; one-third of GDP per capita in the United States or the United Kingdom; and twice that of China or India.[59] Russia was a late industrializer.[59]
Serfdom, which held back development of the wage labor market and created a shortage of labor for industry, was abolished in 1861.[59] In the aftermath, GDP per capita was volatile and did not substantially increase.[59] Steady economic growth began in the 1890s, alongside a structural transformation of the Russian economy.[59] By the time World War I started, more than half the Russian economy was still devoted to agriculture.[59][60] By the early 20th century, the Russian economy had fallen further behind the American and British economies.[59] From the late 19th century to the early 20th century, the economy grew at a similar pace as the Japanese economy and faster than the Brazilian, Indian and Chinese economies.[59]
Despite all this Russian Empire from the beginning of the reign of Nicholas II, it began to change dramatically in economic terms. It was the fastest growing economy in the world,[61] the average GDP growth was higher than the Western European one, and the volume of production per capita was equal to it.[62] The standard of living also grew high.[63]Soviet Union
Beginning in 1928, the course of the Soviet Union's economy was guided by a series of five-year plans. By the 1950s, the Soviet Union had rapidly evolved from a mainly agrarian society into a major industrial power.[64] By the 1970s the Soviet Union was in an Era of Stagnation. The complex demands of the modern economy and inflexible administration overwhelmed and constrained the central planners. The volume of decisions facing planners in Moscow became overwhelming. The cumbersome procedures for bureaucratic administration foreclosed the free communication and flexible response required at the enterprise level for dealing with worker alienation, innovation, customers, and suppliers.

From 1975 to 1985, corruption and data manipulation became common practice within the bureaucracy to report satisfied targets and quotas, thus entrenching the crisis. Starting in 1986, Mikhail Gorbachev attempted to address economic problems by moving towards a market-oriented socialist economy. Gorbachev's policies of Perestroika failed to rejuvenate the Soviet economy; instead, a process of political and economic disintegration culminated in the breakup of the Soviet Union in 1991.
Transition to market economy (1991–98)


Following the collapse of the Soviet Union, Russia underwent a radical transformation, moving from a centrally planned economy to a globally integrated market economy. Corrupt and haphazard privatization processes turned over major state-owned firms to politically connected "oligarchs", which has left equity ownership highly concentrated.
Yeltsin's program of radical, market-oriented reform came to be known as a "shock therapy". It was based on the policies associated with the Washington Consensus, recommendations of the IMF and a group of top American economists, including Larry Summers[65][66][67] who in 1994 urged for "the three '-ations'—privatization, stabilization, and liberalization" to be "completed as soon as possible."[68] With deep corruption afflicting the process, the result was disastrous, with real GDP falling by more than 40% by 1999, hyperinflation which wiped out personal savings, crime and destitution spreading rapidly.[69][70] The jump in prices from shock therapy wiped out the modest savings accumulated by Russians under socialism and resulted in a regressive redistribution of wealth in favour of elites who owned non-monetary assets.[71]
Shock therapy was accompanied by a drop in the standard of living, including surging economic inequality and poverty,[72] along with increased excess mortality[73][74][75] and a decline in life expectancy.[76] Russia suffered the largest peacetime rise in mortality ever experienced by an industrialized country.[77] Likewise, the consumption of meat decreased: in 1990, an average citizen of the RSFSR consumed 63 kg of meat a year; by 1999, it had decreased to 45 kg.[78]
The majority of state enterprises were privatized amid great controversy and subsequently came to be owned by insiders[79] for far less than they were worth.[66] For example, the director of a factory during the Soviet regime would often become the owner of the same enterprise. Under the government's cover, outrageous financial manipulations were performed that enriched a narrow group of individuals at key positions of business and government.[80] Many of them promptly invested their newfound wealth abroad, producing an enormous capital flight.[81] This rapid privatization of public assets, and the widespread corruption associated with it, became widely known throughout Russia as "prikhvatizatisiya," or "grab-itization."[82]
Difficulties in collecting government revenues amid the collapsing economy and dependence on short-term borrowing to finance budget deficits led to the 1998 Russian financial crisis.
In the 1990s, Russia was a major borrower from the International Monetary Fund, with loan facilities totalling $20 billion. The IMF was criticised for lending so much, as Russia introduced little of the reforms promised for the money and a large part of these funds could have been "diverted from their intended purpose and included in the flows of capital that left the country illegally".[83][84]
On 24 September 1993, at a meeting of the Commonwealth of Independent States (CIS) Council of Heads of State in Moscow, Azerbaijan, Armenia, Belarus, Kazakhstan, Kyrgyzstan, Moldova, Russia, Tajikistan, Uzbekistan signed the Treaty on the creation of an Economic Union which reinforces by an international agreement the intention to create an economic union through the step-by-step creation of a free trade area, a customs union and conditions for the free movement of goods, services, capital and labor. All these countries have ratified the Treaty and it entered into force on 14 January 1994. Turkmenistan[85] and Georgia joined in 1994 and ratified the Treaty, but Georgia withdrew in 2009.[86]
On 15 April 1994, at a meeting of the Commonwealth of Independent States (CIS) Council of Heads of State in Moscow, all 12 post-Soviet states signed the international Agreement on the Establishment of a Free Trade Area in order to move towards the creation of an economic union. Article 17 also confirmed the intention to conclude a free trade agreement in services.[87] Article 1 indicated that this was "the first stage of the creation of the Economic Union", but in 1999 the countries agreed to remove this phrase from the agreement.[88] Russia concluded bilateral free trade agreements with all CIS countries and did not switch to a multilateral free trade regime in 1999. Bilateral free trade agreements, except for Georgia, Azerbaijan and Turkmenistan[89][90] (all of these are in force as of 2024), ceased to apply only after 2012 with Russia's accession to the new multilateral CIS free trade area.
Further integration took place outside the legal framework of the CIS. Pursuant to the Treaty on the creation of an Economic Union, the Agreement on the Customs Union between the Russian Federation and the Republic of Belarus was signed on 6 January 1995 in Minsk.[91] The Government of the Republic of Belarus and the Government of the Russian Federation, on the one side, and the Government of the Republic of Kazakhstan, on the other side, signed an Agreement on the Customs Union in Moscow on 20 January 1995 in order to move towards the creation of an economic union as envisaged by the treaty.[92] The implementation of these agreements made it possible to launch the Customs Union of the Eurasian Economic Community in 2010. According to the database of international treaties of the Eurasian Economic Union, these agreements are still in force as of 2024 and apply in part not contrary to the Treaty on the Eurasian Economic Union.[93][94][95]
International agreements such as the following have further deepened trade and economic relations and integration with Belarus. The Community of Belarus and Russia was founded on 2 April 1996. The "Treaty on the Union between Belarus and Russia" was signed on 2 April 1997. And finally the Treaty on the Creation of a Union State of Russia and Belarus was signed on 8 December 1999.
Recovery and growth (1999–2008)

Russia recovered quickly from the August 1998 financial crash, partly because of a devaluation of the ruble, which made domestic producers more competitive nationally and internationally.
Between 2000 and 2002, significant pro-growth economic reforms included a comprehensive tax reform, which introduced a flat income tax of 13%; and a broad effort at deregulation which benefited small and medium-sized enterprises.[96]
Between 2000 and 2008, Russian economy got a major boost from rising commodity prices. GDP grew on average 7% per year.[69] Disposable incomes more than doubled and in dollar-denominated terms increased eightfold.[97] The volume of consumer credit between 2000 and 2006 increased 45 times, fuelling a boom in private consumption.[98][99] The number of people living below poverty line declined from 30% in 2000 to 14% in 2008.[100][101]
Russia repaid its borrowing of $3.3 billion from the IMF three years early in 2005.[102]
Inflation remained a problem however, as the central bank aggressively expanded money supply to combat appreciation of the ruble.[103] Nevertheless, in 2007 the World Bank declared that the Russian economy achieved "unprecedented macroeconomic stability".[104] Until October 2007, Russia maintained impressive fiscal discipline with budget surpluses every year from 2000.[96]
2009–14

Russian banks were affected by the 2007–2008 financial crisis, though no long term damage was done due to a proactive and timely response by the government and central bank.[105][106][107] A sharp, but brief recession in Russia was followed by a strong recovery beginning in late 2009.[69]
Between 2000 and 2012, Russia's energy exports fuelled a rapid growth in living standards, with real disposable income rising by 160%.[108] In dollar-denominated terms this amounted to a more than sevenfold increase in disposable incomes since 2000.[97] In the same period, unemployment and poverty more than halved and Russians' self-assessed life satisfaction also rose significantly.[109] This growth was a combined result of the 2000s commodities boom, high oil prices, as well as prudent economic and fiscal policies.[110] However, these gains have been distributed unevenly, as the 110 wealthiest individuals were found in a report by Credit Suisse to own 35% of all financial assets held by Russian households.[111][112] Russia also has the second-largest volume of illicit money outflows, having lost over $880 billion between 2002 and 2011 in this way.[113] Since 2008 Forbes has repeatedly named Moscow the "billionaire capital of the world".[114]
In July 2010, Russia, together with Belarus and Kazakhstan, became a founding member of the Customs Union of the Eurasian Economic Community (EurAsEC), and the EurAsEC Single Economic Space, a common market of the same countries, came into force on 1 January 2012, superseding the bilateral agreements on free trade. At the same time Russia's membership to the WTO was accepted in 2011.[115] Russia joined the World Trade Organization (WTO) on 22 August 2012 after 19 years of negotiations.[116][117][118] On 20 September 2012, the multi-lateral Free Trade Area of the Commonwealth of Independent States (CIS FTA) came into force for Russia and subsequently superseded previous bilateral agreements among 9 participating post-Soviet states.[119] In 2015, Russia became a founding member of the Eurasian Economic Union (EAEU), which replaced EurAsEC and envisaged a supranational economic union (the deepest stage of economic integration[120]).[121]
Rapid GDP and income growth continued until 2013. The most important topic of discussion in the economy for a decade was the middle-income trap. In 2013, the World Bank announced that Russia had graduated to a high-income economy based on the results of 2012[122][123][124] but in 2016 it was reclassified as an upper-middle income economy[125][126] due to changes in the exchange rate of the Russian ruble, which is a floating currency. While the UN Human Development Index, which assesses progress in the standard of living, health and education, ranks Russia among the 'very high human development' countries.[127][128]
Russian leaders repeatedly spoke of the need to diversify the economy away from its dependence on oil and gas and foster a high-technology sector.[129] In 2012 oil, gas and petroleum products accounted for over 70% of total exports.[130] This economic model appeared to show its limits, when after years of strong performance, the Russian economy expanded by a mere 1.3% in 2013.[69] Several reasons were proposed to explain the slowdown, including a prolonged recession in the EU, which is Russia's largest trading partner, stagnant oil prices, lack of spare industrial capacity and demographic problems.[131] Political turmoil in neighbouring Ukraine added to the uncertainty and suppressed investment.
2014–21
Following the annexation of Crimea in March 2014 and Russia's involvement in the ongoing War in Donbas, the United States, the European Union, Canada, and Japan imposed sanctions on Russia.[132] This led to the decline of the Russian ruble and sparked fears of a Russian financial crisis. Russia responded with sanctions against a number of countries, including a one-year period of total ban on food imports from the European Union and the United States.
According to the Russian economic ministry in July 2014, GDP growth in the first half of 2014 was 1%. The ministry projected growth of 0.5% for 2014.[133] The Russian economy grew by a better than expected 0.6% in 2014.[134] Russia is rated one of the most unequal of the world's major economies.[135]
As a result of the World Bank's designation of a high-income economy, Barack Obama issued a proclamation 9188: "I have determined that Russia is sufficiently advanced in economic development and improved in trade competitiveness that it is appropriate to terminate the designation of Russia as a beneficiary developing country effective October 3, 2014."[136] U.S. Customs and Border Protection (CBP) indicated that Russia formally graduated from the GSP program on 4 October 2014.[137]
As of 2015, real income was still lower for 99% of Russians than it was in 1991.[77]

The Russian economy risked going into recession from early 2014, mainly due to falling oil prices, sanctions, and the subsequent capital flight.[138] While in 2014 GDP growth remained positive at 0.6%,[139] in 2015 the Russian economy shrunk by 3.7% and was expected to shrink further in 2016.[140] By 2016, the Russian economy rebounded with 0.3% GDP growth and officially exited recession. The growth continued in 2017, with an increase of 1.5%.[141][142]
In January 2016, Bloomberg rated Russia's economy as the 12th most innovative in the world,[143] up from 14th in January 2015[144] and 18th in January 2014.[145] Russia has the world's 15th highest patent application rate, the 8th highest concentration of high-tech public companies, such as internet and aerospace and the third highest graduation rate of scientists and engineers.[143]
According to the British company BP (Statistical Yearbook 2018), proven oil reserves in Russia at the end of 2017 were 14.5 billion tonnes (14.3 billion long tons; 16.0 billion short tons), natural gas was 35 trillion cubic metres (1.2 quadrillion cubic feet).[146] Gold reserves in Russia's subsoil, according to the U.S. Geological Survey, were 5,500 tonnes (5,400 long tons; 6,100 short tons) at the end of 2017.[147]
In 2019, the Ministry of Natural Resources estimated the country's mineral reserves in physical terms. At the end of 2017, oil reserves were 9.04 billion tonnes (8.90 billion long tons; 9.96 billion short tons), gas reserves were 14.47 trillion cubic metres (511 trillion cubic feet), gold reserves were 1,407 tonnes (1,385 long tons; 1,551 short tons), and diamonds reserves were 375 million carats (75 tonnes). Then for the first time the Ministry evaluated the mineral reserves of Russia in terms of value. The value of oil reserves amounted to 39.6 trillion rubles, the value of gas amounted to 11.3 trillion rubles, coking coal amounted to almost 2 trillion rubles, iron ore amounted to 808 billion rubles, diamonds amounted to 505 billion rubles, gold amounted to 480 billion rubles. The combined value of all mineral and energy resources (oil, gas, gold, copper, iron ore, thermal and lignite coal, and diamonds) amounted to 55.24 trillion rubles (US$844 billion), or 60% of GDP for 2017. The assessment occurred after the adoption of a new classification of reserves in Russia and the object of the methodology was only those fields for which a license was issued, so the assessment of the Ministry of Natural Resources is less than the total volume of explored reserves. Experts criticized such "an unsuccessful attempt to estimate reserves," pointing out that "one should not take such an estimate seriously" and "the form contains an incorrect formula for calculating the value".[148][149]
2022–present

In 2022, heavy sanctions were enacted due to the Russian invasion of Ukraine which will likely result in a steep recession.[151] Since early 2022, many official economic statistics have not been published.[152] Sanctions also included asset freezes on the Russian Central Bank,[153] which holds $630 billion in foreign-exchange reserves,[154] to prevent it from offsetting the effects of sanctions.[155]
According to most estimates, every day of the war in Ukraine costs Russia $500 million to $1 billion.[156][157][158]
On 27 June 2022, Russia defaulted on part of its foreign currency, its first such default since 1918.[159]
In November 2022, it was reported that Russia had officially entered a recession as the Federal State Statistics Service had reported a national GDP loss for the second consecutive quarter.[160]
As part of the sanctions imposed on Russia, on 2 September 2022, the finance ministers of the G7 group agreed to cap the price of Russian oil and petroleum products, designed to allow Russia to maintain production, but limiting revenue from oil sales.[161][162]
In 2022, The Economist calculated that Russia did graduate into the category of high-income economies by 2022, if counted at purchasing power parity rather than the exchange rate but could fall below the threshold due to the invasion of Ukraine.[163] In December 2022, a study at Bank of Russia's Research and Forecasting Department, found that the import dependence of the Russian economy is relatively low, does not exceed the median for other countries, and the share of imports in most industries is lower than in other countries. The key explanation for this could be the low involvement of the Russian economy in global value supply chains and its focus on production of raw materials. However, 60% of Russia's imports come from the countries that have announced sanctions against Russia.[164]
TASS reported poor results for the Russian economy the first quarter of 2023 with revenue of 5.7 trillion roubles – down 21% (mainly due to falling oil revenue), expenditure 8.1 trillion roubles – up 34% (mainly due to increased military costs), creating a deficit 2.4 trillion roubles – ($29.4 billion)[165]
Following Central Bank of Russia interventions, the exchange rate of the rouble against the dollar remained relatively stable in 2022, although in 2023 it started to decrease significantly, reaching RUB 97 per USD 1 on 15 August 2023. Both the interventions and the exchange rate decrease resulted in significant criticism of the Central Bank by Russian state propaganda.[166] Quarter 2 of 2023 saw a 13% fall in the value of the rouble against the dollar and a current account surplus estimated in to be falling by 80% from the annual 2022 surplus of $233 billion.[167]
After 11 years of negotiations, on 8 June 2023, in Sochi, Armenia, Belarus, Kazakhstan, Kyrgyzstan, Russia, Tajikistan and Uzbekistan signed the Commonwealth of Independent States Agreement on Free Trade in Services, Establishment, Operations and Investment to partly integrate Uzbekistan and Tajikistan on the common standards of the WTO (General Agreement on Trade in Services) and the EAEU (some provisions were borrowed from EAEU law) even without their membership in the WTO (Uzbekistan) or the EAEU (Uzbekistan and Tajikistan).[168] The Treaty on the Eurasian Economic Union has preserved international agreements on trade in services in the sphere of national competence of the member states therefore, the EAEU is not a party to the agreement.
In August and September 2023, the Central Bank of Russia started raising the key lending rate, ending up at 13% in September, while USD to RUB exchange rate remained at RUB 95.[169] As of June 2023 share of Russia's exports to EU dropped to 1.7% while Russia's imports from EU dropped to 1.5%.[170] In October 2023 the "psychological barrier" of RUB 100 per USD 1 was crossed.[171] In July 2024 the Russian Central Bank raised the key interest rate to 18%.[172]
The 2024 budget expects revenues of 35 trillion rubles ($349 billion) with expenditure of 36.6 trillion, based on a Urals oil forecast of $71.30 per barrel, a 90.1 rubles to USD 1 exchange rate and inflation of 4.5%. Defence spending will double to 10.78 trillion, 29.4% of expenditure. Russia currently has a record low unemployment rate of just 3 percent,[173] due to a demographic decline, demands of the war for industrial and military manpower, and large scale emigration.
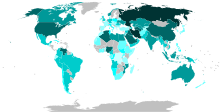
 Gross domestic product (PPP) per capita in April 2022
 Unemployment rate of Russia since the fall of the Soviet Union
 Russian inflation rate 2012–2022


Data
The following table shows the main economic indicators in 1980–2023.[174]
| Year | GDP (in billion. US$PPP) | GDP per capita (in US$ PPP) | GDP (in billion US$nominal) | GDP per capita (in US$ nominal) | GDP growth (real) | Inflation rate (in Per cent) | Unemployment (in Per cent) | Government debt (in % of GDP) |
|---|---|---|---|---|---|---|---|---|
| 1992 | 1,602.6 | 10,805.2 | 71.6 | 482.8 | n/a | n/a | 5.2% | n/a |
| 1993 | n/a | |||||||
| 1994 | n/a | |||||||
| 1995 | n/a | |||||||
| 1996 | n/a | |||||||
| 1997 | 51.5% | |||||||
| 1998 | ||||||||
| 1999 | ||||||||
| 2000 | ||||||||
| 2001 | ||||||||
| 2002 | ||||||||
| 2003 | ||||||||
| 2004 | ||||||||
| 2005 | ||||||||
| 2006 | ||||||||
| 2007 | ||||||||
| 2008 | ||||||||
| 2009 | ||||||||
| 2010 | ||||||||
| 2011 | ||||||||
| 2012 | ||||||||
| 2013 | ||||||||
| 2014 | ||||||||
| 2015 | ||||||||
| 2016 | ||||||||
| 2017 | ||||||||
| 2018 | ||||||||
| 2019 | ||||||||
| 2020 | ||||||||
| 2021 | ||||||||
| 2022 | ||||||||
| 2023 |
Income inequality
In Russia, areas where income is higher have increased air pollution. However while income may have been higher in these regions a greater disparity in income inequality was found. It was discovered that "greater income inequality within a region is associated with more pollution, implying that it is not only the level of income that matters but also its distribution".[175] In Russia areas lacking in hospital beds suffer from greater air pollution than areas with higher numbers of beds per capita which implies that the poor or inadequate distribution of public services also may add to the environmental inequality of that region.[175]
Currency and monetary policy
The currency of the Russian Federation is the Russian ruble.
The currency exchange rate is floating. The Central Bank of the Russian Federation follows inflation targeting policy. Higher inflation than in developed countries has remained throughout the last 25–30 post-Soviet years and the devaluation of the currency (in relation to foreign currencies and in relation to domestic goods) is significantly compensated by higher interest rates and an increase in nominal incomes and assets. This situation is typical for developing markets. Typically devaluations of the ruble relative to foreign currency strongly stimulate the export-oriented economy of Russia.
Ruble's Real Effective Exchange Rate remains in 2022–23 higher than in 1996 and 1998[176] when the sharp devaluations happened relative to the foreign currency.
Public policy
Federal, regional and municipal budgets
Fiscal policy
Russia was expected to have a Government Budget deficit of $21 billion in 2016.[177] The budget deficit narrowed to 0.6% of GDP in 2017 from 2.8% in 2016.[178]
Debts
Russia is a creditor nation and has a positive net international investment position (NIMP). Russia has one of the lowest government debts (total external and domestic) and lowest external debts (total public and private) among major economies.[179][180][181][182]
In 2022, domestic government debt increased by 13.9 percent to 18.78 billion rubles.[183] Russia Domestic government Debt data was reported at RUB 19,801.921 billion in May 2023.[184]
In 2022, the share of external debt to GDP was 17%, decreasing from 26.3% in 2021.[181][185] Russia's external debt was estimated at 381.8 billion U.S. dollars as of 1 January 2023, down 20.8 percent from the previous year.[186] Russia External Debt reached USD 357.9 billion in March 2023, compared with USD 380.5 billion in the previous quarter.[187]
National wealth fund
On 1 January 2004, the Government of Russia established the Stabilization fund of the Russian Federation as part of the federal budget to balance it if price of oil falls. On 1 February 2008, the Stabilization fund was divided into two parts. The first is a reserve fund equal to 10% of GDP and was to be invested in a similar way as the Stabilization Fund. The second is the National Welfare Fund of the Russian Federation to be invested in more risky instruments, including some shares in domestic and foreign companies. The Reserve fund which started with $125 billion was exhausted by 2017 and discontinued. The National Wealth Fund had started with $32 billion in 2008 and by August 2022, peaked at $201 billion.[188] December 2023 saw it fall to $133 billion with liquid assets also down at $56 billion.[189]
Corruption

Russia was the lowest rated European country in Transparency International's Corruption Perceptions Index for 2020; ranking 129th out of 180 countries.[190] Corruption is perceived as a significant problem in Russia,[191] affecting various aspects of life, including the economy,[192] business,[193] public administration,[194][195] law enforcement,[196] healthcare,[197] and education.[198] The phenomenon of corruption is strongly established in the historical model of public governance in Russia and attributed to general weakness of rule of law in Russia.[199] As of 2020, the percentage of business owners who distrust law enforcement agencies rose to 70% (from 45% in 2017); 75% don't believe in impartiality of courts and 79% do not believe that legal institutions protect them from abuse of law such as racketeering or arrest on dubious grounds.[200]
Sectors
Primary
Energy


The mineral-packed Ural Mountains and the vast fossil fuel (oil, gas, coal), and timber reserves of Siberia and the Russian Far East make Russia rich in natural resources, which dominate Russian exports. Oil and gas exports, specifically, continue to be the main source of hard currency.
Russia has been widely described as an energy superpower;[34] as it has the world's largest natural gas reserves,[35] the second-largest coal reserves,[36] the eighth-largest oil reserves,[37] and the largest oil shale reserves in Europe.[38] It is the world's leading natural gas exporter,[39] the second-largest natural gas producer,[40] the second-largest oil exporter[41] and producer,[42] and the third largest coal exporter.[43] Fossil fuels cause most of the greenhouse gas emissions by Russia.[201] The country is the world's fourth-largest electricity producer,[202] and the ninth-largest renewable energy producer in 2019.[203] Russia was also the world's first country to develop civilian nuclear power, and built the world's first nuclear power plant.[204] In 2019, It was the world's fourth-largest nuclear energy producer.[205] After the collapse of the Soviet Union, the Russian state nuclear conglomerate Rosatom became the dominant actor in international nuclear power markets, training experts, constructing nuclear power plants, supplying fuel and taking care of spent fuel in around the world.[206] Whereas oil and gas were subject to international sanctions after Russia's full-scale invasion of Ukraine in February 2023, its nuclear industry was not targeted by sanctions.[206]
In the mid-2000s, the share of the oil and gas sector in GDP was around 20%, and in 2013 it was 20–21% of GDP.[207] The share of oil and gas in Russia's exports (about 50%) and federal budget revenues (about 50%) is large, and the dynamics of Russia's GDP are highly dependent on oil and gas prices,[208] but the share in GDP is much less than 50%. According to the first such comprehensive assessment published by the Russian statistics agency Rosstat in 2021, the maximum total share of the oil and gas sector in Russia's GDP, including extraction, refining, transport, sale of oil and gas, all goods and services used, and all supporting activities, amounts to 16.9% in 2017, 21.1% in 2018, 19.2% in 2019 and 15.2% in 2020. To compare the data obtained using the same methodology, the source provides data for other countries. This is more than the share of GDP in the United States (8%) and Canada (less 10%). This is comparable to the share of GDP in Norway (14%) and Kazakhstan (13.3%). It is much lower than the share of GDP in the United Arab Emirates (30%) and Saudi Arabia (50%). This assessment did not include, for example, the production of used pumps or specialized education, which should have been included, according to experts.[209][210][211][212][213] Russia consumes domestically two-thirds of its gas production and a quarter of its oil production while it sells three-quarters of its oil on the world market and Russia's share of the traded world oil market is 17.5% - more than Saudi Arabia's.[214][215] At the same time, experts note that there are formal and informal part of the rent and the total oil and gas rent in 2023 can be estimated at 24% of Russia's GDP. Michael Alexeyev (son of Lyudmila Alexeyeva), a professor of economics at Indiana University, notes that the oil and gas taxes reported by the government do not include corporate dividends and the so-called indirect or additional revenues derived from the expenditure of oil and gas rents in the economy.[216] There is also such an indicator as the oil rent (% of GDP), which is published by the World Bank. It is 9.7% for Russia, 14.8% for Kazakhstan, 6.1% for Norway, 23.7% for Saudi Arabia, 15.7% for the United Arab Emirates, 2.8% for Canada and 0.6% for the United States.[217]
2023 saw a fall in Russia's oil and gas tax revenues of 24% to 8.8 trillion roubles ($99.4 billion) compared to 2022.[218]
Mining
Russia is also a leading producer and exporter of minerals and gold. Russia is the largest diamond-producing nation in the world, estimated to produce over 33 million carats in 2013, or 25% of global output valued at over $3.4 billion, with state-owned ALROSA accounting for approximately 95% of all Russian production.[219]
In 2019, the country was the 3rd world producer of gold;[220] 2nd worldwide producer of platinum;[221] 4th worldwide producer of silver;[222] 9th largest world producer of copper;[223] 3rd largest world producer of nickel;[224] 6th largest world producer of lead;[225] 9th largest world producer of bauxite;[226] 10th largest world producer of zinc;[227] 2nd worldwide producer of vanadium;[228] 2nd largest world producer of cobalt;[229] 5th largest world producer of iron ore;[230] 7th largest world producer of boron;[231] 9th largest world producer of molybdenum;[232] 13th largest world producer of tin;[233] 3rd largest world producer of sulfur;[234] 4th largest world producer of phosphate;[235] 8th largest world producer of gypsum;[236] in addition to being the world's 10th largest producer of salt.[237] It was the world's 6th largest producer of uranium in 2018.[238]
Agriculture

Russia's agriculture sector contributes about 5% of the country's total GDP, although the sector employs about one-eighth of the total labour force.[239] It has the world's third-largest cultivated area, at 1,265,267 square kilometres (488,522 sq mi). However, due to the harshness of its environment, about 13.1% of its land is agricultural,[1] and only 7.4% of its land is arable.[240] The main product of Russian farming has always been grain, which occupies considerably more than half of the cropland.[239] Russia is the world's largest exporter of wheat,[241] and is the largest producer of barley,[242] buckwheat, oats,[243] and rye,[244] and the second-largest producer of sunflower seed.[245] Various analysts of climate change adaptation foresee large opportunities for Russian agriculture during the rest of the 21st century as arability increases in Siberia, which would lead to both internal and external migration to the region.[246]
More than one-third of the sown area is devoted to fodder crops, and the remaining farmland is devoted to industrial crops, vegetables, and fruits.[239] Owing to its large coastline along three oceans, Russia maintains one of the world's largest fishing fleets, ranking sixth in the world in tonnage of fish caught; capturing 4.77 million tonnes (4.69 million long tons; 5.26 million short tons) of fish in 2018.[247] It is also home to the world's finest caviar (the beluga), and produces about one-third of all canned fish, and some one-fourth of the world's total fresh and frozen fish.[239]
Industry

Defence industry


The defence industry of Russia is a strategically important sector and a large employer in the country. Russia has a large and sophisticated arms industry, capable of designing and manufacturing high-tech military equipment, including a fifth-generation fighter jet, nuclear powered submarines, firearms, and short range/long range ballistic missiles. It is the world's second-largest exporter of arms, behind only the United States.[1]
Aerospace

Aircraft manufacturing is an important industry sector in Russia, employing around 355,300 people. The Russian aircraft industry offers a portfolio of internationally competitive military aircraft such as MiG-29 and Su-30, while new projects such as the Sukhoi Superjet 100 are hoped to revive the fortunes of the civilian aircraft segment. In 2009, companies belonging to the United Aircraft Corporation delivered 95 new fixed-wing aircraft to its customers, including 15 civilian models. In addition, the industry produced over 141 helicopters. It is one of the most science-intensive hi-tech sectors and employs the largest number of skilled personnel. The production and value of the military aircraft branch far outstrips other defence industry sectors, and aircraft products make up more than half of the country's arms exports.[248]
The Space industry of Russia consists of over 100 companies and employs 250,000 people.[249]
Automotive industry

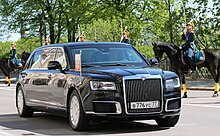
Automotive production is a significant industry in Russia, directly employing around 600,000 people or 1% of the country's total workforce. Russia produced 1,767,674 vehicles in 2018, ranking 13th among car-producing nations in 2018, and accounting for 1.8% of the worldwide production.[250] Following the 2022 sanctions and the withdrawal of Western manufacturers the production dropped to 450,000 passenger cars in 2022, the lowest level since the dissolution of the Soviet Union in 1991.[251] The main local brands are light vehicle producers AvtoVAZ and GAZ, while KamAZ is the leading heavy vehicle producer. In December 2022 the only foreign car manufacturers are eleven Chinese carmakers that have production operations or are constructing their plants in Russia.[252]
Electronics
Russia was experiencing a regrowth of microelectronics, with the revival of JCS Mikron until sanctions took effect in 2022.[253][254][255]
Services
Retail
As of 2013, Russians spent 60% of their pre-tax income on shopping, the highest percentage in Europe. This is possible because many Russians pay no rent or house payments, owning their own home after privatization of state-owned Soviet housing. Shopping malls were popular with international investors and shoppers from the emerging middle class. Russia had over 1,000 shopping malls in 2020, although in 2022, many international companies left Russia resulting in empty stores in malls.[256] A supermarket selling groceries is a typical anchor store in a Russian mall.[257]
Retail sales in Russia[258]
| Year | 2009 | 2010 | 2011 | 2012 | 2013 | 2014 | 2015 | 2016 | 2017 | 2018 | 2019 | 2020 | 2021 | 2022 |
|---|---|---|---|---|---|---|---|---|---|---|---|---|---|---|
| Total retail sales (RUB trillions) | 14.60 | 16.49 | 19.08 | 21.3 | 23.7 | 26.4 | 27.6 | 29.75 | 27.88 | 31.58 | 33.62 | 33.56 | 39.47 | 42.51 |
Telecommunications
Russia's telecommunications industry is growing in size and maturity. As of December 2007, there were an estimated 4,900,000 broadband lines in Russia.[259]
As of 2020[update], 122,488,468 Russians (85% of the country's total population) were Internet users.[260]
There are four national mobile phone networks, MegaFon, Tele2, Beeline and MTS with total subscriptions between 2011 and 2021 ranging between 200 and 240 million.[261]
Transportation

Railway transport in Russia is mostly under the control of the state-run Russian Railways.[262] The total length of common-used railway tracks is the world's third-longest, and exceeds 87,157 km (54,157 mi).[263] As of 2016[update], Russia has 1,452.2 thousand km of roads,[264] and its road density is among the world's lowest.[265] Russia's inland waterways are the world's second-longest, and total 102,000 km (63,380 mi).[266] Among Russia's 1,218 airports,[267] the busiest is Sheremetyevo International Airport in Moscow.[268]
Russia's largest port is the Port of Novorossiysk in Krasnodar Krai along the Black Sea.[269] Russia is the world's sole country to operate nuclear-powered icebreakers, which advance the economic exploitation of the Arctic continental shelf of Russia, and the development of sea trade through the Northern Sea Route.[270]
Construction

In 2022, construction was worth 13 trillion rubles, 5% more than in 2021. Residential construction in 2022 reached 126.7 million square metres (1,364 million square feet).[271]
The 2020–2030 target for construction is 1 billion square metres (1.1×10¹⁰ square feet) of housing, 20% of all housing stock to be renovated and to increase space from 27.8 square metres (299 sq ft) up to 33.3 square metres (358 sq ft) per person.[271]
Insurance
According to the Central Bank of Russia 422 insurance companies operate on the Russian insurance market by the end of 2013. The concentration of insurance business is significant across all major segments except compulsory motor third party liability market (CMTPL) [ru], as the top 10 companies in 2013 charged 58.1% premiums in total without compulsory health insurance (CHI).[272] Russian insurance market in 2013 demonstrated quite significant rate of growth in operations. Total amount of premiums charged (without CHI) in 2013 is RUB 904.9 bln (increase on 11.8% compared to 2012), total amount of claims paid is RUB 420.8 bln (increase on 13.9% compared to 2012). Premiums to GDP ratio (total without CHI) in 2013 increased to 1.36% compared to 1.31 a year before. The share of premiums in household spending increased to 1.39%. Level of claims paid on the market total without CHI is 46.5%, an insufficient increase compared to 2012. The number of policies in 2013 increased on 0.1% compared to 2012, to 139.6 mln policies.
Although relative indicators of the Russian insurance market returned to pre-crisis levels, the progress is achieved mainly by the increase of life insurance and accident insurance, the input of these two market segments in premium growth in 2013 largely exceeds their share on the market. As before, life insurance and accident insurance are often used by banks as an appendix to a credit contract protecting creditors from the risk of credit default in case of borrower's death or disability. The rise of these lines is connected, evidently, with the increase in consumer loans, as the total sum of credit obligations of population in 2013 increased by 28% to RUB 9.9 trillion. At the same time premium to GDP ratio net of life and accident insurance remained at the same level of 1.1% as in 2012. Thus, if "banking" lines of business are excluded, Russian insurance market is in stagnation stage for the last four years, as premiums to GDP ratio net of life and accident insurance remains at the same level of 1.1% since 2010.[273]
Information technology
The IT market is one of the most dynamic sectors of the Russian economy. Russian software exports have risen from just $120 million in 2000 to $3.3 billion in 2010.[275] Since the year 2000 the IT market has started growth rates of 30–40% a year, growing by 54% in 2006 alone. The biggest sector in terms of revenue is system and network integration, which accounts for 28.3% of the total market revenues.[276] Meanwhile, the fastest growing segment of the IT market is offshore programming.

The government has launched a program promoting construction of IT-oriented technology parks (Technoparks)—special zones that have an established infrastructure and enjoy a favorable tax and customs regime, in seven different locations: Moscow, Novosibirsk, Nizhny Novgorod, Kaluga, Tumen, Republic of Tatarstan and St. Peterburg Region.[275]
Under a government decree signed in June 2013, a special "roadmap" is expected to ease business suppliers' access to the procurement programs of state-owned infrastructure monopolies, including such large ones as Gazprom, Rosneft, Russian Railways, Rosatom, and Transneft. These companies will be expected to increase the proportion of domestic technology solutions they use in their operations. The decree puts special emphasis on purchases of innovation products and technologies. According to the new decree, by 2015, government-connected companies must double their purchases of Russian technology solutions compared to the 2013 level and their purchasing levels must quadruple by 2018.[277]
Russia is one of the few countries in the world with a homegrown internet search engine with a significant marketshare as the Russian-based search engine Yandex is used by 53.8% of internet users in the country.[278][279][280]
Known Russian IT companies are ABBYY (FineReader OCR system and Lingvo dictionaries), Kaspersky Lab (Kaspersky Anti-Virus, Kaspersky Internet Security), Mail.Ru (portal, search engine, mail service, Mail.ru Agent messenger, ICQ, Odnoklassniki social network, online media sources).
Tourism

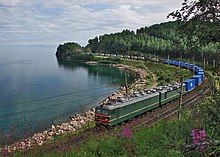
According to a UNWTO report, Russia is the sixteenth-most visited country in the world, and the tenth-most visited country in Europe, as of 2018, with 24.6 million visits.[281] Russia is ranked 39th in the Travel and Tourism Competitiveness Report 2019.[282] According to Federal Agency for Tourism, the number of inbound trips of foreign citizens to Russia amounted to 24.4 million in 2019.[283] Russia's international tourism receipts in 2018 amounted to $11.6 billion.[281] In 2020, tourism accounted for about 4% of country's GDP.[284] Major tourist routes in Russia include a journey around the Golden Ring theme route of ancient cities, cruises on the big rivers like the Volga, and journeys on the famous Trans-Siberian Railway.[285] Russia's most visited and popular landmarks include Red Square, the Peterhof Palace, the Kazan Kremlin, the Trinity Lavra of St. Sergius and Lake Baikal.[286]
Economic integration
Russia joined the World Trade Organization (WTO) on 22 August 2012.[116]On 20 September 2012, the Free Trade Agreement of the Commonwealth of Independent States signed on 18 October 2011 came into force (CIS FTA) for Russia and superseded previous agreements.[119] Russia is a founding member of the Eurasian Economic Union (EAEU) and is party to EAEU trade agreements with Vietnam, Iran, Singapore, and Serbia. In 2018, the EAEU signed a trade cooperation agreement with China, and it is in trade negotiations with India, Israel, and Egypt. Russia is also a party to several agreements that predate the EAEU.[287] The EAEU Treaty in 2015 superseded previous integration agreements and envisaged an economic union (the deepest stage of economic integration[120]). The EAEU provides for free movement of goods, services, capital and labour without a work permit ("four economic freedoms" as in the European Union), pursues coordinated, harmonized and single policy in the sectors determined by the Treaty and international agreements within the Union. The EAEU has a Eurasian Customs Union and an integrated single market of 183 million people.[121]
External trade and investment

Trade
Russia recorded a trade surplus of US$15.8 billion in 2013.[289] Balance of trade in Russia is reported by the Central Bank of Russia. Historically, from 1997 until 2013, Russia balance of trade averaged US$8.338billion reaching an all-time high of US$20.647 billion in December 2011 and a record low of −185 US$ million in February 1998. Russia runs regular trade surpluses primarily due to exports of commodities.
In 2015, Russia main exports are oil and natural gas (62.8% of total exports), ores and metals (5.9%), chemical products (5.8%), machinery and transport equipment (5.4%) and food (4.7%). Others include: agricultural raw materials (2.2%) and textiles (0.2%).[290]
Russia top exports in 2021 were: Crude oil $110.9b, Processed oil $69.9b, gold $17.3b, coal $15.4b and natural gas $7.3b.[291]
Russia top imports in 2021 were: Transmission equipment $10.7b, medication $7.3b, tankers $3.7b, parts and accessories for data processing 3.7b and storage units $3.3b.[291]
Foreign trade of Russia – Russian export and import[291]
| Year | 2005 | 2006 | 2007 | 2008 | 2009 | 2010 | 2011 | 2012 | 2013 | 2014 | 2015 | 2016 | 2017 | 2018 | 2019 | 2020 | 2021 |
|---|---|---|---|---|---|---|---|---|---|---|---|---|---|---|---|---|---|
| Export (US$ Billions) | 241 | 302 | 352 | 468 | 302 | 397 | 517 | 525 | 527 | 498 | 344 | 302 | 379 | 451 | 427 | 337 | 492 |
| Import (US$ Billions) | 99 | 138 | 200 | 267 | 171 | 229 | 306 | 316 | 315 | 287 | 183 | 207 | 260 | 240 | 247 | 231 | 293 |
| Top Trading Partners for Russia for 2021[291] |
|---|

2013–
In 2017, Russian Federation's commercial services' shares of total exports and imports were 13.9% and 26.8%, respectively. Russian Federation had a trade-to-GDP ratio of 46.6% in 2017.[292] In 2013–2017, Russia had a trade surplus for goods, and a trade deficit for services. Since trade in goods is larger than trade in services, Russia had a significant trade surplus.[293] Trade is relatively important to the Russian economy: the ratio of Russia's goods trade (exports plus imports) to GDP has averaged about 40% in recent years, compared to 20% for the United States. In 2021, Russia ranked 13th among world goods exporters and 22nd among importers. According to Russian official sources, its goods exportstotaled $492 billion in 2021, up 46% from 2020 (not adjusting for inflation). Minerals, including oil and gas, accounted for almost 45% of these exports. Goods imports increased 27% to $294 billion in 2021. Machinery and mechanical appliances was the top import category,accounting for almost a third of Russia's goods imports. In services trade, Russia ranked 26th among world exportersand 19th among importers in 2020, the most recent year for which there is data. It was a net services importer, exporting$49 billion worth of services and importing $76 billion.[287]
According to the World Bank, imports of goods and services occupied 21.3% of the Russian gross domestic product (GDP) in 2021[294] and exports of goods and services occupied 30.9% of Russia's GDP.[295] Russia has trade-to-GDP ratio (trade openness) 49.26%[296]which is lower than an average of the countries. In December 2022 in a study an economist at the Bank of Russia's Research and Forecasting Department, finds that the import dependence of the Russian economy is relatively low, does not exceed the median for other countries and the share of imports in most industries is lower than in other countries. The key explanation for this could be the low involvement of the Russian economy in global value supply chains and its focus on production of raw materials. However, 60% of Russia's imports come from the countries that have announced sanctions against Russia.[164]
Mergers and acquisitions
Between 1985 and 2018, almost 28,500 mergers or acquisitions have been announced in Russia. This cumulates to an overall value of around USD 984 billion which translates to RUB 5.456 billion. In terms of value, 2007 has been the most active year with USD 158 billion, whereas the number of deals peaked in 2010 with 3,684 (964 compared to the value record year 2007). Since 2010 value and numbers have decreased constantly and another wave of M&A is expected.[297]
The majority of deals in, into or out of Russia have taken place in the financial sector (29%), followed by banks (8.6%), oil and gas (7.8%), and Metals and Mining (7.2%).
Here is a list of the top deals with Russian companies participating ranked by deal value in million USD:
| Date Announced | Acquiror Name | Acquiror Mid Industry | Acquiror Nation | Target Name | Target Mid Industry | Target Nation | Value of Transaction ($mil) |
|---|---|---|---|---|---|---|---|
| 22 October 2012 | Rosneft Oil Co | Oil & gas | Russian Fed | TNK-BP Ltd | Oil & gas | Russian Fed | 27854.12 |
| 24 July 2012 | Rosneft Oil Co | Oil & gas | Russian Fed | TNK-BP Ltd | Oil & gas | Russian Fed | 26061.15 |
| 22 April 2003 | Yukosneftegaz | Oil & gas | Russian Fed | Sibirskaia Neftianaia Co | Oil & gas | Russian Fed | 13615.23 |
| 28 September 2005 | Gazprom | Oil & gas | Russian Fed | Sibneft | Oil & gas | Russian Fed | 13101.08 |
| 13 April 2005 | Shareholders | Other financials | Russian Fed | Polyus | Metals & mining | Russian Fed | 12867.39 |
| 16 December 2010 | MMC Norilsk Nickel PJSC | Metals & mining | Russian Fed | MMC Norilsk Nickel PJSC | Metals & mining | Russian Fed | 12800 |
| 27 July 2007 | Shareholders | Other financials | Russian Fed | HydroOGK | Power | Russian Fed | 12381.83 |
| 10 December 2016 | QHG Shares Pte Ltd | Other financials | Singapore | Rosneft Oil Co | Oil & gas | Russian Fed | |
| 30 June 2010 | KazakhGold Group Ltd | Metals & mining | Kazakhstan | Polyus Zoloto | Metals & mining | Russian Fed | 10261.33 |
| 5 August 2008 | Vladimir Potanin | Other financials | Russian Fed | MMC Norilsk Nickel PJSC | Metals & mining | Russian Fed | 10021.11 |
The majority of the top 10 deals are within the Russian oil and gas sector, followed by metals and mining.
See also
- History of Russia (1991–present)
- Federal government of Russia
- Список компаний России
- Список федеральных округов России по ВВП
- Монотаун — город, в экономике которого доминирует одна отрасль или компания. Этот термин иногда используется в отношении некоторых городов России.
- Политика России
- Налогообложение в России
- Виды юридических лиц в России
- Унитарное предприятие — государственная корпорация в России и некоторых других постсоветских государствах.
- Список субъектов РФ по ВВП на душу населения
Ссылки
- ^ Перейти обратно: а б с д "Россия" . ЦРУ.gov . Центральное разведывательное управление . Архивировано из оригинала 9 января 2021 года . Проверено 30 мая 2023 г.
- ^ «База данных «Перспективы мировой экономики», апрель 2019 г.» . МВФ.org . Международный валютный фонд . Архивировано из оригинала 22 декабря 2019 года . Проверено 29 сентября 2019 г.
- ^ «Страновые и кредитные группы Всемирного банка» . datahelpdesk.worldbank.org . Всемирный банк . Архивировано из оригинала 28 октября 2019 года . Проверено 1 июля 2024 г.
- ↑ Не считая 2 482 450 человек, проживающих в аннексированном Крыму. Том 1. Численность и размещение населения . Федеральная служба государственной статистики России (на русском языке). Архивировано из оригинала 24 января 2020 года . Проверено 3 сентября 2022 г.
- ^ Перейти обратно: а б с д и ж г «База данных «Перспективы мировой экономики: апрель 2024 г.» . МВФ.org . Международный валютный фонд .
- ^ Перейти обратно: а б «Центральное разведывательное управление» . Cia.gov. Архивировано из оригинала 9 января 2021 года . Проверено 5 апреля 2015 г.
- ^ «Коэффициент бедности при национальной черте бедности (% населения) – Российская Федерация» . data.worldbank.org . Всемирный банк. Архивировано из оригинала 1 ноября 2020 года . Проверено 21 марта 2020 г.
- ^ «Индекс Джини (оценка Всемирного банка) – Российская Федерация» . data.worldbank.org . Всемирный банк. Архивировано из оригинала 13 мая 2020 года . Проверено 28 октября 2020 г.
- ^ «Индекс человеческого развития (ИЧР)» . hdr.undp.org . HDRO (Отдел по составлению докладов о человеческом развитии) Программа развития Организации Объединенных Наций . Архивировано из оригинала 15 декабря 2019 года . Проверено 12 ноября 2022 г.
- ^ «ИЧР, скорректированный с учетом неравенства (ИЧРН)» . hdr.undp.org . ПРООН . Архивировано из оригинала 25 июня 2016 года . Проверено 12 ноября 2022 г.
- ^ «Рабочая сила, всего – Россия» . Всемирный банк и МОТ . Архивировано из оригинала 28 марта 2023 года . Проверено 22 сентября 2020 г.
- ^ «Соотношение занятости и численности населения, 15+, всего (%) (национальная оценка) – Россия» . Всемирный банк. Архивировано из оригинала 25 января 2023 года . Проверено 29 сентября 2019 г.
- ^ Перейти обратно: а б Костный мозг, Александр; Корсунская, Дарья (5 июня 2024 г.). «Рост зарплат и рекордно низкий уровень безработицы подчеркивают нехватку рабочей силы в России» . Рейтер . Проверено 4 августа 2024 г.
Уровень безработицы в России упал до рекордно низкого уровня в 2,6% в апреле, а реальная заработная плата взлетела в марте, как показали данные, опубликованные Федеральной службой статистики в среду, подчеркивающие степень напряженности российского рынка труда.
- ^ Перейти обратно: а б «Данные об общем объеме импорта и экспорта России (2010–2021 гг.)» . www.trendeconomy.com . 14 ноября 2022 года. Архивировано из оригинала 25 января 2023 года . Проверено 25 января 2023 г.
- ^ «Экспортные партнёры России» . Обсерватория экономической сложности . Проверено 11 мая 2024 г.
- ^ «Импортные партнёры России» . Обсерватория экономической сложности . Проверено 11 мая 2024 г.
- ^ Перейти обратно: а б «ЮНКТАД 2022» (PDF) . ЮНКТАД . Архивировано (PDF) из оригинала 12 декабря 2022 года . Проверено 6 января 2022 г.
- ^ Перейти обратно: а б с д и ж г «Отчет по избранным странам и субъектам: октябрь 2022 г.» . imf.org . Международный валютный фонд . Архивировано из оригинала 25 января 2023 года . Проверено 25 января 2023 г.
- ^ «Внешний долг | Экономические показатели | CEIC» . www.ceicdata.com . Архивировано из оригинала 10 февраля 2023 года . Проверено 25 января 2023 г.
- ^ Корсунская, Дарья; Марроу, Александр (17 февраля 2023 г.). «Россия поддерживает план дефицита бюджета в размере 2% ВВП после огромного дефицита в январе» . Рейтер . Архивировано из оригинала 27 февраля 2023 года . Проверено 27 февраля 2023 г.
- ^ «Рейтинговый список суверенов» . Standardandpoors.com . Стандарт энд Пурс. Архивировано из оригинала 24 сентября 2015 года . Проверено 19 марта 2015 г.
- ^ «Россия на пороге выхода из мусора, поскольку прогноз S&P становится позитивным» . Bloomberg.com . Bloomberg LP 17 марта 2017 г. Архивировано из оригинала 31 августа 2020 г. . Проверено 24 апреля 2017 г. .
- ^ "Moody's изменило прогноз по рейтингу государственных облигаций России Ba1 с негативного на стабильный" . Муди . 17 февраля 2017 года. Архивировано из оригинала 18 февраля 2017 года . Проверено 24 апреля 2017 г. .
- ^ «Fitch повысило прогноз по России до «Стабильного» в отношении мер политики» . Блумберг . 14 октября 2016 г. Архивировано из оригинала 8 ноября 2020 г. . Проверено 24 апреля 2017 г. .
- ^ «Международные резервы Российской Федерации (Конец периода)» . Центральный Банк России . Архивировано из оригинала 12 ноября 2020 года . Проверено 13 января 2023 г.
- ^ «Страновые и кредитные группы Всемирного банка – Служба поддержки данных Всемирного банка» . datahelpdesk.worldbank.org . Проверено 1 июля 2024 г.
- ^ «Промышленные страны» . Оксфордский справочник . Издательство Оксфордского университета . Проверено 3 августа 2024 г.
...и страны бывшего Советского Союза, а также Центральной и Восточной Европы, некоторые из которых, включая Россию и Чехию, являются высокоиндустриальными.
- ^ —Роузфилд, Стивен и Наталья Венникова. «Бюджетный федерализм в России: критика предложений ОЭСР». Кембриджский экономический журнал , том 28, № 2, Oxford University Press , 2004, стр. 307–18, JSTOR 23602130 .
— Робинсон, Нил. «Август 1998 года и развитие посткоммунистической политической экономии России». Обзор международной политической экономии , том 16, № 3, Taylor & Francisco , Ltd., 2009, стр. 433–55, JSTOR 27756169 .
—Чарап, Самуэль. «Пока нет некрологов капитализму в России». Текущая история , т. 108, № 720, University of California Press , 2009, стр. 333–38, JSTOR 45319724 .
—Ратленд, Питер. «Неолиберализм и переходный период в России». Обзор международной политической экономии , том 20, № 2, Taylor & Francisco , Ltd., 2013, стр. 332–62, JSTOR 42003296 .
— Ковалев, Александр и Александр Сокалев. «Россия: на пути к рыночной экономике». New Zealand International Review , т. 18, № 1, Новозеландский институт международных отношений, 1993, стр. 18–21, JSTOR 45234200 .
—Чинкота, Майкл Р. «Переход России к рыночной экономике: изучение бизнеса». Журнал международного маркетинга , том 5, № 4, Американская ассоциация маркетинга , 1997, стр. 73–93, JSTOR 25048706 . - ^ «ВВП, ППС (текущие международные доллары)» . Всемирный банк . Группа Всемирного банка . Проверено 3 августа 2024 г.
- ^ Отрывок из Кертис, Гленн Э., изд. (1998). «Россия – Природные ресурсы» . Страноведение США . Федеральный исследовательский отдел Библиотеки Конгресса США . Архивировано из оригинала 13 марта 2022 года . Проверено 25 июня 2021 г.
Россия является одной из самых богатых стран мира сырьевыми ресурсами, многие из которых являются важным сырьем для промышленной экономики. На долю России приходится около 20 процентов мировой добычи нефти и природного газа, и она обладает большими запасами обоих видов топлива. Такое изобилие сделало Россию практически энергетически самодостаточной и крупным экспортером топлива.
- ^ Турак, Наташа (23 июня 2022 г.). «Российский рубль достиг самого высокого уровня за 7 лет, несмотря на масштабные санкции. И вот почему» . CNBC . Архивировано из оригинала 14 февраля 2023 года . Проверено 12 апреля 2023 г.
- ^ "Россия становится членом ВТО после 18 лет переговоров" . Новости Би-би-си . 16 декабря 2011 г. Архивировано из оригинала 1 декабря 2022 г. Проверено 28 ноября 2023 г.
- ^ Бруно С. Серджи, изд. (23 мая 2019 г.). Моделирование экономического роста в современной России . Издательство Изумрудной группы. стр. 99–. ISBN 978-1-78973-265-8 . OCLC 1101173631 . Архивировано из оригинала 5 марта 2024 года . Проверено 18 марта 2022 г.
- ^ Перейти обратно: а б «Будущее России как энергетической сверхдержавы» . Издательство Гарвардского университета . 20 ноября 2017 г. Архивировано из оригинала 2 декабря 2022 г. Проверено 22 февраля 2021 г.
- ^ Перейти обратно: а б Н. Зоннихсен (15 июня 2021 г.). «Природный газ – страны с крупнейшими запасами 2009–2019» . Статистика . Архивировано из оригинала 12 августа 2021 года . Проверено 2 июля 2021 г.
Россия обладает крупнейшими в мире доказанными запасами природного газа. По состоянию на 2019 год у него было 38 триллионов кубических метров (1,3 квадриллиона кубических футов) ископаемого топлива, что на четыре триллиона кубических метров (140 триллионов кубических футов) больше, чем десятью годами ранее.
- ^ Перейти обратно: а б «Статистический обзор мировой энергетики, 69-е издание» (PDF) . bp.com . БП . 2020. с. 45. Архивировано (PDF) из оригинала 19 сентября 2020 года . Проверено 8 ноября 2020 г.
- ^ Перейти обратно: а б «Сырая нефть – доказанные запасы» . Всемирная книга фактов ЦРУ . Центральное разведывательное управление . Архивировано из оригинала 26 марта 2023 года . Проверено 2 июля 2021 г.
- ^ Перейти обратно: а б Исследование энергетических ресурсов, 2010 г. (PDF) . Мировой энергетический совет . 2010. с. 102. ИСБН 978-0-946121-021 . Архивировано (PDF) из оригинала 4 марта 2012 года . Проверено 8 ноября 2020 г.
- ^ Перейти обратно: а б «Природный газ – экспорт» . Всемирная книга фактов ЦРУ . Центральное разведывательное управление . Архивировано из оригинала 5 апреля 2022 года . Проверено 2 июля 2021 г.
- ^ Перейти обратно: а б «Природный газ – добыча» . Всемирная книга фактов ЦРУ . Центральное разведывательное управление . Архивировано из оригинала 26 марта 2023 года . Проверено 2 июля 2021 г.
- ^ Перейти обратно: а б «Сырая нефть – экспорт» . Всемирная книга фактов ЦРУ . Центральное разведывательное управление . Архивировано из оригинала 26 марта 2023 года . Проверено 2 июля 2021 г.
- ^ Перейти обратно: а б «Нефть – добыча» . Всемирная книга фактов ЦРУ . Центральное разведывательное управление . Архивировано из оригинала 26 марта 2023 года . Проверено 2 июля 2021 г.
- ^ Перейти обратно: а б Сухопутный, Индра; Логинова Юлия (1 августа 2023 г.). «Российская угольная промышленность в нестабильном мире: наконец-то поворот в Азию?» . Энергетические исследования и социальные науки . 102 : 103150. Бибкод : 2023ERSS..10203150O . дои : 10.1016/j.erss.2023.103150 . ISSN 2214-6296 .
- ^ «Международные резервы Российской Федерации (Конец периода)» . Центральный Банк России . Архивировано из оригинала 12 ноября 2020 года . Проверено 21 июня 2021 г.
- ^ «Рабочая сила – Всемирный справочник фактов» . Центральное разведывательное управление . Архивировано из оригинала 29 марта 2022 года . Проверено 16 июня 2021 г.
- ^ «База данных SIPRI о поставках оружия» . sipri.org . Архивировано из оригинала 19 декабря 2018 года . Проверено 14 июня 2022 г.
- ^ «МСН» . www.msn.com . Архивировано из оригинала 31 января 2019 года . Проверено 1 января 2024 г.
- ^ «Сделано в России – самый экспортируемый товар России» (на немецком языке). 14 июня 2022 года. Архивировано из оригинала 1 января 2024 года . Проверено 1 января 2024 г.
- ^ Давыдова, Ангелина (24 ноября 2021 г.). «Оставит ли Россия когда-нибудь запасы ископаемого топлива?» . Би-би-си . Архивировано из оригинала 13 апреля 2022 года . Проверено 3 марта 2022 г.
В целом по России нефть и газ обеспечили 39% доходов федерального бюджета и составили 60% российского экспорта в 2019 году.
- ^ Рассел, Мартин (апрель 2018 г.). «Социально-экономическое неравенство в России» (PDF) . Европейская парламентская исследовательская служба . Европейский парламент . Архивировано (PDF) из оригинала 17 февраля 2022 года . Проверено 25 января 2022 г.
- ^ «Открытые данные Всемирного банка» . Открытые данные Всемирного банка . Архивировано из оригинала 26 мая 2023 года . Проверено 1 января 2024 г.
- ^ «Миллиардеры Форбс 2021» . Форбс . Архивировано из оригинала 4 января 2019 года . Проверено 13 апреля 2021 г.
- ^ Уолш, Бен (9 марта 2022 г.). «Беспрецедентные американские санкции против России объяснены» . Вокс . Архивировано из оригинала 11 апреля 2022 года . Проверено 31 марта 2022 г.
- ^ Лузин, Павел; Прокопенко, Александра (11 октября 2023 г.). «Бюджет России на 2024 год показывает, что она планирует длительную войну на Украине» . Вашингтон, округ Колумбия: Фонд Карнеги за международный мир . Проверено 3 августа 2024 г.
Война против Украины и Запада является не только главным приоритетом Кремля; теперь он также является основным драйвером экономического роста России.
- ^ Курбангалеева Екатерина (28 мая 2024 г.). «Рост зарплат в России во время войны усиливает поддержку Путина со стороны рабочего класса» . Вашингтон, округ Колумбия: Фонд Карнеги за международный мир . Проверено 4 августа 2024 г.
- ^ Розенберг, Стив (6 июня 2024 г.). «Российская экономика растет, но сможет ли она продолжаться?» . Новости Би-би-си . Би-би-си . Проверено 3 августа 2024 г.
- ^ Городниченко Юрий; Корхонен, Ликка; Рыбакова, Элина (24 мая 2024 г.). «Российская экономика на военном положении: новая реальность, финансируемая за счет экспорта сырьевых товаров» . Лондон, Великобритания: Центр исследований экономической политики (CEPR) . Проверено 3 августа 2024 г.
- ^ Ричард Коннолли, Российская экономика: очень краткое введение (2020), стр. 2–11.
- ^ Перейти обратно: а б с д и ж г час я дж Журавская Екатерина; Гурьев Сергей; Маркевич, Андрей (2024). «Новая российская экономическая история» . Журнал экономической литературы . 62 (1): 47–114. дои : 10.1257/jel.20221564 . ISSN 0022-0515 .
- ^ «Экономическая мысль в России» . Ежеквартальный экономический журнал . 2 (2): 233–243. 1888. дои : 10.2307/1879493 . ISSN 0033-5533 .
- ^ Borisyuk, Andrey (2023). История России, которую приказали забыть. Николай II и его время [ История России, которую приказали забыть. Николай II и его время ] (на русском языке) (5-е изд.). СПб: Питер. п. 19. ISBN 978-5-4484-3841-7 .
- ^ Пол ГрегориЭкономический рост Российской империи (конец XIX — начало ХХ в.): Новые подсчеты и оценки / Пер. с англ. — М.: «Российская политическая энциклопедия» (РОССПЭН), 2003. — 256 с. P.30
- ^ Ольденбург, 2022 , стр. 489–490.
- ^ Дэвис 1998 , с. 1 , 3 .
- ^ Аппель, Хилари; Оренштейн, Митчелл А. (2018). От триумфа к кризису: неолиберальная экономическая реформа в посткоммунистических странах . Издательство Кембриджского университета . п. 3. ISBN 978-1108435055 . Архивировано из оригинала 5 марта 2024 года . Проверено 30 декабря 2020 г.
- ^ Перейти обратно: а б «Группа по изучению птицеводства компании Nuffield — визит в Россию, 6–14 октября 2006 г.» (PDF) . Исследовательский и образовательный фонд BEMB. 2007. Архивировано из оригинала (PDF) 7 августа 2007 года . Проверено 27 декабря 2007 г.
- ^ «Как Гарвард потерял Россию» . Институциональный инвестор . 27 февраля 2006 г. Архивировано из оригинала 17 июля 2014 г. Проверено 24 июля 2014 г.
- ^ Маттеи, Клара Э. (2022). Капитальный порядок: как экономисты изобрели политику жесткой экономии и проложили путь фашизму . Издательство Чикагского университета . п. 302. ИСБН 978-0226818399 . Архивировано из оригинала 4 января 2023 года . Проверено 4 декабря 2022 г.
- ^ Перейти обратно: а б с д «Рост ВВП (годовой %)» . Всемирный банк . Архивировано из оригинала 28 июня 2016 года . Проверено 26 июля 2014 г.
- ^ «Члены» . Учебный центр АТЭС; Городской университет Гонконга. Архивировано из оригинала 10 августа 2007 года . Проверено 27 декабря 2007 г.
- ^ Вебер, Изабелла (2021). Как Китай избежал шоковой терапии: дебаты о рыночной реформе . Абингдон, Оксон: Рутледж . п. 5. ISBN 978-0-429-49012-5 . OCLC 1228187814 .
- ^ Шайдель, Вальтер (2017). Великий уравнитель: насилие и история неравенства от каменного века до XXI века . Издательство Принстонского университета . п. 222. ИСБН 978-0691165028 .
- ↑ Приватизация повысила уровень смертности. Архивировано 6 марта 2016 года в Wayback Machine . BBC , 15 января 2009 г. Проверено 24 ноября 2018 г.
- ^ Роузфилд, Стивен (2001). «Преждевременная смерть: радикальный экономический переход в России с советской точки зрения». Европа-Азиатские исследования . 53 (8): 1159–1176. дои : 10.1080/09668130120093174 . S2CID 145733112 .
- ^ Годси, Кристен ; Оренштейн, Митчелл А. (2021). Подведение итогов шока: социальные последствия революций 1989 года . Нью-Йорк: Издательство Оксфордского университета . стр. 195–196. дои : 10.1093/oso/9780197549230.001.0001 . ISBN 978-0197549247 .
В поясе смертности Европы бывшего Советского Союза агрессивное вмешательство в области политики здравоохранения могло бы предотвратить десятки тысяч дополнительных смертей или, по крайней мере, вызвать иное восприятие намерений Запада. Вместо этого западный самовосхваляющий триумфализм, политический приоритет необратимого разрушения коммунистической системы и желание любой ценой интегрировать восточноевропейские экономики в капиталистический мир взяли верх.
- ^ Годси, Кристен (2017). Красное похмелье: наследие коммунизма двадцатого века . Издательство Университета Дьюка . стр. 63–64. ISBN 978-0822369493 . Архивировано из оригинала 4 августа 2018 года . Проверено 24 ноября 2018 г.
- ^ Перейти обратно: а б Вебер, Изабелла (2021). Как Китай избежал шоковой терапии: дебаты о рыночной реформе . Абингдон, Оксон: Рутледж . п. 2. ISBN 978-0-429-49012-5 . OCLC 1228187814 .
- ^ "Поторебление мяса на душу населения в СССР, россии и развитьіх странах" (PDF) . Archived from the original (PDF) on 17 December 2021.
- ^ Николсон, Алекс. «Металл – это последнее золотое дно природного ресурса для России» . Интернэшнл Геральд Трибьюн . Архивировано из оригинала 16 августа 2007 года.
- ^ Пейдж, Джереми (16 мая 2005 г.). «Анализ: наказан за свои политические амбиции» . Таймс . Великобритания. Архивировано из оригинала 1 июня 2010 года . Проверено 27 декабря 2007 г.
- ^ «Россия: путь назад к жизни (международное издание)» . БизнесУик . 29 ноября 1999 г. Архивировано из оригинала 30 марта 2019 г. . Проверено 27 декабря 2007 г.
- ^ Годси, Кристен ; Оренштейн, Митчелл А. (2021). Подведение итогов шока: социальные последствия революций 1989 года . Издательство Оксфордского университета . п. 31. дои : 10.1093/oso/9780197549230.001.0001 . ISBN 978-0197549247 .
- ^ «Бизнес: Экономика Россия: Самый большой провал МВФ» . Би-би-си. 23 сентября 1999 г. Архивировано из оригинала 2 августа 2019 г. Проверено 10 мая 2015 г.
- ^ «Факты о кредитовании России МВФ» . Международный валютный фонд. 13 сентября 1999 года. Архивировано из оригинала 29 августа 2016 года . Проверено 10 мая 2015 г.
- ^ По данным Единого реестра правовых актов и иных документов Содружества Независимых Государств, 24 декабря 1993 года Туркменистан направил уведомление о присоединении к Договору о создании Экономического союза. Для Туркменистана оно вступило в силу 22 января 1994 года. По состоянию на 2024 год соглашение действует согласно реестру (Исполком СНГ). См. https://cis.minsk.by/reestrv2/doc/257#documentCard. Архивировано 4 января 2024 г. в Wayback Machine.
- ^ "Единый реестр правовых актов и других документов Содружества Независимых Государств" . Archived from the original on 4 January 2024 . Retrieved 4 January 2024 .
- ^ "Единый реестр правовых актов и других документов Содружества Независимых Государств" . Archived from the original on 28 October 2023 . Retrieved 4 January 2024 .
- ^ "Единый реестр правовых актов и других документов Содружества Независимых Государств" . Archived from the original on 4 January 2024 . Retrieved 4 January 2024 .
- ^ «ВТО | Региональные торговые соглашения» . Архивировано из оригинала 5 мая 2017 года . Проверено 5 января 2024 г.
- ^ «Карта доступа к рынку» . Архивировано из оригинала 5 января 2024 года . Проверено 5 января 2024 г.
- ^ https://docs.eaeunion.org/docs/ru-ru/0054920/itot_06112012 Архивировано 4 января 2024 г. в Wayback Machine. [ только URL ]
- ^ https://docs.eaeunion.org/docs/ru-ru/0055079/itot_06112012 Архивировано 4 января 2024 г. в Wayback Machine. [ только URL ]
- ^ https://docs.eaeunion.org/en-us/pages/alldocuments.aspx#npbdocumentbelongsta. Архивировано 4 января 2024 г. в Wayback Machine. [ только URL ]
- ^ https://docs.eaeunion.org/docs/en-us/0054920/itot_06112012. Архивировано 4 января 2024 г. в Wayback Machine. [ только URL ]
- ^ https://docs.eaeunion.org/docs/en-us/0055079/itot_06112012. Архивировано 4 января 2024 г. в Wayback Machine. [ только URL ]
- ^ Перейти обратно: а б Оценка экономической политики Путина. Архивировано 22 марта 2016 г. в Wayback Machine , автор: Андерс Ослунд , Институт международной экономики Петерсона , июль 2008 г.
- ^ Перейти обратно: а б «Инвестиции в Россию» (PDF) . КПМГ . Апрель 2013 г. Архивировано (PDF) из оригинала 28 декабря 2013 г. . Проверено 21 июля 2014 г.
- ^ РОЗНИЧНЫЙ ПОДХОД. Российские банки борются за частников (на русском языке). ВТБмагазин.ру. Архивировано из оригинала 19 июня 2006 года . Проверено 12 ноября 2011 г.
- ^ "Ежегодно объем потребительского кредитования в России удваивается" . Bank.samaratoday.ru. Archived from the original on 21 October 2011 . Retrieved 12 November 2011 .
- ^ "Основные Социально-Экономические Индикаторы Уровня Жизни Населения" . Gks.ru. Archived from the original on 15 July 2006 . Retrieved 12 November 2011 .
- ^ «ЦРУ – Всемирная книга фактов – Россия» . Cia.gov. Архивировано из оригинала 9 января 2021 года . Проверено 12 ноября 2011 г.
- ^ «Россия досрочно погасила долг МВФ» . Исследование МВФ . 34 (2). 8 февраля 2005 г. Архивировано из оригинала 2 января 2022 г. Проверено 28 декабря 2023 г.
- ^ «В России потихоньку набирает силу современный институт» . Развивающиеся рынки. 26 ноября 2012 года. Архивировано из оригинала 8 августа 2014 года . Проверено 27 июля 2014 г.
- ↑ Россия привлекает инвесторов, несмотря на свой имидж. Архивировано 5 марта 2016 г. на сайте Wayback Machine BBC News. Проверено в марте 2008 г.
- ^ Ярко Фидрмуц; Филипп Иоганн Зюсс (сентябрь 2009 г.). «Начало российского банковского кризиса» (PDF) . Мюнхенский университет. Архивировано (PDF) из оригинала 12 августа 2016 года . Проверено 26 июля 2014 г.
- ^ «Финансовый кризис: действия центральных банков и правительств» . Хранитель . 21 октября 2008 г. Архивировано из оригинала 15 ноября 2020 г. . Проверено 26 июля 2014 г.
- ^ «Инсайт: на российском банковском рынке больше нет легкой добычи» . Рейтер . 22 мая 2013 года. Архивировано из оригинала 1 января 2016 года . Проверено 26 июля 2014 г.
- ^ ДИНАМИКА РЕАЛЬНЫХ ДОХОДОВ НАСЕЛЕНИЯ (на русском языке). Росстат. Архивировано из оригинала 13 января 2021 года . Проверено 21 июля 2014 г.
- ^ Гурьев Сергей; Цывинский, Олег (2010). «Вызовы, стоящие перед российской экономикой после кризиса». В Андерсе Ослунде; Сергей Гуриев; Эндрю К. Качинс (ред.). Россия после мирового экономического кризиса . Институт Петерсона международной экономики; Центр стратегических и международных исследований; Новая экономическая школа. стр. 12–13 . ISBN 9780881324976 .
- ↑ Путин: Выбор России (Routledge 2007), Ричард Саква , Глава 9
- ^ «Отчет о мировом благосостоянии, 2013 г. – стр. 53» . Кредит Свисс. Архивировано из оригинала 14 февраля 2015 года . Проверено 13 апреля 2015 г.
- ^ «Неравенство богатства в России одно из самых высоких в мире» . Хаффингтон Пост . 9 октября 2013 года. Архивировано из оригинала 9 октября 2013 года . Проверено 21 июля 2014 г.
- ^ «Незаконные финансовые потоки из развивающихся стран: 2002–2011 гг.» (PDF) . Глобальная финансовая честность. 2013. Архивировано (PDF) из оригинала 8 апреля 2016 года . Проверено 5 декабря 2014 г.
- ^ Ворасарун, Чанига (30 апреля 2008 г.). «Города миллиардеров» . Форбс . Архивировано из оригинала 17 апреля 2009 года . Проверено 21 августа 2014 г.
Жеромель, Рикардо (14 марта 2013 г.). «Топ-10 городов-миллиардеров по версии Forbes: Москва снова обыграла Нью-Йорк» . Форбс . Архивировано из оригинала 15 января 2021 года . Проверено 21 августа 2014 г. - ^ "Россия становится членом ВТО после 18 лет переговоров" . Би-би-си . 16 декабря 2011 г. Архивировано из оригинала 6 мая 2021 г. . Проверено 26 января 2021 г.
- ^ Перейти обратно: а б «ВТО | Российская Федерация - Информация о членах» . Архивировано из оригинала 16 февраля 2016 года . Проверено 19 июня 2023 г.
- ^ «Россия вступает в ВТО после 19 лет переговоров | Financial Times» . www.ft.com . Архивировано из оригинала 18 июня 2023 года . Проверено 15 августа 2023 г.
- ^ Эллиотт, Ларри (22 августа 2012 г.). «Вступление России в ВТО завершает 19 лет переговоров» . Хранитель . Архивировано из оригинала 18 июня 2023 года . Проверено 19 июня 2023 г.
- ^ Перейти обратно: а б «Соглашение о свободной торговле СНГ вступает в силу - Американо-украинский деловой совет (USUBC)» . Архивировано из оригинала 21 марта 2023 года . Проверено 19 июня 2023 г.
- ^ Перейти обратно: а б «Этапы экономической интеграции: от автаркии к экономическому союзу» . Архивировано из оригинала 10 октября 2022 года . Проверено 19 июня 2023 г.
- ^ Перейти обратно: а б «Евразийский экономический союз» . www.eaeunion.org . Архивировано из оригинала 1 апреля 2020 года . Проверено 19 июня 2023 г.
- ^ «Новые классификации стран» . 2 июля 2013 г. Архивировано из оригинала 18 июня 2023 г. Проверено 19 июня 2023 г.
- ^ «Страна и кредитные группы» . Всемирный банк. Архивировано из оригинала 2 июля 2014 года . Проверено 1 июля 2013 г.
- ^ «Всемирный банк обновляет классификацию стран по ВНД на душу населения» . Архивировано из оригинала 18 июня 2023 года . Проверено 19 июня 2023 г.
- ^ «Новые классификации стран по уровню дохода: 2016-2017» . Июль 2016. Архивировано из оригинала 18 июня 2023 года . Проверено 19 июня 2023 г.
- ^ «Страновые и кредитные группы Всемирного банка – Служба поддержки данных Всемирного банка» . Архивировано из оригинала 28 октября 2019 года . Проверено 26 августа 2016 г.
- ^ https://www.europarl.europa.eu/RegData/etudes/BRIE/2022/729375/EPRS_BRI(2022)729375_EN.pdf . Архивировано 18 марта 2023 г. в Wayback Machine. [ пустой URL PDF ]
- ^ «Российский ИЧР 2021» . Архивировано из оригинала 18 июня 2023 года . Проверено 19 июня 2023 г.
- ^ Крамер, Эндрю Э. (22 сентября 2011 г.). «Экономические реформы, вероятно, продолжатся при Путине» . Нью-Йорк Таймс . Архивировано из оригинала 1 апреля 2019 года . Проверено 27 июля 2014 г.
- ^ «Россия – Анализ» . ОВОС . 31 октября 2017 г. Архивировано из оригинала 17 февраля 2021 г. Проверено 17 февраля 2021 г.
- ^ «О ключевой ставке Банка России» . Банк России . 16 июня 2014 года. Архивировано из оригинала 1 января 2016 года . Проверено 26 июля 2014 г.
- ^ «ЕВРОПА – Отдел новостей ЕС – Санкции ЕС против России из-за кризиса на Украине» . europa.eu . Архивировано из оригинала 11 июня 2015 года . Проверено 22 июня 2015 г.
- ^ ВВП России в первом полугодии вырос на 1% — Минэкономразвития . Ведомости . 27 июля 2014 года. Архивировано из оригинала 23 сентября 2015 года . Проверено 7 августа 2014 г.
- ^ Анна Андрианова (2 апреля 2015 г.). «Российская экономика неожиданно выросла на 0,4% в четвертом квартале» . Bloomberg.com . Архивировано из оригинала 28 августа 2020 года . Проверено 30 апреля 2015 г.
- ^ «Неравная Россия: в мировой столице неравенства кипит гнев?» . Хранитель . 25 апреля 2017 г. Архивировано из оригинала 11 января 2021 г. Проверено 27 апреля 2017 г.
- ^ «Послание Конгрессу – по поводу статуса России в рамках Всеобщей системы преференций» . 7 мая 2014 г. Архивировано из оригинала 4 января 2024 г. . Проверено 4 января 2024 г.
- ^ «Обновление Всеобщей системы преференций (GSP) | Таможенная и пограничная служба США» . Архивировано из оригинала 4 января 2024 года . Проверено 4 января 2024 г.
- ^ Тим Боулер (19 января 2015 г.). «Падение цен на нефть: кто выиграет и проиграет?» . Новости Би-би-си . Архивировано из оригинала 14 февраля 2018 года . Проверено 30 апреля 2015 г.
- ^ О состоянии внешней торговли в январе-феврале 2015 года О состоянии внешней торговли в январе-феврале 2015 года. gks.ru (на русском языке). Архивировано из оригинала 27 апреля 2015 года . Проверено 30 апреля 2015 г.
- ^ Мэтлак, Кэрол (28 января 2016 г.). «Великий сдвиг России вниз» . Bloomberg.com . Bloomberg LP Архивировано из оригинала 29 января 2016 года . Проверено 28 января 2016 г.
- ^ "О производстве и использовании валового внутреннего продукта (ВВП) за 2017 год" . www.gks.ru . Archived from the original on 12 June 2018 . Retrieved 1 February 2018 .
- ^ «Российская экономика поползла к росту, несмотря на рецессию» . Блумберг. 31 марта 2017 г. Архивировано из оригинала 21 апреля 2019 г. . Проверено 10 апреля 2017 г. .
- ^ Перейти обратно: а б Это самые инновационные экономики мира . Архивировано 2 апреля 2022 года в Wayback Machine Bloomberg Business.
- ^ Самое инновационное: Страны Bloomberg Business.
- ^ 30 самых инновационных стран. Архивировано 1 июля 2016 года в Wayback Machine Bloomberg Business.
- ^ «Статистический обзор мировой энергетики» . bp.com . Архивировано из оригинала 15 января 2023 года . Проверено 11 мая 2023 г.
- ^ «Обзоры полезных ископаемых | Геологическая служба США» (PDF) . Minerals.usgs.gov . Архивировано (PDF) из оригинала 25 января 2019 года . Проверено 30 апреля 2023 г.
- ^ "55 триллионов в запасе: как власти оценили все природные ресурсы России" . 14 March 2019. Archived from the original on 14 March 2019 . Retrieved 30 April 2023 .
- ^ «Природные ресурсы России составляют 60% ВВП» . «Москва Таймс» . 14 марта 2019 г. Архивировано из оригинала 7 ноября 2020 г. Проверено 17 марта 2019 г.
- ^ «Открытые данные Всемирного банка» . Архивировано из оригинала 4 января 2024 года.
- ^ «Российское вторжение сократит экономику Украины на 45 процентов в этом году» . Всемирный банк . Архивировано из оригинала 9 июля 2022 года . Проверено 15 июня 2022 г.
- ^ «Секретная экономика: что сокрытие статистики дает России» . Архивировано из оригинала 21 июля 2022 года . Проверено 17 июля 2022 г.
- ^ «Германия открыта для конфискации активов Центрального банка России для финансирования восстановления Украины» . Еврактив . 17 мая 2022 года. Архивировано из оригинала 25 октября 2022 года . Проверено 26 февраля 2023 г.
- ^ Дэвидсон, Кейт; Уивер, Обри Элиза (28 февраля 2022 г.). «Запад объявляет экономическую войну России» . Политик . Архивировано из оригинала 1 марта 2022 года.
- ^ Поп, Валентина (25 февраля 2022 г.). «Лидеры ЕС соглашаются на дополнительные санкции против России, но оставляют некоторые на потом» . Файнэншл Таймс . Архивировано из оригинала 26 февраля 2022 года.
- ^ «Цена войны: сколько Россия тратит каждый день на войну с Украиной?» . Земельный отчет . 28 мая 2022 года. Архивировано из оригинала 4 февраля 2023 года . Проверено 26 февраля 2023 г.
- ^ «Война на Украине: Россия тратит 900 миллионов долларов в день на «специальную военную операцию» » . Вион . 7 мая 2022 года. Архивировано из оригинала 22 октября 2022 года . Проверено 26 февраля 2023 г.
- ^ «Москва с трудом справляется с издержками войны на Украине» . Исраэль Хайом . 22 августа 2022 года. Архивировано из оригинала 7 февраля 2023 года . Проверено 26 февраля 2023 г.
- ^ «Россия в дефолте по долгам, поскольку срок погашения истекает» . Новости Би-би-си . 25 июня 2022 года. Архивировано из оригинала 9 июля 2022 года . Проверено 16 ноября 2022 г.
- ^ «Россия впадает в рецессию» . Аль Арабия на английском языке . 16 ноября 2022 года. Архивировано из оригинала 16 ноября 2022 года . Проверено 16 ноября 2022 г.
- ^ «Основной российский нефтепродукт торгуется намного ниже ценового предела в 60 долларов, поскольку лишь горстка покупателей продолжает торговать со страной, находящейся под строгими санкциями» . Бизнес-инсайдер . 9 января 2023 года. Архивировано из оригинала 26 февраля 2023 года . Проверено 26 февраля 2023 г.
- ^ «Западные санкции приводят к тому, что энергетические доходы России окажутся самыми низкими с 2020 года» . Рейтер . 3 февраля 2023 года. Архивировано из оригинала 8 июня 2023 года . Проверено 26 февраля 2023 г.
- ^ «Какие страны избежали ловушки среднего дохода?» . Экономист . Архивировано из оригинала 19 июня 2023 года . Проверено 19 июня 2023 г.
- ^ Перейти обратно: а б «Импортозависимость России — ЭКОН.ОНЛАЙН» . 26 января 2023 года. Архивировано из оригинала 18 июня 2023 года . Проверено 19 июня 2023 г.
- ^ "Дефицит бюджета России в первом квартале ожидается в $29,42 млрд — Минфин" . ТАСС . 7 апреля 2023 г. Архивировано из оригинала 2 декабря 2023 г.
- ^ Гришко, Алёна (18 августа 2023 г.). « Самая мощная» российская валюта и «стабильная» российская экономика: реальность, стоящая за пропагандой» . УкраинаМир . Архивировано из оригинала 18 августа 2023 года . Проверено 18 августа 2023 г.
- ^ «Российский денежный поток превратился в ручеек в 5,4 миллиарда долларов, что ослабляет рубль» . Энергия соединяет . Блумберг. 11 июля 2023 г. Архивировано из оригинала 18 ноября 2023 г.
- ^ "Единый реестр правовых актов и других документов Содружества Независимых Государств" . Archived from the original on 28 October 2023 . Retrieved 4 January 2024 .
- ^ Позняков Андрей; Беллами, Дэниел (15 сентября 2023 г.). «Россия повышает процентную ставку до 13%, поскольку экономика испытывает трудности» . Евроньюс . Архивировано из оригинала 18 сентября 2023 года . Проверено 18 сентября 2023 г.
- ^ «Доля России в торговле ЕС падает ниже 2% - Продукция Евростат Новости - Евростат» . ec.europa.eu . Архивировано из оригинала 20 сентября 2023 года . Проверено 6 октября 2023 г.
- ^ Марроу, Александр (9 октября 2023 г.). «Российский рубль упал до более чем 18-месячного минимума по отношению к доллару» . Рейтер . Архивировано из оригинала 10 октября 2023 года . Проверено 9 октября 2023 г.
- ^ https://www.nytimes.com/2024/07/26/world/europe/russia-inflation-interest-rate.html .
- ^ «Бюджет России на 2024 год показывает, что она планирует длительную войну на Украине» . 11 октября 2023 года. Архивировано из оригинала 12 октября 2023 года . Проверено 23 октября 2023 г.
- ^ «Отчет по избранным странам и субъектам» . МВФ . Архивировано из оригинала 2 января 2024 года . Проверено 26 февраля 2024 г.
- ^ Перейти обратно: а б Ворновицкий Марина С.; Бойс, Джеймс К. (1 января 2010 г.). Экономическое неравенство и качество окружающей среды: свидетельства изменения уровня загрязнения в России . ScholarWorks@UMass Amherst. ОСЛК 698200672 .
- ^ «Реальный эффективный обменный курс в России, 1994–2023 гг. | Данные CEIC» . Архивировано из оригинала 30 октября 2023 года . Проверено 12 октября 2023 г.
- ^ «Дефицит бюджета России в 2016 году достигнет $21 млрд – Минфин» . Московская Таймс. Архивировано из оригинала 14 декабря 2015 года . Проверено 30 мая 2016 г. .
- ^ «Обзор» . Всемирный банк . Архивировано из оригинала 13 мая 2020 года . Проверено 22 апреля 2018 г.
- ^ «Российские финансы сильны, но экономические проблемы сохраняются» . ТРТ Мир . 29 мая 2020 года. Архивировано из оригинала 12 апреля 2022 года . Проверено 12 февраля 2022 г.
Сейчас Россия является одной из стран с наименьшей задолженностью в мире – благодаря всем нефтяным доходам.
- ^ «Государственный долг России: % ВВП, 2011–2023 | Данные CEIC» . Архивировано из оригинала 25 сентября 2023 года . Проверено 12 октября 2023 г.
- ^ Перейти обратно: а б «Внешний долг России: % ВВП, 1993–2023 гг. | Данные CEIC» . Архивировано из оригинала 5 июля 2023 года . Проверено 12 октября 2023 г.
- ^ «Открытые данные Всемирного банка» . Архивировано из оригинала 5 июля 2023 года . Проверено 12 октября 2023 г.
- ^ https://ach.gov.ru/upload/iblock/bca/ke0rrd7mtyvihkmhsjv43bgk5rzw1wc8.pdf . Архивировано 5 июля 2023 г. в Wayback Machine. [ пустой URL PDF ]
- ^ «Внутренний долг России | Экономические показатели | CEIC» . Архивировано из оригинала 5 июля 2023 года . Проверено 12 октября 2023 г.
- ^ «Россия: Внешний долг к ВВП 2022» . Архивировано из оригинала 5 июля 2023 года . Проверено 12 октября 2023 г.
- ^ «Внешний долг России 2023» . Архивировано из оригинала 6 июля 2023 года . Проверено 12 октября 2023 г.
- ^ «Внешний долг России, 2000–2023 гг. | Данные CEIC» . Архивировано из оригинала 12 августа 2021 года . Проверено 18 июля 2021 г.
- ^ "Фонд национального благосостояния России в июле вырос почти на 23 миллиарда долларов, превысив 200 миллиардов долларов", - говорят в министерстве" . 8 августа 2022 года. Архивировано из оригинала 3 декабря 2022 года . Проверено 20 января 2024 г.
- ^ "Фонд национального благосостояния России на 1 января составляет $135 млрд — Минфин" . 17 января 2024 года. Архивировано из оригинала 18 января 2024 года . Проверено 18 января 2024 г.
- ^ «Индекс восприятия коррупции 2020» . Transparency.org . 28 января 2021 года. Архивировано из оригинала 30 января 2021 года . Проверено 31 января 2021 г.
- ^ «Индекс восприятия коррупции 2014» . Трансперенси Интернешнл. 3 декабря 2014 года. Архивировано из оригинала 29 сентября 2014 года . Проверено 4 декабря 2015 г.
- ^ Alferova, Ekaterina (26 October 2020). "В России предложили создать должность омбудсмена по борьбе с коррупцией" [Russia proposed to create the post of Ombudsman for the fight against corruption]. Известия (in Russian). Izvestia . Archived from the original on 2 November 2020 . Retrieved 5 November 2020 .
- ^ «Доклад о коррупции в России» . ГАН Честность . Июнь 2020. Архивировано из оригинала 20 декабря 2019 года . Проверено 5 ноября 2020 г.
- ^ Сухара, Манабу. «Коррупция в России: историческая перспектива» (PDF) . Архивировано из оригинала (PDF) 4 марта 2016 года . Проверено 4 декабря 2015 г.
- ^ "На невыгодных госзакупках в прошлом году Россия потеряла 4 миллиарда долларов" . Медуза . Архивировано из оригинала 4 июня 2016 года . Проверено 7 декабря 2015 г.
- ^ «Наемные полицейские» . Экономист . 2010. Архивировано из оригинала 8 декабря 2015 года . Проверено 4 декабря 2015 г.
- ^ Клара Сабирьянова Петр; Татьяна Зеленская (2010). «Коррупция в российском здравоохранении: определяющие факторы и распространенность взяточничества» (PDF) . Архивировано (PDF) из оригинала 8 декабря 2015 года . Проверено 4 декабря 2015 г.
- ^ Елена Денисова-Шмидт; Эльвира Леонтьева; Ярослав Притула (2014). «Коррупция в университетах – общая болезнь для России и Украины» . Гарвардский университет. Архивировано из оригинала 8 декабря 2015 года . Проверено 4 декабря 2015 г.
- ^ Мейнс, Чарльз (26 января 2020 г.). «Новые отчеты подчеркивают глубоко укоренившуюся в России культуру коррупции | Голос Америки – английский» . www.voanews.com . Голос Америки . Архивировано из оригинала 27 января 2020 года . Проверено 5 ноября 2020 г.
- ^ «80% российских предпринимателей опасаются произвольных арестов» . «Москва Таймс» . 26 мая 2021 года. Архивировано из оригинала 26 мая 2021 года . Проверено 26 мая 2021 г.
- ^ «Россия: выбросы парниковых газов по секторам» . Статистика . Архивировано из оригинала 15 декабря 2020 года . Проверено 3 декабря 2020 г.
- ^ «Электричество – производство» . Всемирная книга фактов ЦРУ . Центральное разведывательное управление . Архивировано из оригинала 31 марта 2022 года . Проверено 2 июля 2021 г.
- ^ Уайтмен, Адриан; Руэда, Соня; Аканде, Деннис; Эльхассан, Назик; Эскамилья, Херардо; Архипова, Яна (март 2020 г.). Статистика возобновляемых источников энергии за 2020 год (PDF) . Абу-Даби: Международное агентство по возобновляемым источникам энергии . п. 3. ISBN 978-92-9260-239-0 . Архивировано (PDF) из оригинала 26 марта 2023 года . Проверено 8 ноября 2020 г.
- ^ Лонг, Тони (27 июня 2012 г.). «27 июня 1954 года: открывается первая в мире атомная электростанция» . Проводной . Архивировано из оригинала 17 октября 2022 года . Проверено 8 июня 2021 г.
, под Москвой, вводится в эксплуатацию первая атомная электростанция, подключенная к внешней сети 1954: В Обнинске ... Ядерный реактор, используемый для выработки электроэнергии, ознаменовал новую роль Обнинска как крупного советского научного города, статус, который он сохраняет в Российской Федерации, где он носит прозвище «Первый российский наукоград».
- ^ «Атомная энергетика сегодня» . www.world-nuclear.org . Всемирная ядерная ассоциация . Октябрь 2020. Архивировано из оригинала 16 июля 2021 года . Проверено 8 ноября 2020 г.
- ^ Перейти обратно: а б Шулецкий, Кацпер; Оверленд, Индра (апрель 2023 г.). «Российская ядерно-энергетическая дипломатия и ее значение для энергетической безопасности в контексте войны на Украине» . Энергия природы . 8 (4): 413–421. Бибкод : 2023NatEn...8..413S . дои : 10.1038/s41560-023-01228-5 . HDL : 11250/3106595 . ISSN 2058-7546 .
- ^ "Нефть со всеми вытекающими" . www.kommersant.ru . 27 October 2014. Archived from the original on 23 September 2023 . Retrieved 19 June 2023 .
- ^ https://carnegiemoscow.org/commentary/61272. Архивировано 14 мая 2023 г. в Wayback Machine. [ только URL ]
- ^ https://rosstat.gov.ru/storage/mediabank/1b5RpebS/Maximov-tezisy.pdf. Архивировано 11 октября 2023 г. в Wayback Machine. [ пустой URL PDF ]
- ^ "Росстат впервые рассчитал долю нефти и газа в российском ВВП" . РБК . 13 July 2021. Archived from the original on 19 August 2021 . Retrieved 19 June 2023 .
- ^ «Доля нефти и газа в ВВП России в 2020 году упала до 15%» . neftegazru.com . 14 июля 2021 года. Архивировано из оригинала 9 июля 2023 года . Проверено 19 июня 2023 г.
- ^ «Доля нефти и газа в ВВП России упала до 15% в 2020 году | NORVANREPORTS.COM | Деловые новости, страхование, налогообложение, нефть и газ, морские новости, Гана, Африка, мир» . 14 июля 2021 года. Архивировано из оригинала 9 июля 2023 года . Проверено 19 июня 2023 г.
- ^ «Доля нефти и газа в ВВП России в 2020 году упала до 15%» . OilPrice.com . Архивировано из оригинала 6 мая 2023 года . Проверено 19 июня 2023 г.
- ^ "Что происходит с российской нефтью и газом? Разбираемся вместе с экспертами" . 12 March 2022. Archived from the original on 18 June 2023 . Retrieved 19 June 2023 .
- ^ " "Лишить Путина возможности вести войну" " . Радио Свобода . 7 September 2022. Archived from the original on 18 June 2023 . Retrieved 19 June 2023 .
- ^ "Какую роль нефть и газ играют в государственном бюджете и экономике" . 25 October 2022. Archived from the original on 18 June 2023 . Retrieved 19 June 2023 .
- ^ «Открытые данные Всемирного банка» . Архивировано из оригинала 4 января 2024 года . Проверено 4 января 2024 г.
- ^ "Нефтегазовые доходы бюджета России в 2023 году сократились на 24% - Минфин" . 11 января 2024 года. Архивировано из оригинала 11 января 2024 года . Проверено 11 января 2024 г.
- ^ «Рейтинг алмазных рудников мира по оценкам добычи в 2013 году». Архивировано 21 сентября 2013 года в Wayback Machine , Kitco , 20 августа 2013 года.
- ^ «Статистика добычи золота Геологической службы США» (PDF) . Архивировано (PDF) из оригинала 21 июня 2021 года . Проверено 28 апреля 2021 г.
- ^ «Статистика производства платины Геологической службы США» (PDF) . Архивировано (PDF) из оригинала 9 октября 2022 года . Проверено 28 апреля 2021 г.
- ^ «Статистика производства серебра Геологической службы США» (PDF) . Архивировано (PDF) из оригинала 15 мая 2021 года . Проверено 28 апреля 2021 г.
- ^ «Статистика производства меди Геологической службы США» (PDF) . Архивировано (PDF) из оригинала 9 октября 2022 года . Проверено 28 апреля 2021 г.
- ^ «Статистика производства никеля Геологической службы США» (PDF) . Архивировано (PDF) оригинала 16 февраля 2021 года . Проверено 28 апреля 2021 г.
- ^ «Статистика производства свинца Геологической службы США» (PDF) . Архивировано (PDF) из оригинала 15 мая 2021 года . Проверено 28 апреля 2021 г.
- ^ «Статистика производства бокситов Геологической службы США» (PDF) . Архивировано (PDF) из оригинала 26 марта 2021 года . Проверено 28 апреля 2021 г.
- ^ «Статистика производства цинка Геологической службы США» (PDF) . Архивировано (PDF) из оригинала 9 октября 2022 года . Проверено 28 апреля 2021 г.
- ^ «Статистика производства ванадина Геологической службой США» (PDF) . [ постоянная мертвая ссылка ]
- ^ «Статистика производства кобальта Геологической службы США» (PDF) . Архивировано (PDF) из оригинала 13 февраля 2021 года . Проверено 28 апреля 2021 г.
- ^ «Статистика производства железной руды Геологической службы США» (PDF) . Архивировано (PDF) из оригинала 9 октября 2022 года . Проверено 28 апреля 2021 г.
- ^ «Статистика производства бора Геологической службой США» (PDF) . Архивировано (PDF) из оригинала 18 июля 2021 года . Проверено 28 апреля 2021 г.
- ^ «Статистика производства молибдена Геологической службы США» (PDF) . Архивировано (PDF) из оригинала 28 июня 2021 года . Проверено 28 апреля 2021 г.
- ^ «Статистика производства олова Геологической службы США» (PDF) . Архивировано (PDF) из оригинала 13 августа 2021 года . Проверено 28 апреля 2021 г.
- ^ «Статистика производства серы Геологической службы США» (PDF) . Архивировано (PDF) из оригинала 9 октября 2022 года . Проверено 28 апреля 2021 г.
- ^ «Статистика производства фосфатов Геологической службы США» (PDF) . Архивировано (PDF) из оригинала 2 мая 2021 года . Проверено 28 апреля 2021 г.
- ^ «Статистика производства гипса Геологической службы США» (PDF) . Архивировано (PDF) из оригинала 9 октября 2022 года . Проверено 28 апреля 2021 г.
- ^ «Статистика производства соли Геологической службы США» (PDF) . Архивировано (PDF) из оригинала 9 октября 2022 года . Проверено 28 апреля 2021 г.
- ^ «Мировая добыча урана» . Архивировано из оригинала 26 декабря 2018 года . Проверено 28 апреля 2021 г.
- ^ Перейти обратно: а б с д «Россия – Экономика» . Британская энциклопедия . Архивировано из оригинала 12 апреля 2022 года . Проверено 1 июля 2021 г.
- ^ «Пахотная земля (% площади земель)» . Всемирный Банк . Архивировано из оригинала 7 ноября 2023 года . Проверено 15 июня 2021 г.
- ^ Медецкий, Анатолий; Дурисин, Меган (23 сентября 2020 г.). «Доминирование России на мировом рынке пшеницы продолжает расти» . Bloomberg LP Архивировано из оригинала 31 марта 2022 года . Проверено 15 июня 2021 г.
- ^ Шахбанде, М. (8 июля 2021 г.). «Мировые производители ячменя по странам, 2020/21» . Статистика . Архивировано из оригинала 18 июля 2021 года . Проверено 18 июля 2021 г.
Эта статистика дает прогноз объема производства ячменя во всем мире в 2020/2021 году по странам. В том году Россия произвела около 20,63 миллиона тонн ячменя.
- ^ Шахбанде, М. (12 ноября 2020 г.). «Лидеры мирового производителя овса 2020» . Статистика . Архивировано из оригинала 18 июля 2021 года . Проверено 18 июля 2021 г.
- ^ Шахбанде, М. (10 февраля 2021 г.). «Лучшие страны по производству ржи 2019/2020» . Статистика . Архивировано из оригинала 18 июля 2021 года . Проверено 18 июля 2021 г.
- ^ Шахбанде, М. (25 февраля 2021 г.). «Производство семян подсолнечника в крупнейших странах 2019/20» . Статистика . Архивировано из оригинала 18 июля 2021 года . Проверено 18 июля 2021 г.
Россия также является крупнейшим производителем семян подсолнечника в мире с объемом производства 15,3 миллиона тонн в 2019/2020 году.
- ^ Люстгартен, Абрам (16 декабря 2020 г.). «Как Россия побеждает климатический кризис» . Нью-Йорк Таймс . Архивировано из оригинала 14 апреля 2022 года . Проверено 15 июня 2021 г.
- ^ «Состояние мирового рыболовства и аквакультуры» (PDF) . Продовольственная и сельскохозяйственная организация . 2018. Архивировано (PDF) из оригинала 11 февраля 2021 года . Проверено 4 февраля 2021 г.
- ^ Мантуров, Денис (2009). «Перспективы отечественного авиастроения» . Военный парад (4): 8–9. Архивировано из оригинала 25 ноября 2020 года . Проверено 15 сентября 2010 г.
- ^ Ионин, Андрей. «Российская космическая программа в 2006 году: некоторый прогресс, но нет четкого направления» . Обзор обороны Москвы (2(#8)). Центр анализа стратегий и технологий. Архивировано из оригинала 27 августа 2007 года.
- ^ «Статистика производства за 2018 год» . Архивировано из оригинала 2 декабря 2020 года . Проверено 21 ноября 2019 г.
- ^ «Производство автомобилей в России в 2022 году упало до самого низкого уровня с советских времен» . Рейтер . 1 февраля 2023 года. Архивировано из оригинала 4 апреля 2023 года . Проверено 23 мая 2023 г.
- ^ «До войны в России из 60 марок автомобилей осталось только 11» . 15 декабря 2022 года. Архивировано из оригинала 21 августа 2023 года . Проверено 21 августа 2023 г.
- ^ «Возрождение электроники в России» . Eetimes.ru. Архивировано из оригинала 7 февраля 2011 года . Проверено 8 декабря 2014 г.
- ^ «Электроника в России» . English.pravda.ru. 25 декабря 2003 г. Архивировано из оригинала 22 декабря 2004 г. Проверено 8 декабря 2014 г.
- ^ "Разработчик процессоров "Эльбрус" готовится перенести производство на зеленоградский "Микрон" из Тайваня - СМИ" . Интерфакс . 30 мая 2022 года. Архивировано из оригинала 9 декабря 2023 года . Проверено 21 августа 2023 г.
- ^ «Распространение торговых центров в России» . 8 января 2023 года. Архивировано из оригинала 21 августа 2023 года . Проверено 21 августа 2023 г.
- ^ Эндрю Э. Крамер (1 января 2013 г.). «В России расцветают торговые центры со средним классом» . Нью-Йорк Таймс . Архивировано из оригинала 11 ноября 2020 года . Проверено 2 января 2013 г.
Я чувствую себя как в Диснейленде
- ^ «Выручка от розничной торговли в России с 2010 по 2022 год» . Архивировано из оригинала 10 апреля 2023 года . Проверено 10 апреля 2023 г.
- ^ Лента.ру. «Статистика использования Интернета» . It.tut.by. Архивировано из оригинала 25 июня 2009 года . Проверено 12 ноября 2011 г.
- ^ «Всемирный справочник — Центральное разведывательное управление» . www.cia.gov . Архивировано из оригинала 9 января 2021 года . Проверено 3 января 2018 г.
- ^ «Количество абонентов мобильной сотовой связи в России с 2000 по 2021 год» . Архивировано из оригинала 21 августа 2023 года . Проверено 21 августа 2023 г.
- ^ «Пассажирские перевозки» (PDF) . РЖД . 2017. Архивировано (PDF) из оригинала 6 августа 2021 года . Проверено 2 июля 2021 г.
- ^ «Железные дороги – Всемирная книга фактов» . Центральное разведывательное управление . Архивировано из оригинала 24 ноября 2018 года . Проверено 15 июня 2021 г.
- ^ «О развитии дорожной инфраструктуры». Правительство России . 29 апреля 2016 г. Архивировано из оригинала 1 сентября 2019 г. . Проверено 14 января 2021 г.
- ^ «В Европе по-прежнему отмечается самая высокая в мире плотность дорожной сети, за ней следуют Восточная Азия и Тихоокеанский регион» . Международная дорожная федерация . 16 декабря 2020 года. Архивировано из оригинала 19 марта 2022 года . Проверено 19 мая 2021 г.
- ^ «Водные пути – Всемирная книга фактов» . Центральное разведывательное управление . Архивировано из оригинала 12 апреля 2022 года . Проверено 15 июня 2021 г.
- ^ «Аэропорты – Всемирный справочник фактов» . Центральное разведывательное управление . Архивировано из оригинала 3 апреля 2022 года . Проверено 15 июня 2021 г.
- ^ «Шереметьево сегодня» . www.svo.aero . Архивировано из оригинала 30 мая 2019 года . Проверено 10 июня 2021 г.
- ^ Д. Елагина (22 января 2021 г.). «Объем грузоперевозок в России в 2020 году по портам» . Статистика . Архивировано из оригинала 10 июня 2021 года . Проверено 10 июня 2021 г.
Российский морской порт Новороссийск, расположенный в Азово-Черноморском бассейне, в 2020 году перевалил почти 142 миллиона тонн грузов и стал ведущим портом страны по грузообороту.
- ^ «Атомные ледоколы – что в них такого особенного?» . Экспедиции Посейдона . Архивировано из оригинала 24 мая 2021 года . Проверено 24 мая 2021 г.
Россия — единственная страна в мире, строящая атомные ледоколы. Они были специально построены с учетом стратегической важности Северного морского пути и более очевидной необходимости гарантировать безопасность российских торговых судов в зимнее время и зависимость арктических поселений от поставок.
- ^ Перейти обратно: а б «СТРОИТЕЛЬНАЯ ПРОМЫШЛЕННОСТЬ РОССИИ: ДВИЖЕНИЕ ВВЕРХ?» . Архивировано из оригинала 21 августа 2023 года . Проверено 21 августа 2023 г.
- ^ «Российский страховой рынок в 2013 году» (PDF) . Ргс.ру. Архивировано (PDF) из оригинала 3 сентября 2016 года . Проверено 8 декабря 2014 г.
- ^ Зубет, Алексей. «Российский страховой рынок в 2013 году» (PDF) . Финансовый университет, Москва . Архивировано из оригинала (PDF) 2 ноября 2014 года . Проверено 30 августа 2022 г.
- ^ Huffington Post : Страны с САМЫМ САМЫМ выпускниками колледжей. Архивировано 12 ноября 2020 г. на Wayback Machine , получено 27 сентября 2013 г.
- ^ Перейти обратно: а б «Восьмой ежегодный обзор российской индустрии экспорта программного обеспечения» (PDF) . Руссофт. 22 ноября 2011 г. Архивировано из оригинала (PDF) 14 мая 2012 г. . Проверено 5 мая 2012 г.
- ^ «Российский ИТ-рынок стоимостью $2,4 млрд» . Кремниевая тайга. 26 декабря 2006 г. Архивировано из оригинала 30 сентября 2007 г. Проверено 12 ноября 2011 г.
- ^ «Кабмин Медведева вынуждает госкорпорации покупать российские технологии» . Руссофт . Архивировано из оригинала 19 декабря 2013 года . Проверено 23 июня 2013 г.
- ^ «Интернет-бизнес в России: большое исключение Европы – The Economist» . Экономист . 19 мая 2012 года. Архивировано из оригинала 18 ноября 2017 года . Проверено 14 марта 2015 г.
- ^ «Самые популярные поисковые системы в мире – список десяти лучших – Tech Robo» . Технический Робо . Архивировано из оригинала 6 мая 2015 года . Проверено 14 марта 2015 г.
- ^ "Самые популярные поисковые системы в России" . Topmira.com. Archived from the original on 13 March 2016 . Retrieved 8 December 2014 .
- ^ Перейти обратно: а б «Барометр мирового туризма ЮНВТО» . Всемирный барометр туризма ЮНВТО, английская версия . 18 (6). Всемирная туристская организация (ЮНВТО): 18. 2020. doi : 10.18111/wtobarometereng . ISSN 1728-9246 . Архивировано из оригинала 29 октября 2020 года . Проверено 13 февраля 2021 г.
- ^ Аппинк Колдервуд, Лорен; Сошкин, Максим. Фишер, Майк (ред.). Отчет о конкурентоспособности путешествий и туризма за 2019 год (PDF) . Женева: Всемирный экономический форум . п. xiii. ISBN 978-2-940631-01-8 . Архивировано (PDF) из оригинала 4 сентября 2019 года . Проверено 11 ноября 2020 г.
- ^ "Выборочная статистическая информация, рассчитанная в соответствии с Официальной статистической методологией оценки числа въездных и выездных туристских поездок – Ростуризм" [Selected statistical information calculated in accordance with the Official Statistical Methodology for Estimating the Number of Inbound and Outbound Tourist Trips – Rostourism]. tourism.gov.ru (in Russian). Federal Agency for Tourism (Russia) . Archived from the original on 22 January 2021 . Retrieved 11 November 2020 .
- ^ "Вице-премьер считает, что вклад туризма в ВВП России может вырасти в три раза за 10 лет" [Deputy Prime Minister believes that the contribution of tourism to Russia's GDP could triple in 10 years]. ТАСС (in Russian). TASS . 26 September 2020. Archived from the original on 3 October 2020 . Retrieved 11 November 2020 .
- ^ «Основные достижения туризма 2014 года» (PDF) . ЮНВТО (Всемирная туристская организация). 2014. Архивировано из оригинала (PDF) 12 января 2015 года . Проверено 20 января 2015 г.
- ^ Vlasov, Artem (17 December 2018). "Названы самые популярные достопримечательности России" [The most popular sights of Russia are named]. Izvestia (in Russian). Archived from the original on 17 December 2018 . Retrieved 15 December 2020 .
- ^ Перейти обратно: а б https://crsreports.congress.gov/product/pdf/IF/IF12066. Архивировано 18 июня 2023 г. в Wayback Machine. [ только URL ]
- ^ https://data.worldbank.org/indicator/NE.IMP.GNFS.ZS?most_recent_value_desc=false&locations=RU. Архивировано 4 января 2024 г. в Wayback Machine. [ только URL ]
- ^ «Подпись президента Обамы открывает путь к постоянным нормальным торговым отношениям с Россией и Молдовой» . ustr.gov . Архивировано из оригинала 2 февраля 2017 года . Проверено 27 января 2017 г.
- ^ «Российская Федерация | Группы SITC Rev2 | Экспорт в мир | 2015 | WITS | Данные» . wits.worldbank.org . Архивировано из оригинала 27 ноября 2020 года . Проверено 3 октября 2017 г.
- ^ Перейти обратно: а б с д «Российская Федерация – Краткий обзор торговли – Самые последние значения – WITS – Данные» . wits.worldbank.org . Архивировано из оригинала 22 ноября 2020 года . Проверено 4 октября 2017 г.
- ^ https://www.unescap.org/sites/default/d8files/knowledge-products/russian_Federation.pdf. Архивировано 26 июня 2023 г. в Wayback Machine. [ пустой URL PDF ]
- ^ Мельхиор, Арне (2019). «Россия в мировой торговле: между глобализмом и регионализмом» . Российский экономический журнал . 5 (4): 354–384. дои : 10.32609/j.ruje.5.49345 . HDL : 11250/2712033 . S2CID 210124625 . Архивировано из оригинала 18 июня 2023 года . Проверено 19 июня 2023 г.
- ^ «Открытые данные Всемирного банка» . Архивировано из оригинала 20 июня 2023 года . Проверено 19 июня 2023 г.
- ^ «Открытые данные Всемирного банка» . Архивировано из оригинала 18 июня 2023 года . Проверено 19 июня 2023 г.
- ^ «Торговая открытость» . Архивировано из оригинала 18 июня 2023 года . Проверено 19 июня 2023 г.
- ^ «Статистика слияний и поглощений по странам – Институт слияний, поглощений и альянсов (IMAA)» . Институт слияний, поглощений и альянсов (IMAA) . Архивировано из оригинала 27 ноября 2020 года . Проверено 27 февраля 2018 г.
Источники
 В данную статью включен текст из этого источника, находящегося в свободном доступе . Советский Союз: Страноведческое исследование . Федеральный исследовательский отдел .
 - Дэвис, Роберт Уильям (28 марта 1998 г.). Советское экономическое развитие от Ленина до Хрущева . Издательство Кембриджского университета. ISBN 978-0-521-62742-9 .
Дальнейшее чтение
- Алексеев, Майкл и Шломо Вебер, ред. Оксфордский справочник по российской экономике (Oxford UP, 2013) , отрывок .
- Ослунд, Андерс. Российский клановый капитализм: путь от рыночной экономики к клептократии (Yale University Press, 2019). отрывок
- Коннолли, Ричард. Российская экономика: очень краткое введение (2020 г.) , отрывок
- Густафсон, Тейн. Колесо фортуны: битва за нефть и власть в России (Harvard UP, 2012). отрывок
- Мейерс, Уильям Генри, Шмитц, Эндрю, ред. Переход к аграрной рыночной экономике: будущее Казахстана, России и Украины (2015)
- Миллер, Крис. Путиномика: власть и деньги в возрождающейся России (UNC Press Books, 2018). отрывок
- Мозер, Нат. Нефть и экономика России: от позднецарского к постсоветскому периоду (2017)
- Новокмет, Филип Томас Пикетти и Габриэль Зукман (2017). От Советов к олигархам: неравенство и собственность в России 1905–2016 гг.
- Зинченко Л.А. и др. «Основные особенности российской экономики и ее развития». Международный журнал прикладного бизнеса и экономических исследований 15.23 (2017): 265–272.
Внешние ссылки
- Министерство финансов Российской Федерации
- Министерство экономического развития (Россия)
- Сводная статистика Всемирного банка по торговле в России
- Профиль России в Всемирной книге фактов ЦРУ
- Профиль России во Всемирном банке