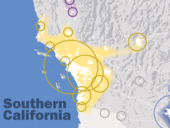
Большой Лос-Анджелес

Большой Лос-Анджелес
Лос-Анджелес – Лонг-Бич, Калифорния, CSA | |
|---|---|
 Urban areas
Counties in the Los Angeles MSA
Counties in the Los Angeles CSA but not the MSA | |
| Coordinates: 34°00′N 118°12′W / 34.0°N 118.2°W | |
| Country | United States |
| State | California |
| Principal city | Los Angeles |
| Other major cities | See list |
| Area | |
| • Urban | 2,281.0 sq mi (5,907.8 km2) |
| • Metro | 33,954 sq mi (87,940 km2) |
| Highest elevation | 11,503 ft (3,507 m) |
| Lowest elevation | 0 ft (0 m) |
| Population (2023)[2] | |
| • Megacity and combined statistical area | 18,422,600 |
| • Density | 541.1/sq mi (208.9/km2) |
| Ranked 2nd in the US | |
| GDP | |
| • Megacity and combined statistical area | $1.528 trillion (2022) |
| Time zone | UTC−8 (PST) |
| • Summer (DST) | UTC−7 (PDT) |
| Area codes | 213/323, 310/424, 562, 626, 661, 714/657, 760/442, 805/820, 818/747, 909/840, 949, 951 |


Los Angeles Metropolitan Area | |
|---|---|
| Los Angeles–Long Beach–Anaheim, CA MSA | |
 | |
| Coordinates: 34°03′N 118°15′W / 34.05°N 118.25°W | |
| Country | United States |
| State(s) | California |
| Largest city | Los Angeles |
| Area | |
| • Total | 4,850.3 sq mi (12,562 km2) |
| Highest elevation | Mount San Antonio 10,064 ft (3,069 m) |
| Lowest elevation | Wilmington −9 ft (−3 m) |
| Population (2023)[2] | |
| • Total | 12,872,322 |
| • Rank | 2nd in the U.S. |
| • Density | 2,654/sq mi (1,025/km2) |
| GDP | |
| • Total | $1.227 trillion (2022) |
| Time zone | UTC–8 (Pacific) |
| • Summer (DST) | UTC–7 (PDT) |


Большой Лос-Анджелес — самый густонаселенный мегаполис в штате Калифорния американском , охватывающий пять округов Южной Калифорнии, простирающихся от округа Вентура на западе до округа Сан-Бернардино и округа Риверсайд на востоке, с округом Лос-Анджелес в центре и Оринджем. Округ на юго-востоке. Лос-Анджелеса-Анахайма-Риверсайда Объединенная статистическая территория (CSA) занимает площадь 33 954 квадратных миль (87 940 км ). 2 ), что делает его крупнейшим мегаполисом в Соединенных Штатах по площади. Непрерывная городская территория составляет 2281 квадратных миль (5910 км2). 2 ), [ 1 ] тогда как остальная часть в основном состоит из горных и пустынных территорий. При населении в 18,4 миллиона человек в 2024 году [ 2 ] Это второй по величине мегаполис в стране после Нью-Йорка , а также один из крупнейших мегаполисов в мире . [ 6 ]
Помимо того, что Большой Лос-Анджелес является связующим звеном мировой индустрии развлечений, включая фильмы, телевидение и музыку, он также является важным центром международной торговли, образования, средств массовой информации, бизнеса, туризма, технологий и спорта. [ 7 ] Это третий по величине мегаполис в мире по номинальному ВВП с объемом производства, превышающим 1 триллион долларов США, после Нью-Йорка и Токио .
There are three contiguous component urban areas in Greater Los Angeles: the Inland Empire, which can be broadly defined as Riverside and San Bernardino counties; the Ventura/Oxnard metropolitan area (Ventura County); and the Los Angeles metropolitan area (also known as Metropolitan Los Angeles or Metro LA) consisting of Los Angeles and Orange counties only. The Census Bureau designates the latter as the Los Angeles–Long Beach–Anaheim metropolitan statistical area (MSA), the fourth largest metropolitan area in the western hemisphere and the second-largest metropolitan area in the United States, by population of 13 million as of the 2020 U.S. census. It has a total area of 4,850 square miles (12,561 km2). Although San Diego–Tijuana borders the Greater Los Angeles area at San Clemente and Temecula, it is not part of it as the two urban areas are not geographically contiguous due to the presence of Camp Pendleton. However, both form part of the Southern California Megalopolis which extends into Tijuana, Baja California, Mexico. Throughout the 20th century, Greater Los Angeles was one of the fastest-growing regions in the United States, but growth has slowed since 2000.
Definitions
[edit]
| Area (km2) | Population (2024) | GDP (million US$) | |
|---|---|---|---|
| Los Angeles–Long Beach–Anaheim, CA (MSA) | 12,580 | 12,974,926[8] | 1,227,469[3] |
| Riverside–San Bernardino–Ontario, CA (MSA) | 70,610 | 4,623,811[8] | 237,913[4] |
| Oxnard–Thousand Oaks–Ventura, CA (MSA) | 4,770 | 823,863[8] | 62,239[5] |
| Los Angeles–Long Beach, CA CSA | 87,960 | 18,422,600 | 1,527,621 |
Los Angeles metropolitan area
[edit]The Los Angeles metropolitan area is defined by the U.S. Office of Management and Budget as the Los Angeles–Long Beach–Anaheim, CA Metropolitan Statistical Area (MSA),[9] with a 2021 population of 12,997,353.[8] The MSA is in turn made up of two "metropolitan divisions":
- Los Angeles–Long Beach–Glendale, CA Metropolitan Division, coterminous with Los Angeles County (2021 population 9,829,544)
- Anaheim–Santa Ana–Irvine, CA Metropolitan Division, coterminous with Orange County (2021 population 3,167,809)
The MSA is the most populous metropolitan area in the Western United States and second-most populous in the United States. It has at its core the Los Angeles–Long Beach–Anaheim urban area, which had a population of 12,237,376 as of the 2020 census.[10]
Greater Los Angeles
[edit]The U.S. Census Bureau also defines a wider commercial region based on commuting patterns, the Los Angeles–Long Beach, CA Combined Statistical Area (CSA), more commonly known as the Greater Los Angeles Area, with an estimated population of 18,422,600 in 2024.[8] The total land area of the CSA is 33,955 sq. mi (87,945 km2).
The CSA consists of three component metropolitan areas:
- The Los Angeles–Long Beach–Anaheim, CA MSA (2021 pop. 12,997,353)
- The Oxnard–Thousand Oaks–Ventura, CA MSA, coterminous with Ventura County (2021 pop. 839,784)
- The Riverside–San Bernardino–Ontario, CA MSA (2021 pop. 4,653,105), consisting of:
- Riverside County, California (2021 pop. 2,458,395)
- San Bernardino County, California (2021 pop. 2,194,710)
History
[edit]Nearly all of the metropolitan area of Greater Los Angeles is located within the homelands of the Tongva, otherwise referred to as Tovaangar.[11][12]
Geography
[edit]Urban form
[edit]
Los Angeles has long been famous for its sprawl, but this has to do more with its status in history as the "poster child" of large cities that grew up with suburban-style patterns of development, rather than how it ranks in sprawl among American metro areas today, now that suburban and exurban-style development is present across the country.[13] The Los Angeles–Orange County metro area was the most densely populated "urbanized area" (as defined by the United States Census Bureau) in the United States in 2000, with 7,068 inhabitants per square mile (2,729/km2).[14] For comparison, the "New York–Newark" Urbanized Area had a population density of 5,309 per square mile (2,050/km2).
Los Angeles' reputation for sprawl is due to the fact that the city grew from relative obscurity to one of the country's ten largest cities (i.e. 10th largest city in 1920), at a time when suburban patterns of growth first became possible due to electric streetcars and automobiles. The city was also the first large American city where, in the 1920s, major clusters of regional employment, shopping, and culture were already being built outside the traditional downtown areas – in edge cities such as Mid-Wilshire, Miracle Mile and Hollywood. This pattern of growth continued ever outward, more so when the freeway system was built starting in the 1950s; thus Greater Los Angeles was the earliest large American metropolitan area with a decentralized structure. Its major commercial, financial, and cultural institutions are geographically dispersed rather than being concentrated in a single downtown or central area. Also, the population density of Los Angeles proper is low (approximately 8,300 people per square mile) when compared to some other large American cities such as New York City (27,500), San Francisco (17,000), Boston (13,300), and Chicago (11,800).[15] Densities are particularly high within a 5-mile radius of downtown, where some neighborhoods exceed 20,000 people per square mile.[16] What gives the entire Los Angeles metro region a high density is the fact that many of the city's suburbs and satellite cities have high density rates.[17] Within its urbanized areas, Los Angeles is noted for having small lot sizes and low-rise buildings. Buildings in the area are low when compared to other large cities, mainly due to zoning regulations. Los Angeles became a major city just as the Pacific Electric Railway spread population to smaller cities much as interurbans did in East Coast cities. In the first decades of the twentieth century, the area was marked by a network of fairly dense but separate cities linked by rail. The ascendance of the automobile helped fill in the gaps between these commuter towns with lower-density settlements.[18]
Starting in the early twentieth century, there was a large growth in population on the western edges of the city moving to the San Fernando Valley and out into the Conejo Valley in eastern Ventura County. Many working-class whites migrated to this area during the 1960s and 1970s out of East and Central Los Angeles.[19] As a result, there was a large growth in population into the Conejo Valley and into Ventura County through the US 101 corridor. Making the US 101 a full freeway in the 1960s and expansions that followed helped make commuting to Los Angeles easier and opened the way for development westward. Development in Ventura County and along the US 101 corridor remains controversial, with open-space advocates battling those who feel business development is necessary to economic growth.[20] Although the area still has abundant amount of open space and land, almost all of it was put aside and mandated never to be developed as part of the master plan of each city. Because of this, the area which was once a relatively inexpensive area to buy real estate, saw rising real estate prices well into the 2000s.[21] Median home prices in the Conejo Valley for instance, ranged from $700,000 to $2.2 million in 2003.[22] According to Forbes, "it's nearly impossible" to find reasonably priced real estate in California, and the prices will continue to increase.[23]
The Los Angeles area continues to grow, principally on the periphery where new, cheaper, undeveloped areas are being sought.[24] As such, in these areas, populations as well as housing prices exploded, although the housing bubble popped late in the decade of the 2000s. Riverside and San Bernardino Counties, which contain large swaths of desert, attracted most of the population increase between 2000 and 2006. Growth continues not only outside the existing urbanized area but also adjacent to existing development in the central areas.[25] As in virtually all US core cities, there is now vigorous residential development in the downtown area with both new buildings and renovation of former office buildings. The Los Angeles Downtown News keeps a list of ongoing development projects, updated every quarter.[26] Over the course of the 21st century, droughts and wildfires have increased in frequency and the region's water security has become a development issue.[27]

Major business districts and edge cities
[edit]Greater Los Angeles has numerous traditional downtowns or central business districts, the largest being Downtown Los Angeles. Other important ones are Downtown Long Beach, downtown Pasadena, downtown Glendale, and downtown Burbank, and – with their county, state and federal government facilities – Downtown Santa Ana, Downtown Anaheim, Downtown Riverside, Downtown San Bernardino, downtown Irvine, and downtown Ontario.
However, most of the commercial activity (office space, retail, hotels, entertainment) is found outside traditional downtowns, among the suburban-style development in clusters known as edge cities. In fact, the Los Angeles area is considered the classic example of a metropolitan area that developed in this pattern, because it did so early in history, starting in the 1920s, and was the city to enter into the top ten of American cities while growing in this pattern.[28]
Identity
[edit]Employment is not only in the downtown area, but consistently occurs outside the central core. As such, many people commute throughout the city and suburbs in various directions for their work and daily activities, with a large portion heading to the municipalities that are outside the city of Los Angeles.[29]
Unlike most metropolitan areas, regional identity remains a contentious issue in the Greater Los Angeles area, with many residents not acknowledging any association with the region as a whole. For example, while Los Angeles County and Orange County together make up the smaller MSA region, the two host many sub-areas that each have sharp demographic, political, and financial distinctions. South Orange County residents often attempt to be identified apart from Los Angeles although they make up the same metropolitan area. Also, while only 1.63% of Los Angeles residents commute to Orange County for work, over 6% of Orange County commuters head to Los Angeles for work.[30] Western Riverside County and San Bernardino County have become commuter regions characteristic of other suburban counties throughout the nation. Residents in these counties often commute to Los Angeles County and Orange County for employment.[31]
Component counties, subregions, and cities
[edit]
Los Angeles County
[edit]Los Angeles County, of which the City of Los Angeles is the county seat, is the most populous county in the United States and is home to over a quarter of all California residents.[32] The large size of the city of Los Angeles, as well as its history of annexing smaller towns, has made city boundaries in the central area of Los Angeles County quite complicated.[33] Many cities are completely surrounded by the city of Los Angeles and are often included in the city's areas despite being independent municipalities. For example, Santa Monica and Beverly Hills (which is almost completely surrounded by Los Angeles) are considered part of the Westside, while Hawthorne and Inglewood are associated with South L.A. Adjacent areas that are outside the actual city boundaries of incorporated Los Angeles but border the city itself include the Santa Clarita Valley, the San Gabriel Valley, South Bay, and the Gateway Cities.
Despite the large footprint of the city of Los Angeles, a majority of the land area within Los Angeles County is unincorporated and under the primary jurisdiction of Los Angeles County. Much of this land, however, cannot be easily developed due to planning challenges presented by geographic features such as the Santa Monica Mountains, the San Gabriel Mountains, and the Mojave Desert. Actual land development in these regions occurs on the fringes of incorporated cities, some of which have been fully developed, such as the cities of Palmdale and Lancaster.
Subregions in Los Angeles County
[edit]While there is not an official designation for the regions that comprise Greater Los Angeles, one authority, the Los Angeles Times, divides the area into the following regions:[34]
- Angeles Forest
- Antelope Valley
- Central L.A. (Downtown Los Angeles, Hollywood, Mid-Wilshire, etc.)
- Eastside
- Gateway Cities/Harbor Area
- Northeast L.A. (Highland Park, Eagle Rock, etc.)
- Northwest L.A. County (including the Santa Clarita Valley)
- Pomona Valley (partially in San Bernardino County)
- San Fernando Valley
- San Gabriel Valley
- Santa Clarita Valley
- Santa Monica Mountains (Malibu, Topanga, etc.)
- South Bay (incl. Palos Verdes Peninsula, Beach Cities)
- South Los Angeles
- Southeast Los Angeles County (including Norwalk and Whittier, see Gateway Cities)
- The Verdugos (including Glendale, Pasadena and the Crescenta Valley)
- Westside
Some of the above areas can be defined as being bounded by natural features such as mountains or the ocean; others are marked by city boundaries, freeways, or other constructed landmarks. For example, Downtown Los Angeles is the area of Los Angeles roughly enclosed by three freeways and one river: the Harbor Freeway (SR 110) to the west, the Santa Ana Freeway (US 101) to the north, the Los Angeles River to the east, and the Santa Monica Freeway (I-10) to the south.[35] Meanwhile, the San Fernando Valley ("The Valley") is defined as the basin consisting of the part of Los Angeles and its suburbs that lie north-northwest of downtown and is ringed by mountains.[36]
Edge cities in Los Angeles County
[edit]Central and Western area
[edit]- Beverly Hills/Century City
- LAX/El Segundo[28]
- Marina Del Rey/Culver City[28]
- West Los Angeles
- Mid-Wilshire[28]
- Miracle Mile[28]
San Fernando Valley
[edit]- Burbank/North Hollywood[28]
- Sherman Oaks/Van Nuys, Los Angeles[28]
- Warner Center, Los Angeles/West Valley[28]
Elsewhere in Los Angeles County
[edit]- Pasadena[28]
- South Bay/Torrance/Carson[28]
- South Valley/Covina (emerging edge city as of 1991)[28]
- Santa Clarita (emerging edge city as of 1991)[28]
Cities in Los Angeles County
[edit]With a population of nearly 3.9 million people at the 2020 census, the City of Los Angeles is the second most populous city in the United States after New York City, and is the focal point of the Greater Los Angeles Area.[37] As an international center for finance, entertainment, media, culture, education, tourism, and science, Los Angeles is considered one of the world's most powerful and influential global cities.[38]
List of the 88 cities of Los Angeles County and six large CDPs by population at the 2020 U.S. census:
- Los Angeles (3,898,747)
- Long Beach (466,742)
- Santa Clarita (228,673)
- Glendale (196,543)
- Lancaster (173,516)
- Palmdale (169,450)
- Pomona (151,713)
- Torrance (147,067)
- Pasadena (138,699)
- East Los Angeles CDP (118,786)
- Downey (114,355)
- West Covina (109,501)
- El Monte (109,450)
- Inglewood (107,762)
- Burbank (107,337)
- Norwalk (102,773)
- Compton (95,740)
- Carson (95,558)
- Santa Monica (93,076)
- South Gate (92,726)
- Hawthorne (88,083)
- Whittier (87,306)
- Alhambra (82,868)
- Lakewood (82,496)
- Bellflower (79,190)
- Baldwin Park (72,176)
- Redondo Beach (71,576)
- Lynwood (67,265)
- Montebello (62,640)
- Pico Rivera (62,088)
- Florence-Graham CDP (61,983)
- Monterey Park (61,096)
- Gardena (61,027)
- Arcadia (56,681)
- South Whittier CDP (56,415)
- Diamond Bar (55,072)
- Huntington Park (54,883)
- Hacienda Heights CDP (54,191)
- Paramount (53,733)
- Glendora (52,558)
- Covina (51,268)
- Rosemead (51,185)
- Azusa (50,000)
- Cerritos (49,578)
- Rowland Heights CDP (48,231)
- La Mirada (48,008)
- Altadena CDP (42,846)
- Rancho Palos Verdes (42,287)
- Culver City (40,779)
- San Gabriel (39,568)
- Bell Gardens (39,501)
- La Puente (38,062)
- Monrovia (37,931)
- Claremont (37,266)
- Temple City (36,494)
- West Hollywood (35,757)
- Manhattan Beach (35,506)
- San Dimas (34,924)
- Bell (33,559)
- Beverly Hills (32,701)
- Lawndale (31,807)
- La Verne (31,334)
- Walnut (28,430)
- South Pasadena (26,943)
- Maywood (25,138)
- San Fernando (23,946)
- Calabasas (23,241)
- Cudahy (22,811)
- Duarte (21,727)
- Lomita (20,921)
- La Cañada Flintridge (20,573)
- Agoura Hills (20,299)
- Hermosa Beach (19,728)
- South El Monte (19,567)
- Santa Fe Springs (19,219)
- El Segundo (17,272)
- Artesia (16,395)
- Hawaiian Gardens (14,149)
- Palos Verdes Estates (13,347)
- San Marino (12,513)
- Commerce (12,378)
- Signal Hill (11,848)
- Sierra Madre (11,268)
- Malibu (10,654)
- Rolling Hills Estates (8,280)
- Westlake Village (8,029)
- La Habra Heights (5,682)
- Avalon (3,460)
- Rolling Hills (1,739)
- Hidden Hills (1,725)
- Irwindale (1,472)
- Bradbury (921)
- Industry (264)
- Vernon (222)
Orange County
[edit]
Orange County was originally an agricultural area dependent on citrus crops, avocados, and oil extraction, and became a bedroom community for Los Angeles when I–5, the Santa Ana Freeway, linked it to the city in the 1950s. The growth of Los Angeles initially fueled population growth in Orange County, but by the 1970s it had become an important economic center in its own right, with tourism and electronics industries, among others. Today, Orange County is known for its tourist attractions, such as Disneyland, Knott's Berry Farm, its several pristine beaches and coastline, and its wealthier areas, featured in television shows such as The O.C. None of the original downtowns serves as the central urban core for the county, but there are important clusters of business and culture in Downtown Santa Ana and in three edge cities: the Anaheim–Santa Ana edge city from Disneyland to the Orange Crush interchange (Orange, Santa Ana), the South Coast Plaza–John Wayne Airport edge city (Santa Ana, Costa Mesa, Irvine), and Irvine's Spectrum edge city.

Orange County is sometimes figuratively divided into "North County" and "South County", with North Orange County including cities such as Anaheim, Fullerton, and Santa Ana, and is the older, more ethnically diverse and more densely built-up area closer to Los Angeles. South County, defined variously as beginning with either Costa Mesa[39] or Irvine[40] and includes cities to the east and south such as Laguna Beach, Mission Viejo, Newport Beach, and San Clemente, is more residential, affluent, recently developed, and has a mostly white population. Irvine is an exception, as it is a center of employment and is ethnically diverse. A growing alternative dividing marker between north and south is the El Toro Y interchange. Orange Coast or South Coast area is defined instead as consisting of some or all of the cities lining the coast.
Subregions in Orange County
[edit]Edge cities in Orange County
[edit]- Anaheim–Santa Ana edge city[28]
- Fullerton/La Habra/Brea (emerging edge city as of 1991)[28]
- Irvine Spectrum[28]
- Newport Center/Fashion Island (emerging edge city as of 1991)[28]
- San Clemente/Laguna Niguel (emerging edge city as of 1991)[28]
- South Coast Plaza–John Wayne Airport edge city[28]
- Westminster/Huntington Beach[28]
Cities in Orange County
[edit]List of the 34 cities in Orange County by population at the 2020 census:
- Anaheim (346,824)
- Santa Ana (310,227)
- Irvine (307,670)
- Huntington Beach (198,711)
- Garden Grove (171,949)
- Fullerton (143,617)
- Orange (139,911)
- Costa Mesa (111,918)
- Mission Viejo (93,653)
- Westminster (90,911)
- Lake Forest (85,858)
- Newport Beach (85,239)
- Buena Park (84,034)
- Tustin (80,276)
- Yorba Linda (68,336)
- Laguna Niguel (64,355)
- San Clemente (64,293)
- La Habra (63,097)
- Fountain Valley (57,047)
- Aliso Viejo (52,176)
- Placentia (51,824)
- Cypress (50,151)
- Rancho Santa Margarita (47,949)
- Brea (47,325)
- Stanton (37,962)
- San Juan Capistrano (35,196)
- Dana Point (33,107)
- Laguna Hills (31,374)
- Seal Beach (25,242)
- Laguna Beach (23,032)
- Laguna Woods (17,644)
- La Palma (15,581)
- Los Alamitos (11,780)
- Villa Park (5,843)
Inland Empire
[edit]
The Inland Empire, consisting of San Bernardino and Riverside Counties, contains fast-growing suburbs of the region, with a large to majority percentage of the working population commuting to either Los Angeles or Orange Counties for work. Originally an important center for citrus production, the region became an important industrial area by the early 20th century.[41][42][43] The Inland Empire also became a key transportation center following the completion of Route 66, and later Interstate 10. With the post-World War II economic boom leading to rapid development in Los Angeles and Orange Counties, land developers bulldozed acres of agricultural land to build suburbs in order to accommodate the Los Angeles area's expanding population.[41] The development of a regional freeway system facilitated the expansion of suburbs and human migration linking the Inland Empire and rest of Greater Los Angeles. Despite being primarily suburban, the Inland Empire is also home to important warehousing, shipping, logistics and retail industries, centered on the subregion's major cities of Riverside, San Bernardino and Ontario.
While the Inland Empire is sometimes defined as the entirety of San Bernardino and Riverside Counties, the eastern undeveloped, desert portions of these counties are not considered to be part of Greater Los Angeles. The state of California defines this area to include the cities of Adelanto, Apple Valley, and Victorville to the north, the Riverside–San Diego county line to the south, and the towns of Anza, Idyllwild, and Lucerne Valley, along with the San Bernardino National Forest to the east.[44]
Additionally, the southwest portion of Riverside County, centered on the city of Temecula is more economically linked to San Diego county, with its growth largely being driven by migrants from San Diego seeking more affordable housing similar to how northwestern Riverside county's growth was driven by migrants from Orange County and Los Angeles seeking more affordable housing.[45][46]
However, with clear northern and southern limits to expansion, the region's urban eastern boundaries have become increasingly nebulous as suburban sprawl continues to spread out to form a unified whole with Los Angeles, with further development encroaching past the San Bernardino and San Jacinto Mountains and into the outlying desert areas. As a result, the regional definition of Greater Los Angeles can now be extended to include Barstow and surrounding towns in the northeast, the Morongo Basin in the east-central including Yucca Valley and Twentynine Palms, and the Coachella Valley cities in the southeast. This interconnectivity, provided by one of the most extensive freeway systems in the world, as well as economic, social and media ties, has blended boundaries between these regions and the urbanized Los Angeles and Inland Empire areas.[47]
Subregions in the Inland Empire
[edit]- High Desert (includes Antelope Valley in Los Angeles County plus Victor Valley and Morongo Basin)
- Low Desert (Coachella Valley, Palm Springs and Palm Desert area)
- San Bernardino Mountains (Lake Arrowhead and Big Bear Lake area)
- Northwest Riverside County (Corona, Norco, Jurupa Valley, and Riverside area)
- Moreno Valley (Moreno Valley and Perris)
- Pomona Valley (Pomona, Rancho Cucamonga, Chino, Eastvale, Upland, Claremont, Montclair, La Verne and Ontario area. Partially in Los Angeles County)
- San Bernardino Valley (San Bernardino, Fontana, Rialto, Colton, Loma Linda, Highland, and Redlands area)
- San Gorgonio Pass (Banning, Yucaipa, Calimesa, and Beaumont area)
- San Jacinto Valley (Hemet and San Jacinto area)
- Temecula Valley (Lake Elsinore, Menifee, Murrieta, Wildomar, and Temecula area)
Edge cities in the Inland Empire
[edit]- Ontario Airport/Rancho Cucamonga[28]
- Riverside (emerging edge city as of 1991)[28]
- San Bernardino (emerging edge city as of 1991)[28]
Cities in Riverside County
[edit]List of the 28 cities of Riverside County by population at the 2020 U.S. census:
- Riverside (314,998)
- Moreno Valley (208,634)
- Corona (157,136)
- Murrieta (110,949)
- Temecula (110,003)
- Jurupa Valley (105,053)
- Menifee (102,527)
- Hemet (89,833)
- Indio (89,137)
- Perris (78,700)
- Lake Elsinore (70,265)
- Eastvale (69,757)
- San Jacinto (53,898)
- Beaumont (53,036)
- Cathedral City (51,493)
- Palm Desert (51,163)
- Palm Springs (44,575)
- Coachella (41,941)
- La Quinta (37,558)
- Wildomar (36,875)
- Desert Hot Springs (32,512)
- Banning (29,505)
- Norco (26,316)
- Blythe (18,317)
- Rancho Mirage (16,999)
- Canyon Lake (11,082)
- Calimesa (10,026)
- Indian Wells (4,757)
Cities and towns in San Bernardino County
[edit]List of the 24 cities and incorporated towns of San Bernardino County by population at the 2020 U.S. census:
- San Bernardino (222,101)
- Fontana (208,393)
- Ontario (175,265)
- Rancho Cucamonga (174,453)
- Victorville (134,810)
- Rialto (104,026)
- Hesperia (99,818)
- Chino (91,403)
- Upland (79,040)
- Chino Hills (78,411)
- Redlands (73,168)
- Apple Valley (75,791)
- Highland (56,999)
- Yucaipa (54,542)
- Colton (53,909)
- Adelanto (38,046)
- Montclair (37,865)
- Twentynine Palms (28,065)
- Barstow (25,415)
- Loma Linda (24,791)
- Yucca Valley (21,738)
- Grand Terrace (13,150)
- Big Bear Lake (5,046)
- Needles (4,931)
Sparsely populated areas in the Inland Empire
[edit]While the above areas are included in the regional definition of Greater Los Angeles, the U.S. Census Bureau defines Greater Los Angeles, or officially, the Los Angeles–Long Beach Combined Statistical Area, to include both the above-mentioned areas along with the entirety of San Bernardino and Riverside counties.[48] These areas are sparsely developed and are part of the Mojave and Colorado Deserts. To the north, Interstate 15 crosses desolate desert landscape after passing Barstow, linking Greater Los Angeles with Las Vegas, with Baker being the only significant outpost along the route. To the east, lie the Mojave National Preserve and Joshua Tree National Park along with the towns of Needles and Blythe on the California-Arizona border.
Ventura County
[edit]
Ventura County is mostly suburban and rural and also has developed primarily through the growth of Los Angeles. Central and southern Ventura County formerly consisted of small towns along the Pacific Coast until the expansion of U.S. Route 101 drew in commuters from the San Fernando Valley. Master-planned cities soon began developing, and the county became increasingly urbanized. The northern part of the county, however, remains largely undeveloped and is mostly within the Los Padres National Forest.
Subregions in Ventura County
[edit]Edge cities in Ventura County
[edit]Cities in Ventura County
[edit]List of the 10 cities of Ventura County by population at the 2020 U.S. census:
- Oxnard (202,063)
- Thousand Oaks (126,966)
- Simi Valley (126,356)
- Ventura (110,763)
- Camarillo (70,741)
- Moorpark (36,284)
- Santa Paula (30,657)
- Port Hueneme (21,954)
- Fillmore (16,419)
- Ojai (7,637)
Urban areas within
[edit]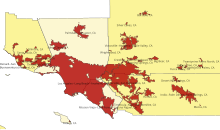
At the core of the Los Angeles–Long Beach combined statistical area (CSA) lies the Los Angeles–Long Beach–Anaheim, CA urban area, the second most populous in the United States.[10] Within the boundaries of the CSA the Census Bureau defines 30 other urban areas as well, two of which (Riverside–San Bernardino and Oxnard–Ventura) form the core of their own metropolitan areas separate from the Los Angeles metropolitan statistical area. Urban areas situated primarily outside the Los Angeles metropolitan statistical area but within the CSA are identified with a cross (†) in the table below.
| Urban area | Population (2020 census) |
Land area (sq mi) |
Land area (km2) |
Density (population / sq mi) |
Density (population / km2) |
|---|---|---|---|---|---|
| Los Angeles–Long Beach–Anaheim, CA | 12,237,376 | 1,636.83 | 4,239.36 | 7,476.28 | 2,886.61 |
| Riverside–San Bernardino, CA † | 2,276,703 | 608.56 | 1,576.17 | 3,741.10 | 1,444.45 |
| Mission Viejo–Lake Forest–Laguna Niguel, CA | 646,843 | 163.63 | 423.81 | 3,953.02 | 1,526.27 |
| Temecula–Murrieta–Menifee, CA † | 528,991 | 150.47 | 389.73 | 3,515.49 | 1,357.34 |
| Oxnard–San Buenaventura (Ventura), CA † | 376,117 | 76.61 | 198.41 | 4,909.70 | 1,895.65 |
| Indio–Palm Desert–Palm Springs, CA † | 361,075 | 151.82 | 393.22 | 2,378.26 | 918.25 |
| Palmdale–Lancaster, CA | 359,559 | 84.78 | 219.59 | 4,240.90 | 1,637.42 |
| Victorville–Hesperia–Apple Valley, CA † | 355,816 | 131.77 | 341.29 | 2,700.19 | 1,042.55 |
| Santa Clarita, CA | 278,031 | 77.85 | 201.62 | 3,571.56 | 1,378.99 |
| Thousand Oaks, CA † | 213,986 | 80.20 | 207.71 | 2,668.26 | 1,030.22 |
| Hemet, CA † | 173,194 | 37.06 | 95.98 | 4,673.61 | 1,804.49 |
| Simi Valley, CA † | 127,364 | 31.63 | 81.91 | 4,027.01 | 1,554.84 |
| Camarillo, CA † | 76,338 | 22.48 | 58.22 | 3,395.98 | 1,311.19 |
| Desert Hot Springs, CA † | 45,767 | 14.08 | 36.47 | 3,250.66 | 1,255.09 |
| Santa Paula, CA † | 30,675 | 4.96 | 12.86 | 6,179.04 | 2,385.74 |
| Barstow, CA † | 30,522 | 12.38 | 32.07 | 2,465.05 | 951.76 |
| Crestline–Lake Arrowhead, CA † | 22,272 | 16.85 | 43.64 | 1,321.70 | 510.31 |
| Yucca Valley, CA † | 18,293 | 11.33 | 29.36 | 1,613.95 | 623.15 |
| Big Bear, CA † | 16,498 | 15.93 | 41.26 | 1,035.73 | 399.90 |
| Fillmore, CA † | 16,397 | 2.63 | 6.82 | 6,227.80 | 2,404.57 |
| Twentynine Palms, CA † | 12,881 | 6.82 | 17.66 | 1,889.13 | 729.40 |
| Blythe, CA–AZ † | 11,780 | 6.20 | 16.06 | 1,899.83 | 733.53 |
| Twentynine Palms North, CA † | 11,665 | 2.77 | 7.18 | 4,206.03 | 1,623.96 |
| Fort Irwin, CA † | 8,096 | 3.62 | 9.37 | 2,238.42 | 864.26 |
| Mecca, CA † | 6,875 | 0.63 | 1.62 | 10,979.30 | 4,239.13 |
| Needles, CA–AZ † | 6,739 | 5.55 | 14.38 | 1,213.99 | 468.73 |
| Silver Lakes, CA † | 5,908 | 2.12 | 5.49 | 2,789.52 | 1,077.04 |
| Running Springs, CA † | 5,313 | 3.64 | 9.44 | 1,458.40 | 563.09 |
| Joshua Tree, CA † | 4,370 | 3.80 | 9.85 | 1,149.11 | 443.67 |
| Wrightwood, CA † | 3,927 | 1.38 | 3.59 | 2,835.51 | 1,094.80 |
| Avalon, CA | 3,362 | 1.19 | 3.08 | 2,826.47 | 1,091.31 |

Demographics
[edit]| Census | Pop. | Note | %± |
|---|---|---|---|
| 1900 | 250,187 | — | |
| 1910 | 648,316 | 159.1% | |
| 1920 | 1,150,252 | 77.4% | |
| 1930 | 2,597,066 | 125.8% | |
| 1940 | 3,252,720 | 25.2% | |
| 1950 | 4,934,246 | 51.7% | |
| 1960 | 7,751,616 | 57.1% | |
| 1970 | 9,981,942 | 28.8% | |
| 1980 | 11,497,486 | 15.2% | |
| 1990 | 14,531,529 | 26.4% | |
| 2000 | 16,373,645 | 12.7% | |
| 2010 | 17,877,006 | 9.2% | |
| 2020 | 18,644,680 | 4.3% | |
| 2023 (est.) | 18,422,600 | −1.2% | |
| U.S. Census Bureau[49] | |||
According to the 2020 census, there were 18,644,680 people living in the Greater Los Angeles Area. The racial makeup of the area was 29.4% White (23.0% Non-Hispanic European and 6.4% Non-Hispanic Middle Eastern), 13.8% Asian (Non-Hispanic), 0.2% Pacific Islander (Non-Hispanic), 6.1% African American (Non-Hispanic), 0.2% Native American (Non-Hispanic), 0.5% from other races (Non-Hispanic), and 3.3% from two or more races (Non-Hispanic). 46.3% of the population were Hispanic of any race, a super-majority of which was of Mexican origin.[50] 29.4% of the population (5.5 million) was foreign born; most immigrants came from Latin America and Asia.[51]
The explosive growth of the region in the 20th century can be attributed to its favorable Mediterranean climate, the availability of land and many booming industries such as oil, automobile and rubber, motion pictures, intermodal, logistics, and aerospace which in turn attracted millions of people from all over the United States and world.[citation needed] Citrus production was important to the region's development in the earlier part of the 20th century.[52]

While the New York metropolitan area is presently the most populous metropolitan area in the United States, it has been predicted in the past that Greater Los Angeles will eventually surpass Greater New York in population.[citation needed] Whether this will happen is yet to be seen, but past predictions on this event have been off the mark. A 1966 article in Time predicted Greater Los Angeles would surpass New York by 1975, and that by 1990, would reach close to the 19 million mark.[53] But the article's flawed definition of Greater Los Angeles included San Diego, which is actually its own metropolitan area. A 1989 article in The New York Times predicted Greater Los Angeles would surpass Greater New York by 2010,[54] but the article predicted the population would be 18.3 million in that year, a number Greater New York already surpassed in 2007 by half a million people. By 2009, the New York metropolitan area had a population of 22.2 million compared to the Greater Los Angeles Area's 18.7 million, about a 3.56 million persons difference.[55] Percentage growth, however, has been higher in Greater Los Angeles over the past few decades than in Greater New York.
Demographics of Los Angeles and Orange counties
[edit]| County | 2021 Estimate | 2020 Census | Change | Area | Density |
|---|---|---|---|---|---|
| Los Angeles County | 9,829,544 | 10,014,009 | −1.84% | 4,057.88 sq mi (10,509.9 km2) | 2,422/sq mi (935/km2) |
| Orange County | 3,167,809 | 3,186,989 | −0.60% | 790.57 sq mi (2,047.6 km2) | 4,007/sq mi (1,547/km2) |
| Total | 12,997,353 | 13,200,998 | −1.54% | 4,848.45 sq mi (12,557.4 km2) | 2,681/sq mi (1,035/km2) |
| Census | Pop. | Note | %± |
|---|---|---|---|
| 1890 | 115,043 | — | |
| 1900 | 189,994 | 65.2% | |
| 1910 | 538,567 | 183.5% | |
| 1920 | 997,830 | 85.3% | |
| 1930 | 2,327,166 | 133.2% | |
| 1940 | 2,916,403 | 25.3% | |
| 1950 | 4,367,911 | 49.8% | |
| 1960 | 6,742,696 | 54.4% | |
| 1970 | 8,462,366 | 25.5% | |
| 1980 | 9,410,130 | 11.2% | |
| 1990 | 11,273,720 | 19.8% | |
| 2000 | 12,365,627 | 9.7% | |
| 2010 | 12,828,837 | 3.7% | |
| 2020 | 13,200,998 | 2.9% | |
| 2023 (est.) | 12,799,100 | −3.0% | |
| State Census data [56] | |||
Age and gender
[edit]According to the 2009 American Community Survey, the Los Angeles Metropolitan Area had a population of 12,874,797, of which 6,402,498 (49.7% of the population) were male and 6,472,299 (50.3% of the population) were female. The age composition is shown in the table at right.
| Age distribution Los Angeles and Orange Counties, 2009 | |
|---|---|
| Age | % of pop. |
| Under 5 | 7.3% |
| 5 to 9 | 6.6% |
| 10 to 14 | 7.0% |
| 15 to 19 | 7.2% |
| 20 to 24 | 7.0% |
| 25 to 34 | 15.5% |
| 35 to 44 | 14.8% |
| 45 to 54 | 13.9% |
| 55 to 59 | 5.5% |
| 60 to 64 | 4.4% |
| 65 to 74 | 5.6% |
| 75 to 84 | 3.6% |
| 85 and over | 1.6% |
| Median age | 34.6 |
Median age: 34.6 years
Race
[edit]According to the 2020 census, there were 18,644,680 people living in the Greater Los Angeles Area. The racial makeup of the area was 29.4% White (23.0% Non-Hispanic European and 6.4% Non-Hispanic Middle Eastern), 13.8% Asian (Non-Hispanic), 0.2% Pacific Islander (Non-Hispanic), 6.1% African American (Non-Hispanic), 0.2% Native American (Non-Hispanic), 0.5% from other races (Non-Hispanic), and 3.3% from two or more races (Non-Hispanic). 46.3% of the population were Hispanic of any race, a super-majority of which was of Mexican origin.[50]

Non-Hispanic whites make up under one-third (29.4%) of the population, approximately 5,477,462 residents. The top European ancestries were German: 7.0% (1,301,202), English: 6.1% (1,131,426), Irish: 5.4% (1,002,233), Italian: 3.4% (624,585), Scandinavian: 2.2% (405,887), French: 1.5% (284,180), Scottish: 1.4% (264,429), Polish: 1.2% (224,443), and Russian: 1.0% (189,115). The top Middle Eastern ancestries were Jewish: 3.2% (600,000), Armenian: 1.2% (214.190), Arab: 0.98% (182,934), and Iranian: 0.75% (139,632). Additionally, 3.3% (611,193) of residents identified as simply American. Values may add to over 100% because people can identify with more than one ethnicity.
Approximately 2,577,706 residents are Asian of non-Hispanic origin. Asians of non-Hispanic origin make up 13.8% of the population, about 1.4% South Asian (Indian Subcontinent), and about 12.4% were East or Southeast Asian. The six largest Asian ancestries with respect to all of Greater LA's population were Chinese: ~ 6.1% , Filipino: ~ 3.1%, Vietnamese: ~ 2.0%, Korean ~ 1.9%, Indian ~ 1.1% , and Japanese ~ 0.8%. Other important Asian American groups include Cambodian, Laotian, Hmong, Taiwanese, Pakistani, and Thai Americans.
Non-Hispanic blacks make up 6.1% of the population. Approximately 1,143,781 residents are non-Hispanic blacks. Sub-Saharan Africans were 0.7% (137,443) and Non-Hispanic Caribbean Blacks were 0.3% (62,419).
Non-Hispanic Native Americans make up 0.2% of the population (46,143).
Non-Hispanic Native Hawaiians and other Pacific Islanders make up 0.2% of the population. Approximately 42,591 residents are Native Hawaiian or of other Pacific Islander ancestries. The largest Pacific Islander ancestries were Samoan, Native Hawaiian, and Guamanian or Chamorro, and Tongan
Non-Hispanic Multiracial people make up 3.3% of the population. Approximately 624,473 people are non-Hispanic multiracial.
People who listed "other" as their race made up 0.5% (102,434) of the population.
Source: data.census.gov. Retrieved on April 15, 2023.[57]
Hispanic or Latino origin
[edit]Hispanic or Latinos, who may be of any race, are by far the largest group; Hispanics or Latinos make up 46.3% of the population. They outnumber every other racial group. Approximately 8,630,090 residents are Hispanic or Latino. The largest Hispanic or Latino ancestry was by far Mexican, with other important groups being Salvadoran, Guatemalan, Honduran, Peruvian, Puerto Rican, Colombian, and Cuban.
Ethnic enclaves
[edit]Ethnic enclaves like Chinatown, the Byzantine-Latino Quarter, Historic Filipinotown, Little Saigon, Little Armenia, Little Ethiopia, Little Bangladesh, Little Moscow (in Hollywood), Little Tokyo, Croatian Place and Via Italia in San Pedro, several Koreatowns, Tehrangeles in West Los Angeles, the Chinese enclaves in the San Gabriel Valley and Thai Town provide examples of the polyglot multicultural character of Los Angeles. Below is a list of many ethnic enclaves present in the Los Angeles metropolitan area.
Politics
[edit]| Year | GOP | DEM | Others |
|---|---|---|---|
| 2020 | 34.8% 2,799,636 | 63.1% 5,078,481 | 2.1% 169,472 |
| 2016 | 31.5% 2,013,697 | 62.3% 3,983,255 | 6.1% 391,977 |
| 2012 | 37.4% 2,196,108 | 60.2% 3,534,444 | 2.4% 143,577 |
| 2008 | 37.3% 2,099,609 | 60.8% 3,425,319 | 1.9% 107,147 |
| 2004 | 45.3% 2,490,150 | 53.4% 2,932,429 | 1.3% 69,649 |
| 2000 | 41.3% 2,003,114 | 54.6% 2,652,907 | 4.1% 198,750 |
| 1996 | 38.3% 1,661,209 | 51.3% 2,220,837 | 10.4% 449,706 |
| 1992 | 33.8% 1,657,151 | 45.0% 2,202,345 | 21.2% 1,038,448 |
| 1988 | 53.8% 2,408,696 | 45.0% 2,014,670 | 1.2% 54,441 |
| 1984 | 60.6% 2,614,904 | 38.3% 1,650,231 | 1.1% 48,225 |
| 1980 | 55.5% 2,187,859 | 35.0% 1,381,285 | 9.5% 374,993 |
| 1976 | 50.8% 1,877,267 | 46.7% 1,728,532 | 2.5% 93,554 |
| 1972 | 57.7% 2,346,127 | 38.7% 1,573,708 | 3.6% 146,653 |
| 1968 | 50.3% 1,836,478 | 43.0% 1,570,478 | 7.3% 247,280 |
| 1964 | 44.0% 1,578,837 | 55.9% 2,006,184 | 0.1% 2,488 |
| 1960 | 50.8% 1,677,962 | 48.9% 1,612,924 | 0.3% 10,524 |
Greater Los Angeles is a politically divided metropolitan area. During the 1970s and 1980s, the region leaned toward the Republican Party. Los Angeles County, the most populous of the region, is a Democratic stronghold, although it voted twice for both Richard Nixon (1968 and 1972) and Ronald Reagan (1980 and 1984). Riverside County, San Bernardino County, and Orange County have historically leaned toward the Republican Party but have started shifting leftward in recent years. Ventura County is politically divided.
Economy
[edit]The Los Angeles metropolitan area has the third-largest metropolitan economy in the world, behind the Greater Tokyo Area and the New York metropolitan area. In 2022, the combined statistical area of Greater Los Angeles (which includes the Los Angeles metropolitan area, the Inland Empire, and Ventura County) had a $1.528 trillion economy.
Los Angeles and Orange Counties together have an economy of roughly $1.227 trillion.[3] Important are coastal California land values and the rents they command, which contribute heavily to GDP earnings, though there are worries that these high land values contribute to the long-term problem of housing affordability and are thus a possible risk to future GDP increase.[70][71] This is evident when comparing the coast with the Inland Empire, a large component of the five-county combined statistical area (CSA) that nevertheless contributes a far smaller portion to regional gross metropolitan product but still dominates in industry. The Greater Los Angeles CSA is the third-largest economic center in the world, after Greater Tokyo and the New York-Newark-Bridgeport CSA.
Greater Los Angeles is a hotspot for Asian car manufacturers. Specifically, Mitsubishi, Hyundai, Honda, and Mazda have their U.S. headquarters in the area.[72] Nissan and Toyota were headquartered in the area in the recent past as well. (Nissan moved to Tennessee; Toyota moved to Texas.)[73]
This section needs to be updated. (June 2015) |
The economy of the Los Angeles metropolitan area is famously and heavily based on the entertainment industry, with a particular focus on television, motion pictures, interactive games, and recorded music – the Hollywood district of Los Angeles and its surrounding areas are known as the "movie capital of the United States" due to the region's extreme commercial and historical importance to the American motion picture industry. Other significant sectors include shipping/international trade – particularly at the adjacent Port of Los Angeles and Port of Long Beach, together comprising the United States' busiest seaport – logistics – the Inland Empire being the largest concentration of warehousing and intermodal facilities in the world – as well as aerospace, technology, petroleum, fashion and apparel, and tourism.
The City of Los Angeles is home to five Fortune 500 companies: energy company Occidental Petroleum (until 2014 when it moved its headquarters to Houston), healthcare provider Health Net, metals distributor Reliance Steel & Aluminum, engineering firm AECOM, and real estate group CB Richard Ellis. Other companies headquartered in Los Angeles include American Apparel, City National Bank, 20th Century Studios, Latham & Watkins, Univision, Metro Interactive, LLC, Premier America, Gibson, Dunn & Crutcher, DeviantArt,[74] Guess?, O'Melveny & Myers; Paul, Hastings, Janofsky & Walker, Tokyopop, The Jim Henson Company, Paramount Pictures, Sunkist Growers, Incorporated, Tutor Perini, Fox Sports Net, Capital Group, and The Coffee Bean & Tea Leaf. Korean Air's US passenger and cargo operations headquarters are in two separate offices in Los Angeles.[75] Entertainment and media giant The Walt Disney Company is headquartered in nearby Burbank.

The Port of Los Angeles and Port of Long Beach together comprise the fifth-busiest port in the world, being the center of imports and exports for trade on the west Pacific Coast as well as being one of the most significant ports of the western hemisphere. The Port of Los Angeles occupies 7,500 acres (3,035 hectares) of land and water along 43 miles (69 kilometres) of waterfront and is the busiest container port in the United States. The Port is the busiest port in the United States by container volume, the 8th busiest container port in the world.[76][77][78] The top trading partners in 2004 were: China ($68.8 billion), Japan ($24.1 billion), Taiwan ($10.8 billion), Thailand ($6.7 billion), & South Korea ($5.6 billion)
The Port of Long Beach is the second-busiest container port in the United States. It adjoins the separate Port of Los Angeles. Acting as a major gateway for U.S.-Asian trade, the port occupies 3,200 acres (1,295 hectares) of land with 25 miles (40 kilometres) of waterfront in the city of Long Beach, California. The seaport has approximately $100 billion in trade and provides more than 316,000 jobs in Southern California. The Port of Long Beach imports and exports more than $100 billion worth of goods every year. The seaport provides the country with jobs, generates tax revenue, and supports retail and manufacturing businesses.[citation needed]
Economic statistics for Los Angeles and Orange Counties
[edit]In 2014, the population of the Long Beach–Los Angeles–Anaheim metropolitan statistical area (MSA) reached 13,262,220 and ranked second in the United States – a 1 percent increase from 2013.[79] In 2014, Los Angeles–Long Beach–Anaheim had a per capita personal income (PCPI) of $50,751 and ranked 29th in the country.
In 2014, Los Angeles–Long Beach–Anaheim placed third among the largest exporters in the United States (shipment totaling to $75.5 billion). The metro accounted for 40.8 percent of California's merchandise exports, mainly exporting computer and electronic products ($18.6 billion); transportation equipment ($15.3 billion) and chemicals ($5.6 billion). Nonetheless, the greater Los Angeles metro has immensely benefited from the free trade agreements: greater Los Angeles exported $25.1 billion to the NAFTA region and $776 million in goods to the CAFTA region.
Overall, in 2014 the average wages and salaries reached $57,519 (in 2010, the average wages and salaries reached $54,729).[80] Meanwhile, the median household income in 2014 was $56,935, a 1.4 percent increase from 2013 (average median household income was $56,164).[81]
Note: Dollar items are in current dollars (not adjusted for inflation). Per capita items in dollars; other dollar items in thousands of dollars.
Table 2 (refer below) is a chart of the four highest sectors in the metro area, with health care and social assistance reaching 15.54%.
| Industry | Los Angeles–Long Beach–Anaheim, CA MSA |
| NAICS 62 Health care and social assistance | 15.54% |
| NAICS 44–45 Retail trade | 11.27% |
| NAICS 72 Accommodation and food services | 10.79% |
| NAICS 31–33 Manufacturing | 10.47% |
Table 3 (refer below) displays the location quotient for employment in the Los Angeles–Long Beach–Anaheim MSA. Top three sectors include information; art, entertainment, and recreation; and real estate and rental and leasing. (Data obtained from the Bureau of Labor Statistics, 2014. Data measures Location Quotient for sectors in the MSA area. U.S. Total is the base areas.[82])
| Industry | Los Angeles–Long Beach–Anaheim, CA MSA |
| NAICS 99 Unclassified | 2.46 |
| NAICS 51 Information | 1.88 |
| NAICS 71 Arts, entertainment, and recreation | 1.36 |
| NAICS 53 Real estate and rental and leasing | 1.29 |
| NAICS 42 Wholesale trade | 1.21 |
| NAICS 61 Educational services | 1.13 |
| NAICS 54 Professional and technical services | 1.11 |
| NAICS 56 Administrative and waste services | 1.06 |
| NAICS 81 Other services, except public administration | 1.04 |
| NAICS 31–33 Manufacturing | 1 |
| NAICS 62 Health care and social assistance | 1 |
| NAICS 72 Accommodation and food services | 1 |
| NAICS 55 Management of companies and enterprises | 0.95 |
| NAICS 48–49 Transportation and warehousing | 0.88 |
| NAICS 52 Finance and insurance | 0.86 |
| NAICS 44–45 Retail trade | 0.85 |
| NAICS 23 Construction | 0.76 |
| NAICS 22 Utilities | 0.65 |
| NAICS 11 Agriculture, forestry, fishing and hunting | 0.15 |
| NAICS 21 Mining, quarrying, and oil and gas extraction | 0.15 |
Utilities and infrastructure
[edit]There are nine electric utility power companies in the Los Angeles metropolitan area. Southern California Edison serves a large majority of the Los Angeles metropolitan area except for Los Angeles city limits, Burbank, Glendale, Pasadena, Azusa, Vernon, Anaheim, and southern Orange County. Southern Orange County is part of the Los Angeles metropolitan area and it is served by San Diego Gas & Electric. There are three natural gas providers in the metropolitan area. Southern California Gas Company serves a large majority of the Los Angeles metropolitan area except for Long Beach and southern Orange County.
The Los Angeles metropolitan area is served by the following utility companies.
Electricity
[edit]- Southern California Edison (largest electric utility in the Los Angeles metropolitan area)
- Los Angeles Department of Water and Power (second-largest electric utility in the Los Angeles metropolitan area and the largest within the Los Angeles city limits)
- Burbank Water and Power
- Glendale Water and Power
- Pasadena Water and Power
- Anaheim Water and Power
- Azusa Light & Power
- Vernon Light & Power
- San Diego Gas & Electric (serves southern Orange County, which is part of the Los Angeles metropolitan area)
The only nuclear power plant that serves the Los Angeles metropolitan area is Palo Verde Nuclear Generating Station in the US state of Arizona 46 miles west of Phoenix. LADWP and Southern California Edison get their electricity from it.
Natural gas
[edit]- Southern California Gas Company
- City of Long Beach Gas Company
- San Diego Gas & Electric (serves southern Orange County, which is part of the Los Angeles metropolitan area)
Cable television
[edit]- Charter Communications, known as Charter Spectrum (serves a majority of the Los Angeles metropolitan area)
- Cox Communications (serves parts of Orange County and the Palos Verdes peninsula)
Phone and Internet
[edit]Medical facilities
[edit]Greater Los Angeles is one of the world's largest patient destinations. The Los Angeles Medical Services provide quality medical services and specialty care services to the populations served in compliance with local, state and federal regulations as well as human rights protection.[83] Archived February 12, 2018, at the Wayback Machine
Los Angeles and Orange counties have separate medical service department but both work jointly. Government and Private hospitals open normally Monday through Friday, excluding City Holidays but some speciality hospitals are open year-round.[83] Archived February 12, 2018, at the Wayback Machine
The main healthcare providers in the Los Angeles metropolitan area are Kaiser Permanente, Cedars-Sinai Health System, UCLA Health, Dignity Healthcare, and Providence Healthcare. LA Care and Care1st are also the main providers for those in the metropolitan area that have Medi-Cal.
Events
[edit]Major events include:[84]
- 626 Night Market
- Auto Club 400, Inland Empire
- BNP Paribas Open
- Fashion Week El Paseo, Palm Springs
- Holidays at the Disneyland Resort
- LA Auto Show
- Laguna Beach Pageant of the Masters
- Los Angeles Film Festival
- Newport Beach Christmas boat parade
- Newport Beach Wine and Food Festival
- Palm Springs International Film Festival
- Palm Springs Modernism Week
- Rose Parade
- Temecula Valley Balloon & Wine Festival
- Vans U.S. Open of Surfing
Awards ceremonies
[edit]Annual county fairs
[edit]- Los Angeles County Fair at Fairplex in Pomona
- Orange County Fair in Costa Mesa
- Riverside County Fair and Date Festival
Annual Conventions
[edit]- Anime Expo
- BlizzCon
- D23 Expo
- Electronic Entertainment Expo
- L.A. Comic Con
- Los Angeles Auto Show
- NAMM Show
- VidCon
- WonderCon
- RuPaul's DragCon LA
Tourism and attractions
[edit]This section may be too long to read and navigate comfortably. (November 2020) |
This section is missing information about San Bernardino, Riverside and Ventura counties. (November 2020) |
Due to L.A.'s position as The Entertainment Capital of the World, there are many tourist attractions in the area. Consequently, Greater Los Angeles is one of the most visited areas in the world. Here is a breakdown of some of its major attractions:
Amusement parks
[edit]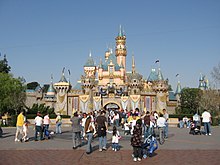
Beaches
[edit]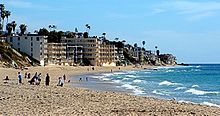
- Capistrano Beach
- Corona del Mar
- Dana Point
- El Porto
- El Segundo
- Hermosa Beach
- Huntington Beach
- Laguna Beach
- Long Beach
- Los Angeles
- Malibu
- Manhattan Beach
- Marina del Rey
- Newport Beach
- Pacific Palisades
- Palos Verdes Estates
- Playa del Rey
- Rancho Palos Verdes
- Redondo Beach
- San Clemente
- San Pedro
- Santa Monica
- Seal Beach
- Sunset Beach
- Venice Beach
Shopping centers and districts
[edit]There are hundreds of shopping centers and shopping districts across the area. Some key ones that attract out-of-area visitors are listed here; see also the Table of Shopping Centers in Southern California for a more complete list.
- Anaheim GardenWalk near Disneyland
- Beverly Center near West Hollywood
- Citadel Outlets, Commerce
- Del Amo Fashion Center, Torrance
- Downtown Disney
- Fashion District, Downtown Los Angeles
- Fashion Island, Newport Beach
- Ovation Hollywood
- Irvine Spectrum Center
- Melrose Avenue, Hollywood
- Old Pasadena
- Ontario Mills
- Rodeo Drive and downtown Beverly Hills
- The Grove at Farmer's Market, Fairfax District
- South Coast Plaza, Costa Mesa
- Third Street Promenade and Santa Monica Place, Santa Monica
- Universal CityWalk
- Victoria Gardens (Rancho Cucamonga)
- Westfield Century City
Visitors may also stroll Broadway and 7th streets in Downtown Los Angeles, the main shopping districts until the 1950s, to see the architecture of the buildings that once housed the large downtown department stores such as the May Company, Bullock's, The Broadway, Desmond's, Coulter's, Barker Brothers, and J. W. Robinson's.
Film and TV Studio Tours
[edit]
Water Parks
[edit]Zoos and Aquariums
[edit]
Museums
[edit]There are over 100 museums in the area, with some of the most widely visited being:
- Academy Museum of Motion Pictures
- Bowers Museum
- California African American Museum
- California Science Center
- Children's Museum of Los Angeles
- Chinese American Museum
- Discovery Cube Los Angeles
- Discovery Cube Orange County
- El Pueblo de Los Ángeles Historical Monument
- Getty Center
- Getty Villa
- Grammy Museum
- Griffith Observatory
- Hammer Museum
- Hollywood Wax Museum
- Huntington Library
- Italian American Museum of Los Angeles
- La Brea Tar Pits and Page Museum
- Los Angeles County Museum of Art
- Mission San Buenaventura
- Mission San Fernando Rey de España
- Mission San Gabriel Arcángel
- Mission San Juan Capistrano
- Movieland Wax Museum
- Museum of Contemporary Art
- Museum of Tolerance
- Natural History Museum of Los Angeles County
- Nethercutt Collection
- Norton Simon Museum
- Orange County Museum of Art
- Queen Mary
- Richard Nixon Birthplace
- Richard Nixon Presidential Library and Museum
- Ripley's Believe It or Not!
- Ronald Reagan Presidential Library
- San Bernardino de Sena Estancia
- Southwest Museum of the American Indian
- Travel Town Museum
- USC Fisher Museum of Art
- Watts Towers
Convention Centers
[edit]State Parks & Beaches
[edit]- Antelope Valley California Poppy State Reserve
- Antelope Valley Indian Museum State Historic Park
- Arthur B. Ripley Desert Woodland State Park
- Bolsa Chica State Beach
- California Citrus State Historic Park
- Castaic Lake State Recreation Area
- Chino Hills State Park
- Corona del Mar State Beach
- Crystal Cove State Park
- Dockweiler State Beach
- Doheny State Beach
- Emma Wood State Beach
- Huntington State Beach
- Kenneth Hahn State Recreation Area
- Leo Carrillo State Park
- Los Angeles State Historic Park
- Los Encinos State Historic Park
- Malibu Creek State Park
- Malibu Lagoon State Beach
- Mandalay State Beach
- McGrath State Beach
- Mount San Jacinto State Park
- Pescadero State Beach
- Pío Pico State Historic Park
- Placerita Canyon State Park
- Point Dume State Beach
- Point Mugu State Park
- Rio de Los Angeles State Park
- Robert H. Meyer Memorial State Beach
- Saddleback Butte State Park
- San Buenaventura State Beach
- San Clemente State Beach
- San Onofre State Beach
- Santa Monica State Beach
- Santa Susana Pass State Historic Park
- Topanga State Park
- Verdugo Mountains State Recreation Area
- Watts Towers of Simon Rodia State Historic Park
- Will Rogers State Historic Park
- Will Rogers State Beach
Национальные парки, памятники и заповедники
[ редактировать ]- Национальный лес Анхелес
- Кливлендский национальный лес
- Национальный парк Нормандских островов
- Национальный заповедник дикой природы Хоппер-Маунтин
- Национальный парк Джошуа-Три
- Национальная историческая тропа Хуана Баутиста де Анса
- Старая национальная историческая тропа Испании
- Национальный лес Сан-Бернардино
- Национальная зона отдыха в горах Санта-Моники
- Национальный заповедник дикой природы Сил-Бич
Места поклонения
[ редактировать ]- Храм Бао Куанг
- BAPS Шри Сваминараян Мандир Чино Хиллз
- Поддержка монастыря Будды (Парк Монтерей)
- Собор Богоматери Ангелов
- Чуа Батня
- Вьетнамский буддийский храм Чуа Дьеу Нгу
- Хрустальный собор
- Первая конгрегационалистская церковь Лос-Анджелеса
- Церковь Славы Иисуса Христа
- Ассоциация Хайнам Южной Калифорнии
- Спасо-Преображенский Русский Православный Собор
- Храм Си Лай
- Буддийский храм Коясан
- Пресвитерианская церковь Иммануила
- Исламское общество округа Ориндж
- Церковь адвентистов седьмого дня Университета Лома Линда
- Храм в Лос-Анджелесе, Калифорния
- Индуистский храм Малибу
- Буддийский фонд Мин Я

- Миссия Базилика Сан-Хуан Капистрано
- Храм Пао Фа
- Церковь Седлбэк
- Католическая церковь Святого Андрея
- Католическая церковь Святого Брендана
- Собор Святого Григория Просветителя
- Епископальный собор Святого Иоанна
- Армянская Апостольская Церковь Святой Марии
- Сербская Православная Церковь Святого Саввы Сан-Габриэль
- Софийский собор
- Церковь Святого Винсента де Поля
- Ассоциация Тео Чу Южной Калифорнии
- Храм Тхиен Хау
- Немного тайского или Лос-Анджелеса
- Храм на бульваре Уилшир
- Миссия Дзеншудзи Сото
Другие достопримечательности для посетителей
[ редактировать ]- Мемориальный памятник мученикам Геноцида армян
- Ночной рынок, авеню 26 (Пико Ривера)
- Зона развлечений Бальбоа
- Остров Бальбоа
- Пирс Бальбоа
- Горнолыжный курорт Медвежья гора
- Большое Медвежье озеро
- Кабазонские динозавры
- Остров Каталина
- Дьявольский пунш
- Театр Эль Капитан
- Исторический памятник Эль-Пуэбло-де-Лос-Анджелес
- Экспозиционный парк
- Амфитеатр Глен Хелен
- Китайский театр Граумана
- Гриффит Парк
- Голливудский бульвар
- Голливуд Боул
- Знак Голливуда
- Голливудская аллея славы
- Пирс Хантингтон-Бич
- Ирвинский региональный парк
- Лаборатория реактивного движения
- Дуб Юрупа
- Корейский колокол дружбы
- Смоляные ямы Ла Бреа
- Дендрарий и ботанический сад округа Лос-Анджелес
- Пирс Манхэттен-Бич
- Средневековые времена
- Региональный парк Майл-Сквер
- Миссия Инн
- Гора Рубиду
- Обсерватория Маунт-Вилсон
- Фрески Лос-Анджелеса
- Ньюпорт Бэй
- Региональный парк О'Нил
- Большой парк округа Ориндж
- Канатная дорога Палм-Спрингс
- Мэрия Пасадены
- Депо Сан-Бернардино-Санта-Фе
- Пирс Санта-Моники
- Мемориал японской рыбацкой деревни на острове Терминал
- Японский сад
- Юниверсал Сити
- Венеция
Район и почтовые индексы
[ редактировать ]В этом разделе отсутствует информация об округах Сан-Бернардино, Риверсайд и Вентура. ( ноябрь 2020 г. ) |
Коды городов
[ редактировать ]- 213 – Центр Лос-Анджелеса , в окружении 323 (октябрь 1947 г.)
- 310/424 – Санта-Моника , Малибу , Пасифик-Палисейдс , Комптон , Линвуд , Торранс , Беверли-Хиллз , остров Каталина ; юго-западная часть округа Лос-Анджелес . (Отделено от 213 2 ноября 1991 г.; наложено на 424 26 августа 2006 г.)
- 323 - кольцо вокруг центра Лос-Анджелеса, включая районы Голливуд и Игл-Рок в Лос-Анджелесе; Южный Лос-Анджелес ; города Саут-Гейт , Хантингтон-Парк , Вернон , Уолнат-Парк , Флоренция , Белл , Белл-Гарденс , Кудахи , Монтебелло и Восточный Лос-Анджелес . (Отделился от 213 13 июня 1998 г.)
- 442/760 — Долина Коачелла , включая Палм-Спрингс и Индио ; Виктор-Вэлли , включая Викторвилл и Эппл-Вэлли
- 562 — Лонг-Бич , Дауни , Уиттиер ; Норуолк , Лейквуд , Беллфлауэр , Парамаунт , Серритос , юго-восточный округ Лос-Анджелес и небольшая часть прибрежного округа Ориндж . (Отделение от 310 25 января 1997 г.)
- 626 – Пасадена , Монтерей-Парк , Роуленд-Хайтс , Альгамбра и Вест-Ковина ; долина Сан-Габриэль и восточные пригороды Лос-Анджелеса. (Отделение от 818 14 июня 1997 г.)
- 657/714 – Анахайм , Хантингтон-Бич , Санта-Ана , Ориндж , Гарден-Гроув ; северный и западный округ Ориндж (наложен номером 657 23 сентября 2008 г.)
- 747/818 — города Бербанк , Глендейл , Сан-Фернандо ; районы Северного Голливуда , Ван-Найс , Панорама-Сити , Шерман-Оукс и Нортридж в Лос-Анджелесе; Долина Сан-Фернандо . (Отделение от 213 7 января 1984 г.)
- 805/820 — округ Вентура, включая города Окснард , Сими-Вэлли , Таузенд-Оукс и Вентура.
- 909 — юго-запад округа Сан-Бернардино и дальневосточные пригороды округа Лос-Анджелес — Помона , Уолнат , Даймонд-Бар , Сан-Димас , Ла-Верн и Клермонт . (Отделился от 714 14 ноября 1992 г.)
- 949 — Ирвин , Лагуна-Бич , Ньюпорт-Бич , Сан-Хуан-Капистрано ; южный и восточный округ Ориндж . (Отделился от 714 18 апреля 1998 г.)
- 951 — Корона , Хемет , долина Джурупа , озеро Эльсинор , Менифи , долина Морено , Риверсайд , Темекула ; западная оконечность округа Риверсайд . (Отделение от 909 17 июля 2004 г.)
СМИ
[ редактировать ]В агломерации Лос-Анджелеса расположены штаб-квартиры нескольких известных медиа-компаний, в том числе: Los Angeles Times , Fox Broadcasting Company , Universal Studios и The Walt Disney Company . Местные телеканалы, вещающие на рынок Лос-Анджелеса, включают KCBS-TV 2 ( CBS ), KNBC 4 ( NBC ), KTLA 5 ( The CW ), KABC 7 ( ABC ), KCAL-TV 9 ( Independent ), KTTV 11 ( Fox ). , KCOP 13 ( MyNetworkTV ), KCET 28, ( PBS ), KPXN-TV 30 ( Ion ), KMEX-DT 34 ( Univision ), KVEA 52 ( Telemundo ) и KLCS 58 (PBS). Радиостанции, обслуживающие этот район, включают: KKJZ , KIIS , KNX (AM) и KMZT .
Образование
[ редактировать ]В этом разделе отсутствует информация об округах Сан-Бернардино, Риверсайд и Вентура. ( ноябрь 2020 г. ) |
Начальное и среднее образование
[ редактировать ]Объединенный школьный округ Лос-Анджелеса обслуживает город Лос-Анджелес, а другие школьные округа обслуживают прилегающие районы. В регионе также расположен ряд частных школ.
Высшее образование
[ редактировать ]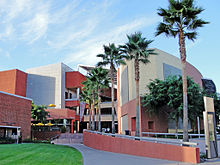
Большой Лос-Анджелес является домом для ряда колледжей и университетов . Университет Южной Калифорнии и Калифорнийский университет в Лос-Анджелесе являются одними из крупнейших, а колледжи Клермонта и Калифорнийский технологический институт являются одними из самых академически известных. Ниже приведен список некоторых из наиболее известных колледжей и университетов столичного региона Лос-Анджелеса.
- Арт-центр Колледж дизайна
- Тихоокеанский университет Азуса
- Университет Биола
- Калифорнийский баптистский университет
- Калифорнийский лютеранский университет
- Калифорнийский государственный университет, Нормандские острова
- Калифорнийский государственный университет, Домингес-Хиллз
- Калифорнийский государственный университет, Фуллертон
- Калифорнийский государственный университет, Нортридж
- Калифорнийский государственный университет, Лонг-Бич
- Калифорнийский государственный университет, Лос-Анджелес
- Калифорнийский государственный университет, Сан-Бернардино
- Калифорнийский государственный политехнический университет, Помона
- Калифорнийский технологический институт
- Университет Чепмена
- Клермонтские колледжи
- Колледж искусств и дизайна Лагуна
- Университет Лома Линда
- Университет Лойолы Мэримаунт
- Калифорнийский университет, Ирвин
- Калифорнийский университет, Лос-Анджелес
- Калифорнийский университет, Риверсайд
- Университет Южной Калифорнии
- Университет Ла Верна
- Университет Редлендса
- Пеппердинский университет
- Американский университет Сока
- Авангардный университет
- Университет Западного побережья
Транспорт
[ редактировать ]
Большой Лос-Анджелес известен своей обширной транспортной сетью. Наиболее примечательной является обширная система автомагистралей. Этот район является перекрестком многочисленных автомагистралей между штатами, идущих с севера, востока и юга, и содержит три основные автомагистрали с севера на юг в Калифорнии: межштатную автомагистраль 5 , шоссе США 101 и шоссе штата Калифорния 1 . В этом районе также расположено несколько портов, в том числе порты-близнецы Лонг-Бич и Лос-Анджелес , которые являются двумя самыми загруженными в Соединенных Штатах, а также порт Уэнеме . [ 85 ] Кроме того, регион также обслуживается системами пригородных железных дорог Los Angeles Metro Rail и Metrolink , которые связывают районы Лос-Анджелеса с ближайшими пригородами и большую часть региона (за исключением внешнего региона Внутренней Империи) с Оушенсайдом в округе Сан-Диего. соответственно. Международный аэропорт Лос-Анджелеса (LAX) — главный международный аэропорт региона и один из самых загруженных в мире. [ 86 ] Другие аэропорты включают международный аэропорт Онтарио (ONT), аэропорт Джона Уэйна (SNA), аэропорт Боба Хоупа (BUR), муниципальный аэропорт Лонг-Бич (LGB) и международный аэропорт Палм-Спрингс (PSP).
Историческая трамвайная сеть
[ редактировать ]
Компания Pacific Electric Railway Company , прозванная « Красными вагонами» , была частной системой общественного транспорта в Южной Калифорнии, с электроприводом состоящей из трамваев , междугородных автомобилей и автобусов , и была крупнейшей системой электрических железных дорог в мире в 1920-х годах. Организованный вокруг городских центров Лос-Анджелеса и Сан-Бернардино, он соединил города в округах Лос-Анджелес , Ориндж , Сан-Бернардино и Риверсайд .
Система делила с двойной колеей путь шириной 3 фута 6 дюймов ( 1067 мм ), с узкоколейной Лос-Анджелесской железной дорогой системой «Желтый вагон» или «LARy» на Мейн-стрит в центре Лос-Анджелеса (прямо перед 6-м и главным терминалом). , на 4-й улице и вдоль бульвара Хоторн к югу от центра Лос-Анджелеса в направлении городов Хоторн, Гардена и Торранс.
Коммерческие аэропорты
[ редактировать ]| Аэропорт | Код ИАТА | Графство | Энпланеты (2013) [ 87 ] |
|---|---|---|---|
| Международный аэропорт Лос-Анджелеса | Лос-Анджелес | Лос-Анджелес | 32,425,892 |
| Джон Уэйн аэропорт | СНС | Округ Ориндж | 4,540,628 |
| Международный аэропорт Онтарио | ИМЕТЬ | Сан-Бернардино | 1,970,538 |
| Голливудский аэропорт Бербанк | БУР | Лос-Анджелес | 1,918,011 |
| Аэропорт Лонг-Бич | ЛГБ | Лос-Анджелес | 1,438,756 |
| Международный аэропорт Сан-Бернардино | СБД | Сан-Бернардино | ЧТО |
Основным аэропортом, обслуживающим агломерацию Лос-Анджелеса, является международный аэропорт Лос-Анджелеса (LAX), один из самых загруженных аэропортов в Соединенных Штатах. Лос-Анджелес находится на юго-западе Лос-Анджелеса, в 16 милях (26 км) от центра Лос-Анджелеса. Лос-Анджелес — единственный аэропорт, который служит хабом для всех трех устаревших авиакомпаний США — American, Delta и United.
Помимо LAX, другие аэропорты , в том числе аэропорт Голливуда Бербанк , аэропорт Джона Уэйна , аэропорт Лонг-Бич , международный аэропорт Онтарио и международный аэропорт Сан-Бернардино регион также обслуживают .
Мосты
[ редактировать ]В агломерации Лос-Анджелеса есть только один подвесной мост: Мост Винсента Томаса в Сан-Педро , и один вантовый мост: Long Beach International Gateway в Лонг-Бич .
Межгосударственные автомагистрали
[ редактировать ] Автострада Голден-Стейт / Автострада Санта-Ана / Автострада Сан-Диего ( межштатная автомагистраль 5 )
  Автострада Санта-Моника / Автострада Роза Паркс / Автострада Сан-Бернардино ( межштатная автомагистраль 10 )
  Автострада Эскондидо/шоссе Темекула-Вэлли/шоссе Корона/шоссе Онтарио/шоссе Мохаве ( межштатная автомагистраль 15 )
  Glenn Anderson Freeway/Century Freeway ( межштатная автомагистраль 105 )
  Харбор-фривей ( межштатная автомагистраль 110 )
  Футхиллское шоссе ( межштатная автомагистраль 210 )
  Автострада Эскондидо / Автострада Вооруженных сил / Автострада Барстоу ( межштатная автомагистраль 215 )
  Автострада Сан-Диего ( межштатная автомагистраль 405 )
  Автострада реки Сан-Габриэль ( межштатная автомагистраль 605 )
  Автострада Лонг-Бич ( межштатная автомагистраль 710 )
Шоссе США
[ редактировать ] Шоссе Уилла Роджерса (бывшая трасса 66 США )
  Тихоокеанское шоссе (бывшая трасса США 99 )
  Автострада Санта-Ана / Голливудская автострада ( маршрут 101 США )
Шоссе штата Калифорния
[ редактировать ] Государственный маршрут 1
  Государственный маршрут 2
  Государственный маршрут 14
  Государственный маршрут 18
  Государственный маршрут 19
  Государственный маршрут 22
  Государственный маршрут 23
  Государственный маршрут 27
  Государственный маршрут 33
  Государственная трасса 34
  Государственный маршрут 39
  Государственная трасса 47
  Государственная трасса 55
  Государственная трасса 57
  Государственная трасса 60
  Государственная трасса 66
  Государственная трасса 71
  Государственная трасса 72
  Государственная трасса 73
  Государственная трасса 74
  Государственная трасса 83
  Государственная трасса 90
  Государственная трасса 91
  Государственный маршрут 103
  Государственный маршрут 107
  Государственная трасса 110
  Государственная трасса 118
  Государственная трасса 126
  Государственный маршрут 133
  Государственная трасса 134
  Государственная трасса 138
  Государственный маршрут 142
  Государственная трасса 170
  Государственный маршрут 187
  Государственная трасса 210
  Государственный маршрут 213
  Государственная трасса 241
  Государственная трасса 261
Метро округа Лос-Анджелес
[ редактировать ]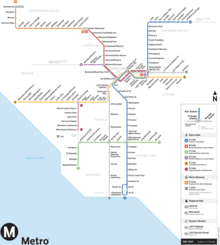
Метро Лос-Анджелеса — это система общественного транспорта округа Лос-Анджелес. Он находится в ведении Управления городского транспорта округа Лос-Анджелес , и его система управляет шестью железнодорожными линиями по всему округу Лос-Анджелес. Metro Rail в настоящее время управляет четырьмя линиями легкорельсового транспорта и двумя линиями скоростного транспорта , общая протяженность железных дорог которых составляет 115,5 миль (185,9 км), 101 станция и более 360 000 ежедневных посадок в будние дни по состоянию на декабрь 2012 года. [update]. [ 88 ]
- Линия А - легкорельсовый транспорт
- Линия B – скоростной транспорт
- Линия C – легкорельсовый транспорт
- Линия D – скоростной транспорт
- Линия E - легкорельсовый транспорт
- G Line – скоростной автобусный транспорт
- J Line - скоростной автобусный транспорт
- Линия K - легкорельсовый транспорт
Линии легкорельсового транспорта этой системы являются второй по загруженности системой LRT в Соединенных Штатах после Бостона по количеству пассажиров: в третьем квартале 2012 года в среднем было 200 300 посадок в будние дни. [ 89 ] К 2019 году это была самая загруженная система легкорельсового транспорта в стране. [ 90 ]
Поскольку район города находится в непосредственной близости от крупного разлома, туннели были построены так, чтобы выдерживать землетрясения силой до 7,5 баллов. Обе линии метро используют электрифицированный третий рельс для обеспечения электропитания поездов, что делает эти линии непригодными для использования на трех других. Голубая и Золотая линии проходят в основном на уровне земли, с некоторыми уличными, надземными и подземными участками в более густонаселенных районах Лос-Анджелеса. Зеленая линия полностью разделена уровнями, проходит посередине автомагистрали I-105, а затем поворачивает на юг по эстакаде.
Железнодорожные линии ходят регулярно, в 5 утра и в полночь, семь дней в неделю. Ограниченное обслуживание на определенных участках предоставляется после полуночи и до 5 часов утра. Железнодорожное сообщение отсутствует с 2 до 3:30 ночи. Точное время варьируется от маршрута к маршруту; дополнительную информацию см. в статьях по отдельным маршрутам.
Другие органы
[ редактировать ]Помимо Metro, другие провайдеры предоставляют местные услуги в пределах своей юрисдикции. К ним относятся Транспортное управление округа Ориндж , Транспортное управление округа Сан-Бернардино и Транспортное агентство Риверсайд . [ нужна ссылка ]
Региональная и пригородная железная дорога
[ редактировать ]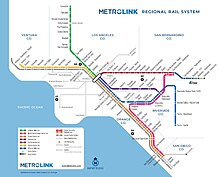
В регионе есть два поставщика тяжелых железнодорожных перевозок: Amtrak и Metrolink . Amtrak обслуживает Сан-Диего , Санта-Барбару , Сан-Луис-Обиспо и промежуточные пункты на Pacific Surfliner . Он также обеспечивает маршруты дальнего следования, в том числе Coast Starlight , который идет в район залива Сан-Франциско , Портленд, штат Орегон , и Сиэтл, штат Вашингтон ; Юго -западный вождь , который посещает Флагстафф, Аризону , Альбукерке, Нью-Мексико , Канзас-Сити, Миссури и Чикаго ; и Sunset Limited , которая предоставляет ограниченные услуги (три дня в неделю) в Тусон , Эль-Пасо , Хьюстон и Новый Орлеан .
Metrolink предоставляет услуги во многих местах Южной Калифорнии, включая все округа региона. Metrolink обслуживает 67 станций на восьми линиях в пределах Южной Калифорнии, которые в основном (за исключением линии Inland Empire – Orange County Line и Arrow ) исходят от станции Los Angeles Union Station .
Спорт
[ редактировать ]В этом разделе отсутствует информация об округах Сан-Бернардино, Риверсайд и Вентура. ( ноябрь 2020 г. ) |
Профессиональные команды
[ редактировать ]В целом, в районе Лос-Анджелеса проводится больше национальных чемпионатов по всем видам спорта вместе взятым (колледжским и профессиональным), чем в любом другом городе Соединенных Штатов, причем более чем в четыре раза больше чемпионатов, чем во всем штате Техас, и чуть более чем в два раза больше. Нью-Йорка. [ 91 ] Это единственный американский город, дважды принимавший летние Олимпийские игры: один раз в 1932 году и совсем недавно в 1984 году (Лейк-Плэсид дважды принимал зимние Олимпийские игры: один раз в 1932 году и один раз в 1980 году). Лос-Анджелес также примет летние Олимпийские игры 2028 года , став третьим городом, принявшим три Олимпийские игры, после Лондона и Парижа .

Таблица профессиональных команд и площадок
[ редактировать ]Другие профессиональные площадки включают:
- Автоклуб Raceway , Помона
- Автоклуб Спидвей
- Стадион для плавания Джона К. Арга
- Стадион Лонг-Бич Марин
- Мемориальный Колизей Лос-Анджелеса (временно)
- Роза Боул
- Парк Санта Анита
- Пожалуйста, форум
- Спортивный центр ВЕЛО
NCAA Division I студенческий спорт
[ редактировать ]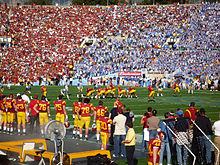
- Калифорния Баптист Лансерс
- Кал Стэйт Фуллертон Титанс
- Калифорнийский штат Нортридж Матадорс
- Государственный пляж Лонг-Бич
- Лойола Мэримаунт Лайонс
- Перцовые волны
- Калифорнийский университет в Ирвине Муравьеды
- Калифорнийский университет Риверсайд Хайлендерс
- Калифорнийский университет в Лос-Анджелесе Брюинз ( FBS )
- USC-трояны ( FBS )
Другие виды спорта
[ редактировать ]В районе Большого Лос-Анджелеса также есть три известных объекта для скачек: парк Санта-Анита , ипподром Лос-Аламитос и бывший ипподром Голливуд-Парк , а также три крупных объекта автоспорта: автоклуб Speedway , уличная трасса Лонг-Бич и гоночная трасса автоклуба в Помоне. . Кроме того, город Лос-Анджелес принимал летние Олимпийские игры в 1932 и 1984 годах .
Более двадцати лет на медиарынке Лос-Анджелеса не хватало команды Национальной футбольной лиги . После сезона 1994 года « Лос-Анджелес Рэмс» переехали в Сент-Луис, штат Миссури , а « Лос-Анджелес Рейдерс» вернулись в свой первоначальный дом в Окленде, штат Калифорния , из-за отсутствия современного стадиона НФЛ. После многочисленных предложений по созданию стадиона в период с 1995 по 2016 год в попытке вернуть НФЛ, [ 92 ] [ 93 ] [ 94 ] « Окленд Рэйдерс» , «Сент-Луис Рэмс» и «Сан-Диего Чарджерс» представили планы по переезду обратно в Лос-Анджелес после сезона НФЛ 2015 года . 12 января 2016 года «Рэмс» было разрешено переехать в Лос-Анджелес и построить стадион, впоследствии известный как стадион «Софи» , а «Чарджерс» или «Рэйдерс» получили возможность присоединиться к ним. 12 января 2017 года «Чарджерс» объявили о переезде в Лос-Анджелес, чтобы присоединиться к «Рэмс». Обе команды делят стадион SoFi в Инглвуде, Калифорния . [ 95 ]
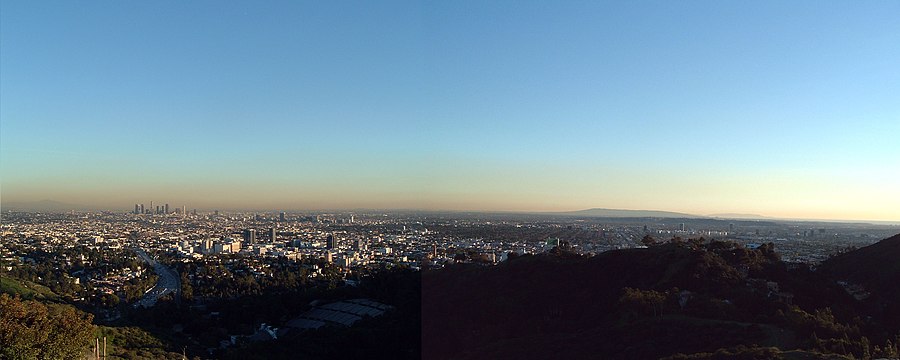
См. также
[ редактировать ] СМИ, связанные с районом Большого Лос-Анджелеса, на Викискладе?
Ссылки
[ редактировать ]- ^ Перейти обратно: а б «Список городских территорий переписи населения» . Бюро переписи населения США . Архивировано из оригинала 15 ноября 2018 года . Проверено 30 сентября 2016 г.
- ^ Перейти обратно: а б с «Общая численность населения столичных и микрополитенских статистических территорий и компоненты изменений: 2020–2024 годы» . Бюро переписи населения США, Департамент финансов Калифорнии. Архивировано из оригинала 31 октября 2023 года . Проверено 30 ноября 2023 г.
- ^ Перейти обратно: а б с д «Общий валовой внутренний продукт Лос-Анджелеса – Лонг-Бич – Анахайма, Калифорния (MSA)» . Экономические данные Федеральной резервной системы . Федеральный резервный банк Сент-Луиса .
- ^ Перейти обратно: а б «Общий валовой внутренний продукт Риверсайд-Сан-Бернардино-Онтарио, Калифорния (MSA)» . Экономические данные Федеральной резервной системы . Федеральный резервный банк Сент-Луиса.
- ^ Перейти обратно: а б «Общий валовой внутренний продукт Окснард-Таузенд-Оукс-Вентура, Калифорния (MSA)» . Экономические данные Федеральной резервной системы . Федеральный резервный банк Сент-Луиса.
- ^ [1] Архивировано 4 июля 2010 г., в Wayback Machine , 2012 г. крупнейших мегаполисах мира
- ^ «Раскрыто: города, которые правят миром» . Си-Эн-Эн. 10 апреля 2010 года. Архивировано из оригинала 24 ноября 2011 года . Проверено 20 октября 2011 г.
- ^ Перейти обратно: а б с д и «Общая численность населения столичных и микрополитенских статистических территорий и компоненты изменений: 2020–2021 годы» . Бюро переписи населения США . Архивировано из оригинала 29 июня 2022 года . Проверено 19 июня 2022 г.
- ^ «Текущие списки столичных и микрополитенских статистических территорий и определений» . Бюро переписи населения США . Архивировано из оригинала 23 сентября 2011 года . Проверено 25 декабря 2009 г.
- ^ Перейти обратно: а б «Список городских территорий переписи 2020 года» . Бюро переписи населения США . Проверено 7 января 2023 г.
- ^ "На Товаангаре | ПРАЙМ " На Товаангаре | ОСНОВНОЙ . Получено 6 января ,
Товаангар, охватывающий всю территорию Габриэлино-Тонгва, охватывает бассейн Лос-Анджелеса , половину округа Ориндж, части округа Риверсайд и округа Сан-Бернардино.
- ^ Грин, Шон; Карвен, Томас (9 мая 2019 г.). «Картирование деревень Тонгва прошлого Лос-Анджелеса» . Лос-Анджелес Таймс . Проверено 7 декабря 2022 г.
- ^ Берубе, Алан (2006). В поисках Эксурбии: быстрорастущие сообщества Америки на окраинах мегаполисов (PDF) . Брукингский институт. Архивировано (PDF) из оригинала 4 февраля 2017 г. Проверено 26 июня 2019 г.
- ^ Американский Factfinder, Бюро переписи населения США, Таблица: «GCT-PH1-R. Население, жилые единицы, площадь и плотность (географические регионы, ранжированные по общей численности населения): 2000» из набора данных: «Сводный файл переписи 2000 года 1 (SF 1) ) 100-Percent Data», по состоянию на 10 октября 2007 г. по адресу: [2] Архивировано 19 февраля 2008 г., на Wayback Machine. См. Также: Список городских территорий США.
- ^ Хотон, Грэм и Колин Хантер, Устойчивые города , Лондон: Routledge, 2003: 81.
- ^ «Плотность населения» . Лос-Анджелес Таймс . Архивировано из оригинала 3 ноября 2019 года . Проверено 16 марта 2020 г.
- ^ Брюгманн, Роберт. Разрастание: компактная история . Издательство Чикагского университета, Чикаго, 2005: 65.
- ^ Абу-Лугход, Джанет Л. (1999). Нью-Йорк, Чикаго, Лос-Анджелес: глобальные города Америки . Миннеаполис: Издательство Университета Миннесоты. ISBN 978-0-8166-3336-4 .
- ^ Гутьеррес, Дэвид. Колумбийская история латиноамериканцев в Соединенных Штатах . Нью-Йорк: Издательство Колумбийского университета, 2003: 94.
- ^ Кёртисс, Аарон. «Ожесточенные бои за землепользование наблюдаются в связи с развитием коридора 101». Лос-Анджелес Таймс , 20 ноября 1993 г.: B1.
- ^ Олсен, Энди. «Местные цены на жилье взлетели в мае». Лос-Анджелес Таймс , 23 июня 2003 г.: B3.
- ^ Григгс, Грегори. «Местные дома становятся еще дороже». Лос-Анджелес Таймс , 21 августа 2003 г.: B1.
- ^ Гербер, Росс (28 мая 2014 г.). «Играем всплеск недвижимости в Калифорнии» . Форбс . Архивировано из оригинала 15 июля 2014 года . Проверено 14 июля 2014 г.
- ^ Хейл, Дэвид (2003). Нью-Йорк и Лос-Анджелес: политика, общество и культура: сравнительный взгляд . Чикаго: Издательство Чикагского университета. стр. 181–183, 185 . ISBN 978-0-226-31369-6 .
- ^ Соджа, Эдвард В. (1999). «Разбираем Лос-Анджелес» . Постмодернистские географии: восстановление пространства в критической социальной теории (5-е изд.). Лондон: Версо. стр. 224–233 . ISBN 978-0-86091-936-0 .
- ^ "Разработка" . Новости центра Лос-Анджелеса – Голос центра Лос-Анджелеса . Архивировано из оригинала 30 июня 2019 года . Проверено 29 июня 2019 г.
- ^ Боксалл, Беттина; Сент-Джон, Пейдж (10 ноября 2018 г.). «Самый разрушительный лесной пожар в Калифорнии не должен был стать неожиданностью» . Лос-Анджелес Таймс . Архивировано из оригинала 11 ноября 2018 года . Проверено 11 ноября 2018 г.
- ^ Перейти обратно: а б с д и ж г час я дж к л м н тот п д р с т в v В Гарро, Джоэл (1991). Крайний город . Издательство Кнопф Даблдей. стр. 262–3. ISBN 9780307801944 . Архивировано из оригинала 2 августа 2020 года . Проверено 25 июня 2019 г.
- ^ Уолч, Дженнифер Р.; Мануэль Пастор; Питер Драйер (2004). Против разрастания: государственная политика и создание Южной Калифорнии . Миннеаполис: Издательство Университета Миннесоты. ISBN 978-0-8166-4298-4 .
- ^ «Путешествие из округа Ориндж в округ» (PDF) . Отдел информации о рынке труда . Архивировано из оригинала (PDF) 21 июля 2011 года.
- ^ «Округ Риверсайд — король экстремальных поездок на работу» . Таймс Норт Каунти . Архивировано из оригинала 7 сентября 2008 года . Проверено 17 августа 2008 г.
- ^ «Отдел новостей: Население: Бюро переписи населения публикует данные штата и округа, отражающие численность населения страны в преддверии переписи 2010 года» . Census.gov. Архивировано из оригинала 24 августа 2012 года . Проверено 23 августа 2012 г.
- ↑ Картирование Лос-Анджелеса – Los Angeles Times. Архивировано 5 августа 2011 г. в Wayback Machine . Projects.latimes.com. Проверено 29 июля 2013 г.
- ^ «Окрестности» . Лос-Анджелес Таймс . Архивировано из оригинала 5 августа 2011 года . Проверено 4 октября 2011 г.
- ↑ Шэрон Бернштейн и Дэвид Пирсон, « Лос-Анджелес движется к центру города в стиле Нью-Йорка. Архивировано 7 октября 2008 г. в Wayback Machine », Los Angeles Times , 8 августа 2007 г.
- ^ «Долина Сан-Фернандо» . Британская онлайн-энциклопедия . Архивировано из оригинала 2 июня 2015 года . Проверено 31 августа 2009 г.
- ^ «Город Лос-Анджелес, Калифорния» . Бюро переписи населения США. Архивировано из оригинала 15 февраля 2022 года . Проверено 15 февраля 2022 г.
- ^ «Глобальный индекс городов 2010» . Внешняя политика . 2010. Архивировано из оригинала 2 декабря 2014 года . Проверено 20 октября 2011 г.
- ^ «Отчуждение недвижимости округа Саут-Ориндж – дома и квартиры MLS округа Саут-Ориндж на продажу» . Недвижимость Ориндж-Коста . Архивировано из оригинала 22 июня 2019 года . Проверено 22 июня 2019 г.
- ^ «В офисах Южного ОК растет количество вакансий» . Лос-Анджелес Таймс . 1 июня 2001 г. Архивировано из оригинала 24 июня 2019 г. Проверено 22 июня 2019 г.
- ^ Перейти обратно: а б Рутер, Уолтер; Калаван, Э. Клер; Карман, Глен Э. (1989). «Истоки исследований цитрусовых в Калифорнии» (PDF) . Цитрусовая индустрия . V (глава 5). Окленд: Отдел сельского хозяйства и природных ресурсов Калифорнийского университета . Архивировано из оригинала (PDF) 8 августа 2007 г. Проверено 21 августа 2007 г.
- ^ Петрикс, Марк (30 октября 2007 г.). «Из двух апельсиновых деревьев возникла империя» . Ежедневный бюллетень Внутренней долины . Архивировано из оригинала 24 марта 2008 года . Проверено 15 ноября 2007 г.
- ^ Сорба, Майкл (30 октября 2007 г.). «Рельсы достигают Внутренней Империи» . Ежедневный бюллетень Внутренней долины . Архивировано из оригинала 8 декабря 2007 года . Проверено 27 ноября 2007 г.
- ^ «Карта штата Калифорния Внутренней Империи» (PDF) . Архивировано из оригинала (PDF) 14 августа 2012 г.
- ^ Роберт Э. Лэнг; Дженнифер Б. ЛеФурги (1 октября 2007 г.). Бумбарбы: рост случайных городов Америки . Издательство Брукингского института. стр. 169–. ISBN 978-0-8157-5112-0 . OCLC 1005941809 .
- ^ Дауни, Дэйв (8 марта 2011 г.). «РЕГИОН: За последнее десятилетие население округа Риверсайд выросло на 42 процента» . Сан-Диего Юнион-Трибьюн . Проверено 4 ноября 2021 г.
«2000: Рост Темекулы приветствовался и осуждался» . Пресс-Предприятие . Риверсайд. 8 марта 2011 г. Архивировано из оригинала 5 ноября 2021 г. Проверено 4 ноября 2021 г. - ^ Розенблатт, Сюзанна (27 ноября 2006 г.). « Конечно, «Внутри страны», может быть, «Империя». Где граница?» . Лос-Анджелес Таймс . ISSN 0458-3035 . Архивировано из оригинала 8 января 2014 года . Проверено 8 июля 2009 г.
- ^ «Бюллетень OMB № 10-02: Обновление определений статистических территорий и указаний по их использованию» (PDF) . Управление управления и бюджета США . 1 декабря 2009 г. Архивировано (PDF) из оригинала 21 января 2017 г. . Проверено 7 августа 2012 г.
- ^ «Старые пригороды агломерации Лос-Анджелеса» (PDF) . Комиссия местного самоуправления . Архивировано из оригинала (PDF) 28 мая 2008 г.
- ^ Перейти обратно: а б «P2 латиноамериканцы или латиноамериканцы, а не латиноамериканцы или латиноамериканцы по расе – 2020 год: данные DEC о перераспределении округов (PL 94-171) – округ Лос-Анджелес, Калифорния» . Бюро переписи населения США .
- ^ «Ориндж-Каунт, Калифорния и округ Лос-Анджелес, Калифорния» . Данные США .
- ^ Гарсия, Мэтт (2001). Собственный мир: раса, труд и цитрусовые в создании Большого Лос-Анджелеса, 1900–1970 (2-е изд.). Чапел-Хилл, Северная Каролина: Издательство Университета Северной Каролины. ISBN 978-0-8078-2658-4 .
- ^ «Магнит на Западе» . Время . 2 сентября 1966 года. Архивировано из оригинала 4 декабря 2008 года . Проверено 24 апреля 2008 г.
Большой Лос-Анджелес уже является вторым по численности населения мегаполисом в США и почти наверняка превзойдет Нью-Йорк к 1975 году. Только на прошлой неделе в этот район переехало около 5000 человек. К 1990 году такой рост сделает город центром непрерывной урбанизированной территории с населением почти 19 миллионов человек, занимающей прибрежную зону длиной 175 миль, которая простирается от Санта-Барбары на севере до Сан-Диего на юге.
- ^ Рейнхольд, Роберт (28 августа 1989 г.). «Нет заголовка» . Нью-Йорк Таймс . Проверено 24 апреля 2008 г.
[А] население региона превысит население Нью-Йорка и достигнет 18,3 миллиона человек в 2010 году.
- ^ Выдержка из Министерства финансов Калифорнии.
- ^ «Историческая перепись 1850–2010 гг. – SDC – Демографические исследования – Департамент финансов Калифорнии» . Архивировано из оригинала 28 июня 2014 года . Проверено 16 июня 2014 г.
- ^ «Предки Лос-Анджелеса» . Бюро переписи населения США .
- ^ Чан, Дэвид Р. (15 мая 2017 г.). «Как Ирвин, Калифорния, стал местом китайской кухни» . Блог о ресторанах менюизма . Архивировано из оригинала 15 августа 2022 года . Проверено 16 апреля 2023 г.
- ^ «Корейский квартал OC: Буэна-Парк привлекает жителей и предприятия из Лос-Анджелеса» Daily Pilot . 24 марта 2017 г.
- ^ «В Северном ОК процветает активное корейское сообщество» , 26 августа 2022 г.
- ^ «Буэна Парк открывает первую вывеску Корейского квартала возле входа в торговый центр Source» . 13 октября 2023 г.
- ^ Блэкмор, Вилли. «Топ-10: магазины японской лапши в Торрансе». Лос-Анджелес Еженедельник. Проверено 10 мая 2013 г.
- ^ «Японский Коста Месанс, 1920-1942» . Историческое общество Коста Меса . 7 мая 2019 г.
- ^ «Японо-американская история на острове Терминал» . Лос-Анджелесский заповедник .
- ^ «Район Маленькая Аравия в Анахайме получил официальное признание после многих лет попыток» . 25 августа 2022 г.
- ^ «Мультимедийное путешествие по «Персидской площади» » . ЭНЕРГЕТИЧЕСКИЙ ЯДЕРНЫЙ РЕАКТОР . 25 августа 2022 г.
- ^ «LILAA – Ассоциация Маленькая Италия Лос-Анджелеса» . lilaa.org .
- ^ «Новая, старая» маленькая Италия в Сан-Педро, Лос-Анджелес» .
- ^ «Немного Голландии – это в основном воспоминания» . Лос-Анджелес Таймс . 26 апреля 1987 года.
- ^ «Тернер Центр» . ternercenter.berkeley.edu . Архивировано из оригинала 15 ноября 2020 года . Проверено 22 июня 2019 г.
- ^ «Высокая стоимость жилья в Калифорнии: причины и последствия» . lao.ca.gov . Архивировано из оригинала 16 ноября 2020 года . Проверено 22 июня 2019 г.
- ^ Горовиц, Брюс (18 марта 1986 г.). «Автопроизводители из Азии стекаются в округ Ориндж» . Лос-Анджелес Таймс . Проверено 6 декабря 2023 г.
- ^ Гнерре, Сэм (29 ноября 2021 г.). «История Саут-Бэй: американская штаб-квартира Nissan просуществовала почти полвека» . Ежедневный бриз . Проверено 9 декабря 2023 г.
- ^ « DeviantArt, Inc. Архивировано 13 декабря 2014 г. в Wayback Machine » Businessweek Investing . По состоянию на 9 ноября 2008 г.
- ^ « Контактная информация. Архивировано 30 декабря 2008 г. в Wayback Machine ». Корейский Эйр . Проверено 20 сентября 2008 г.
- ^ «Мировые рейтинги портов - 2005». Архивировано 27 сентября 2007 г., в Wayback Machine - Статистика портовой отрасли - Американская ассоциация портовых властей (AAPA) - Обновлено 1 мая 2007 г. - (документ Microsoft Excel *.XLS)
- ^ «Контейнерные перевозки в портах Северной Америки - 2006 г.» , Архивировано 19 декабря 2008 г., в Wayback Machine - Статистика портовой отрасли - Американская ассоциация портовых властей (AAPA) - Обновлено 14 мая 2007 г. - (Документ Adobe Acrobat *.PDF)
- ^ Часто задаваемые вопросы № 22. Архивировано 13 июня 2010 г., в Wayback Machine в порту Лос-Анджелеса.org.
- ^ «Отчет о ситуации и перспективах MSA Лос-Анджелес-Лонг-Бич-Анахайм, Калифорния» . closeone.com . Архивировано из оригинала 24 февраля 2021 года . Проверено 25 сентября 2019 г.
- ^ «Отчет о ситуации и перспективах MSA Лос-Анджелес-Лонг-Бич-Анахайм, Калифорния» . closeone.com . Архивировано из оригинала 24 февраля 2021 года . Проверено 25 сентября 2019 г.
- ^ «Лос-Анджелес-Лонг-Бич-Анахайм, Калифорния ---ОТЧЕТ РЫНКА---» (PDF) . Зонда . Архивировано (PDF) оригинала 5 марта 2022 г. Проверено 5 марта 2022 г.
- ^ «Классы размера заведений QCEW (для данных на основе NAICS)» . bls.gov . Архивировано из оригинала 14 ноября 2020 года . Проверено 25 сентября 2019 г.
- ^ Перейти обратно: а б «Отдел медицинских услуг» . per.lacity.org . Архивировано из оригинала 24 февраля 2021 года . Проверено 5 марта 2022 г.
- ^ «События в Калифорнии» . Посетите California.com . 20 августа 2018 г. Архивировано из оригинала 2 сентября 2020 г. Проверено 3 декабря 2020 г.
- ^ Уайт, Рональд Д. (7 августа 2011 г.). «Долгое путешествие начальника порта Лонг-Бич близится к концу» . Лос-Анджелес Таймс . Архивировано из оригинала 21 января 2012 года . Проверено 15 июня 2012 г.
- ^ Самые загруженные аэропорты мира по пассажиропотоку.
- ^ «Аэропорты коммерческого обслуживания на основе планов самолетов на 2013 календарный год» (PDF) . ФАА . 26 января 2015 г. Архивировано (PDF) из оригинала 7 марта 2021 г. . Проверено 15 апреля 2018 г.
- ^ «Краткий обзор фактов» . ЛАКМТА . 15 января 2013. Архивировано из оригинала 20 августа 2019 года . Проверено 20 января 2013 г.
- ↑ Управление городского транспорта округа Лос-Анджелес, краткий обзор фактов, архивировано 20 августа 2019 г., в Wayback Machine , 15 января 2013 г.
- ^ «Отчет о транзитных пассажиропотоках за четвертый квартал 2018 г.» (PDF) . Американская ассоциация общественного транспорта . 27 февраля 2020 г. Архивировано (PDF) из оригинала 12 января 2022 г. . Проверено 4 апреля 2020 г.
- ^ «Спортивное путешествие Лос-Анджелеса» . Архивировано из оригинала 18 января 2010 года . Проверено 1 февраля 2010 г.
- ^ «Совет Лос-Анджелеса утверждает схему строительства стадиона НФЛ» . CBSSports.com . 9 августа 2011. Архивировано из оригинала 17 октября 2012 года . Проверено 11 августа 2011 г.
- ^ «Промышленный совет утвердил профессиональный футбольный стадион» . nbcla.com . КНБЦ . 17 июля 2009 года. Архивировано из оригинала 5 сентября 2012 года . Проверено 11 августа 2011 г.
- ^ Адамс, Джон (22 октября 2009 г.). «Лос-Анджелес, вы готовы к футболу НФЛ?» . nbcla.com . КНБЦ . Архивировано из оригинала 12 августа 2011 года . Проверено 11 августа 2011 г.
- ^ Захнисер, Дэвид и Фармер, Сэм (10 августа 2011 г.). «Следующая задача для Farmers Field: найти команду НФЛ для Лос-Анджелеса» Лос-Анджелес сейчас. Лос-Анджелес Таймс . Архивировано из оригинала 6 марта 2016 года . Проверено 13 января 2016 г.