Раса и этническая принадлежность в Соединенных Штатах
| Эта статья является частью серии на |
| Культура Соединенные Штаты |
|---|
 |
| Общество |
| Искусство и литература |
| Другой |
| Символы |
|
United States portal |

Соединенные Штаты имеют расовое и этнически разнообразное население. [ 1 ] На федеральном уровне раса и этническая принадлежность были классифицированы отдельно. Самая последняя перепись Соединенных Штатов признала пять расовых категорий ( белый , черный , коренной индейский / уроженец Аляски , азиатские и родные гавайские / другие тихоокеанские островер ), а также людей, которые принадлежат к двум или более расовым категориям . [ 2 ] [ 3 ] [ 4 ] Соединенные Штаты также признают более широкое представление об этнической принадлежности. Перепись 2000 года и обследование американского сообщества 2010 года поинтересовалось о «происхождении» жителей, в то время как перепись 2020 года позволила людям войти в свое «происхождение». [ 5 ] Бюро переписи также классифицировало респондентов как латиноамериканцев или латиноамериканцев , идентифицируя этническую принадлежность , которая включает в себя группу меньшинств в стране. [ 2 ] [ 3 ] [ 4 ]
Белые американцы являются большинством в каждом определенном переписи региона ( Северо-восток , Средний Запад , Юг и Запад ) и 44 из 50 штатов, кроме Гавайев , [ 6 ] Калифорния , [ 7 ] Техас , [ 8 ] Нью -Мексико , [ 9 ] Невада , [ 10 ] и Мэриленд . [ 11 ] Те, кто идентифицирует себя как белые или в комбинации (включая многорасовые белые американцы), являются большинством в каждом штате, за исключением Гавайев. [12] The region with the highest proportion of White Americans is the Midwest, at 74.6% per the American Community Survey (ACS), followed by the Northeast, at 64%.[13][14] Non-Hispanic whites make up 73% of the Midwest's population, the highest proportion of any region, and they make up 62% of the population in the Northeast.[15][16] At the same time, the regions with the smallest share of White Americans are the West, where they comprise 51.9%, and the South, where they comprise 57.7%.[17][18] Non-Hispanic whites are a minority in the West, where they make up 47.1% of the population.[19] In the South, non-Hispanic whites make up 54% of the population.[20]
Currently, 55% of the African American population lives in the South.[4] A plurality or majority of the other official groups reside in the West. The latter region is home to 42% of Hispanic and Latino Americans, 46% of Asian Americans, 48% of American Indians and Alaska Natives, 68% of Native Hawaiians and Other Pacific Islanders, 37% of the "two or more races" population (Multiracial Americans), and 46% of those self-designated as "some other race".[4][21]
Each of the five inhabited US territories is fairly homogeneous, though each comprises a different primary ethnic group. American Samoa has a high percentage of Pacific Islanders, Guam and the Northern Mariana Islands are mostly Asian and Pacific Islander, Puerto Rico is mostly Hispanic/Latino, and the US Virgin Islands are mostly African American.[22][23][24][25]
Racial and ethnic categories
[edit]Racial categories
[edit]The first United States census in 1790 classed residents as free White people (divided by age and sex), all other free persons (reported by sex and color), and enslaved people. The 2000 census officially recognized six racial categories including people of two or more races; a category called "some other race" was also used in the census and other surveys, but is not official.[2][3][4] In the 2000 census and subsequent Census Bureau surveys, Americans self-described as belonging to these racial groups:[3]
- White American, European American, or Middle Eastern American: those having origins in any of the original peoples of Europe, the Middle East, or North Africa. Following consultations with Middle East and North Africa (MENA) organizations, the Census Bureau announced in 2014 that it would establish a new MENA ethnic category for populations from the Middle East, North Africa, and the Arab world.[28] However, this did not occur on the 2020 census.[29]
- Black or African American: those having origins in any of the native peoples of sub-Saharan Africa. For the 2000 census, this includes people who indicated their race or races as "Black, African Am., or Negro", or wrote in entries such as African American, Afro American, Nigerian, or Haitian.[3]
- American Indian or Alaska Native: those having origins in any of the original peoples of North, Central, and South America.
- Asian American: those having origins in any of the original peoples of the Far East, Southeast Asia, and the Indian subcontinent.
- Native Hawaiian or Other Pacific Islander: those having origins in any of the original peoples of Polynesia, Melanesia, or Micronesia.
- Other: respondents wrote how they identified themselves if different from the preceding categories (e.g. Roma or Aboriginal/Indigenous Australian). However, 95% of the people who report in this category are Hispanic Mestizos.[3][21][30] This is not a standard OMB race category.[3] Responses have included mixed-race terms such as Métis, Creole, and Mulatto, which are generally considered to be categories of multi-racial ancestry (see below),[31] but, write-in entries reported in the 2000 census also included nationalities (as opposed to ethnicities), such as South African, Belizean, or Puerto Rican, as well as other terms for mixed-race groups like Wesort, Melungeon, mixed, interracial, and others.
- Two or more races, widely known as multiracial: those who check off and/or write in more than one race. There is no option labelled "two or more races" or "multiracial" on census and other forms; people who report more than one of the foregoing six options are classified as people of "two or more races" in subsequent processing. Any respondent may identify with any number (including all six) of the racial categories.
In the census, people are asked about their racial identity, including their origins, and whether or not they are of Hispanic ethnicity.[32] These categories are sociopolitical constructs and should not be interpreted as being scientific or anthropological in nature.[2] They have been changed from one census to another, and the racial categories include both "racial" and national origin groups.[33][34]
In 2007, the Equal Employment Opportunity Commission of the US Department of Labor finalized the update of its EEO-1 report[35] format and guidelines concerning the definitions of racial or ethnic categories.
In March 2024, the Office of Management and Budget published revisions to Statistical Policy Directive No. 15: Standards for Maintaining, Collecting, and Presenting Federal Data on Race and Ethnicity that address: (1) combined question for race and ethnicity; (2) adding a "Middle Eastern or North African (MENA)" category; and (3) collecting additional detail to enable data disaggregation.[36][37]
Census-designated ethnicities: Hispanic or Latino origin
[edit]The question on Hispanic or Latino origin is separate from the question on race.[3][38] Hispanic and Latino Americans have ethnic origins in a Spanish-speaking country or Brazil. Latin American countries are, like the United States, racially diverse.[39] Consequently, no separate racial category exists for Hispanic and Latino Americans, as they do not constitute a race, nor a national group. When responding to the race question on the census form, each person is asked to choose from among the same racial categories as all Americans, and are included in the numbers reported for those races.[40]
Each racial category may contain Non-Hispanic or Latino and Hispanic or Latino Americans. For example: the White or European American race category contains Non-Hispanic Whites and Hispanic Whites (see White Hispanic and Latino Americans); the Black or African American category contains Non-Hispanic Blacks and Hispanic Blacks (see Black Hispanic and Latino Americans); the Asian American category contains Non-Hispanic Asians and Hispanic Asians (see Asian Hispanic and Latino Americans), and likewise for all the other categories.
Self-identifying as both Hispanic or Latino and not Hispanic or Latino is neither explicitly allowed nor explicitly prohibited.[2]
Ethnicity, national origin, and cultural groups (generally not mentioned in census data)
[edit]Social definitions of race
[edit]This section needs additional citations for verification. (June 2022) |
Since the concept of race became widespread in the early United States, people of Native American heritage, African heritage, and European heritage were considered to belong to different races. For nearly three centuries, the criteria for membership in these groups were similar; a person's appearance, their social circle (how they lived), and ancestry were all considered by society when determining someone's race.
The motivations behind historical definitions of racial identity, especially Native American and black identities, have been the topic of much discussion in modern years. According to many anthropologists, these racial designations were a means to concentrate power, wealth, privilege and land in the hands of white people in a society of white hegemony and privilege. Racial distinctions generally had little to do with biology and more to do with the history of slavery, the systemic racism it produced, and specific forms of white supremacy that benefited from specific definitions of racial identity. For example, it has been suggested that the blood quantum laws defining Native American identity enabled whites to acquire indigenous lands during the allotment process, and the one-drop rule of black identity, enforced legally in the early 20th century, enabled them to preserve their agricultural labor force in the South.
The descendants of Native and Black Americans not only had to contend with laws defining their racial identity for the benefit of the majority, but also with a variety of social consequences depending on how they were perceived in society. Compared to other mixed Americans, the blood quantum laws made it easier for a person of mixed European and Native American ancestry to be accepted as white; after a few generations of intermarriage, the offspring of Native and White Americans would no longer legally be considered Native American. They could have treaty rights to land, but because an individual with only one native great-grandparent was no longer was classified as Native American, they lost legal claim to their land under historical allotment rules, making it easier for White Americans to acquire the land for their own development. On the other hand, the same individual who could be denied legal standing in a tribe because he was "too White" to claim property rights might still have enough visually identifiable native ancestry to be considered socially as a "half-breed" and stigmatized by both communities.
The 20th century one-drop rule made it relatively difficult for anyone of known black ancestry to be accepted as white. The child of a black sharecropper and a white person was considered black by the local communities, and would likely become a sharecropper as well, thus adding to the landholder or employer's labor force. Because the agricultural economy of the time benefited from using Black Americans as a labor force, it was advantageous for as many people as possible to be defined as black. Many experts on the Jim Crow period agree that the 20th century notion of invisible blackness shifted the color line in the direction of paleness, and "expanded" the labor force in response to Southern blacks' Great Migration to the North, although others (such as the historians C. Vann Woodward, George M. Fredrickson, and Stetson Kennedy) considered the one-drop rule a consequence of the need to justify the oppression of Black Americans and define whiteness as pure.
Over the centuries, as whites wielded social and political power over people of color in the United States, they created a social order of hypodescent, in which they assigned mixed-race children to the lower-status groups. However, they were often ignorant of the systems of social classification within Native American tribes. The Omaha people, for instance, who had a patrilineal kinship system, classified all children with white fathers as "White", and excluded them as members of the tribe unless they were formally adopted by a male member. Tribal members might care for mixed-race children of White fathers, but they were considered outside the hereditary clan and kinship fundamental to tribal society.[41]
The social construction of hypodescent also related to the racial caste system associated with slavery. It was made explicit by Virginia and other colonies' laws as early as 1662. Virginia incorporated the Roman principle of partus sequitur ventrem into slave law, saying that children of enslaved mothers were born into slavery as well. Under English common law, children's social status was determined by the father, not the mother, but the colonists considered enslaved Africans outside the category of English subjects. Although White men were in positions of power to take sexual advantage of enslaved black women, this meant that their offspring would be considered Black and were enslaved regardless of their parentage. However, most free Black American families listed in the censuses of 1790–1810 were descended from unions between White women and African men in colonial Virginia, from the years when working classes lived and worked closely together, and before slavery had hardened as a racial caste.[42]
In the United States, social and legal conventions developed over time by Whites classified individuals of mixed ancestry into simplified racial categories, but these were always flawed. The decennial censuses conducted since 1790, after slavery was well established in the United States, included a classification of persons by race, with the categories of "White", "Black", "Mulatto", and "Indian". The inclusion of mulatto was a rare explicit acknowledgement of mixed race people, but that status was usually simplified into one race or another in actual society. Before the Civil War, states such as Virginia had a legal definition of whiteness that classified people as white if they were no more than 1/8th black. For example, if not born into slavery, Thomas Jefferson's children by his slave Sally Hemings would have been classified as legally white, as they were 7/8ths White by ancestry. Three of the four surviving children entered white society as adults, and their descendants have identified as white. In the late 18th and 19th centuries, people of mixed race often migrated to frontiers where societies were more open, and they might be accepted as white if they satisfied obligations of citizenship.[42]
The more familiar "one-drop rule" was not adopted by Virginia and other states until the 20th century, but it classified persons with any known African ancestry as black. Passage of these laws was often encouraged by white supremacists and people promoting "racial purity", who disregarded the long history of multi-racial unions in the South.[43] In other countries in the Americas, where mixing among groups was overtly more extensive, social categories have tended to be more numerous and fluid. In some cases, people may move into or out of categories on the basis of a combination of socioeconomic status, social class, ancestry, and appearance.
The term Hispanic as an ethnonym emerged in the 20th century, with the rise of migration of laborers from Spanish-speaking countries of the western hemisphere to the United States. It includes people who may have been considered racially distinct (black, white, native, or other mixed groups) in their home countries. Today, the word "Latino" is often used as a synonym for "Hispanic". Even if such categories were earlier understood as racial categories, today they have begun to represent ethnolinguistic categories, regardless of perceived race. Similarly, the prefix "Anglo" is now used among some Hispanics to refer to non-Hispanic White Americans or European Americans, most of whom speak the English language but are not of primarily English descent. A similar phenomenon of ethnolinguistic identity can historically (and in some cases contemporarily) be seen in the case of the Louisiana Creole people, who may be of any race but share certain cultural characteristics.
Historical trends and influences
[edit]The growth of the Hispanic population through immigration and high birth rates is noted as a partial factor for US population gains in the last quarter-century. The 2000 census revealed that Native Americans had reached their highest documented population, 4.5 million, since the US was founded in 1776.[3] In some cases, immigrants and migrants have formed ethnic enclaves; in others, this mixture of races has created ethnically diverse communities. Earlier immigrants to the Americas came from widely separated regions of Afro-Eurasia, and American immigrant populations frequently mixed among themselves and with the indigenous inhabitants of the continents, creating a complex multiracial population.
Throughout American history, efforts to classify the increasingly mixed population of the United States into discrete categories have generated many difficulties. Early efforts to track mixing between groups led to a proliferation of historical categories (such as "mulatto" and "octaroon" among persons with partial African descent) and "blood quantum" distinctions, which became increasingly detached from self-reported ancestry. By the standards used in early censuses, many mixed-race children born in the US were classified as of a different race than one of their biological parents, and even when these standards were no longer commonly accepted, the combination of social perceptions of race and self-identification with a racial identity frequently complicated legal standards of racial identity. Even people who did not identify as mixed faced the issue of unclear legal terminology; until the 2000 census, Hispanic Americans were required to identify as one race on censuses, and without the option to select Latino or Hispanic, confusion flourished.
Historical trends influencing the ethnic demographics of the United States include:
- Patterns of original settlement
- Settlement of the Americas by Native American First Nations and Alaska Native peoples in several waves over thousands of years, beginning at least 15,000 years ago
- Settlement of Pacific islands by Polynesian people, including Native Hawaiians, Samoans in American Samoa,[44] and the Chamorros in Guam and the Northern Mariana Islands
- Settlement of the Antilles, including the US Virgin Islands and Puerto Rico, by the "Ortoiroid" people, and later by the Arawak-speaking ancestors of the Taíno, Ciboney, and Kalinago people
- Colonization
- Spanish colonization of the Americas, including Florida, the Southwest, and Puerto Rico, which are all today considered part of the United States
- French colonization of the Americas, including the Old Northwest and the lower Mississippi River; historical events, including the Expulsion of the Acadians, influenced the ethnic mix, especially in Louisiana, northern New England, and New York
- Dutch colonization of the Americas, mainly of the Hudson River
- British colonization of the Americas, beginning with Caribbean and the Thirteen Colonies
- Danish colonization of the Americas, including what is now known as the United States Virgin Islands
- Penal transportation to the Americas of felons under British rule
- The popularity of indentured servitude, usually from Ireland, until the late 18th century
- The Atlantic slave trade, which brought millions of Africans to the South, Caribbean, and Latin America
- Severe reduction of Native American populations in the contiguous United States, largely due to new infectious diseases carried by European colonists combined with genocidal warfare
- Forced migration
- Deportation and flight of United Empire Loyalists to Canada, the Caribbean, and Britain after the American Revolution
- Forced removal of more than one million African Americans in the domestic slave trade from the Upper South to the Deep South during the early 19th century as Americans developed new lands for plantations
- Territorial conflict with Native Americans and the Indian removal policy of the 19th century displaced many remaining native populations from east of the Mississippi River to territories to the west, especially to what is now Oklahoma
- Immigration
- Historical immigration to the United States from all countries of the world for religious, political and economic reasons, influenced by laws concerning immigration and naturalization in the United States and illegal immigration to the United States, which denied various entry due to discrimination, economic protectionism, and political conflict with their nation of origin
- Transatlantic migrations from Europe, especially in the 19th century, which created ethnic enclaves in many eastern cities and settling many rural areas east of the Mississippi
- Immigration from Asia, which has had the most influence on Hawaii and the West Coast
- Immigration from Mexico and Latin America, which has strongly influenced the Southwest
- Westward expansion of the United States
- The Royal Proclamation of 1763, which restricted the western boundary of European settlement to the watershed east of the Appalachian Mountains
- The Homestead Act, which promoted settlement west of the Mississippi after the Louisiana Purchase
- Settlement of Utah by members of the Church of Jesus Christ of Latter-day Saints
- California gold rush
- Oregon Trail
- The Klondike gold rush, which promoted settlement of Alaska
- Internal migration
- African Americans escaping from slavery prior to the Civil War, sometimes via the Underground Railroad, and reaching the free North
- The American Industrial Revolution, which promoted urbanization of what was previously a largely agrarian society
- Improved transportation systems increasing the ease of American migration through the country
- The Great Migration and Second Great Migration, in which Black Americans moved to Northern, Midwestern, and Western cities in order to seek economic opportunity and escape racial violence
- Railroads, promoting migration westwards and streetcar suburbs, which created significant ethnic shifts in urban areas
- Natural disasters such as the Dust Bowl
- The suburbanization period after World War II, which produced "white flight" to new housing and away from social unrest, followed by "black flight"
- The development of air conditioning, which encouraged migration from northern areas to the Sun Belt
Racial makeup of the US population
[edit]For demographics by specific ethnic groups rather than general race, see "Ancestry" below.
White and European Americans
[edit]
White and European Americans are the majority of people living in the United States. White people are defined by the United States Census Bureau as those "having origins in any of the original peoples of Europe, the Middle East, or North Africa".[45] Like all official US racial categories, "White" has a "not Hispanic or Latino" and a "Hispanic or Latino" component,[46] the latter consisting mostly of Spanish Americans, Spanish Mexican Americans and Spanish Cuban Americans.
As of 2022, White Americans are the majority in every census-defined region (Northeast, Midwest, South, and West) and 44 out of 50 states. White Americans of one race are not a majority in the states of Hawaii,[6] California,[7] Texas,[8] New Mexico,[9] Nevada,[10] and Maryland, along with the District of Columbia, American Samoa, Guam, the Northern Mariana Islands, Puerto Rico,[47] and the US Virgin Islands.[48][49] However, those identifying as White alone or in combination (including multiracial White Americans) are the majority in every state except for Hawaii, along with being a majority in the territory of Puerto Rico.[12] As of the 2020 US census, non-Hispanic Whites are a majority in 44 states, excluding California, Hawaii, Maryland, Nevada, New Mexico, Texas, the District of Columbia, American Samoa, Guam, the Northern Mariana Islands, Puerto Rico, and the US Virgin Islands.[50][51][48][52][49][53]
The non-Hispanic White percentage of the 50 states and District of Columbia (60.1% in 2019)[54] has been decreasing since the mid-20th century as a result of changes made in immigration policy, most notably the Hart–Celler Act of 1965. If current trends continue, non-Hispanic Whites will drop below 50% of the overall US population by 2050. White Americans overall (non-Hispanic Whites together with White Hispanics, along with many of those identified as "some other race" who are reclassified as White for Census Bureau projections, as this category is not recognized by the Office of Management and Budget[55][56]) are projected to continue as the majority, at 72.6% (or 264 million out of 364 million) in 2060, from currently 75.5%.[57]
Although a high proportion of the population is known to have multiple ancestries, in the 2000 US census, the first with the option to choose more than one, most people still identified with one racial category.[citation needed] In the 2000 census, self-identified German Americans made up 17% of the US population, followed by Irish Americans at 12%, as reported in the 2000 census. This makes German and Irish the largest and second-largest self-reported ancestry groups in the United States. Both groups had high rates of immigration to the US beginning in the mid-19th century, triggered by the Great Famine in Ireland and the failed 1848 Revolution in Germany. English Americans and British Americans are still considered the largest ethnic group, despite the statistical errors caused by events such as the confusion in the 2000 census where many English and British Americans self-identified under the new category entry "American", thus considering themselves indigenous because their families had resided in the US for so long,[58][59][60][61] or, if of mixed European ancestry, identified with a more recent and differentiated ethnic group.[62] 7.2% of the population listed their ancestry as American on the 2000 census (see American ancestry). According to the US Census Bureau, the number of people in the US who reported American and no other ancestry increased from 12.4 million in 1990 to 20.2 million in 2000. This change in reporting represented the largest "growth" of any ethnic group in the United States during the 1990s, but it represented how people reported themselves more than growth through birth rates, for instance, and certainly did not reflect immigration.
Most French Americans are believed to be descended from colonists of Catholic New France; exiled Huguenots, much fewer in number and settling in the eastern English colonies in the late 1600s and early 1700s, needed to assimilate into the majority culture and have intermarried over generations. Some Louisiana Creoles, including the Isleños of Louisiana, and the Hispanos of the Southwest have had, in part, direct Spanish ancestry; most self-reported White Hispanics are of Mexican, Puerto Rican, Cuban, and Salvadoran origins,[63] each of which are multi-ethnic nations. Hispanic immigration has increased from nations of Central and South America.[64]
There are a substantial number of White Americans who are of Eastern and Southern European descent, such as Russian, Polish, Italian, and Greek Americans. Eastern Europeans immigrated to the United States more recently than Western Europeans. Arabs, Turks, Iranians, Israelis, Armenians, and other West Asians are reported as White in the United States census, as a result of a federal court case from 1909, even though most do not identify as White.[65]
Middle Eastern and North African Americans
[edit]There are an estimated 3.5 million Middle Eastern Americans according to the US Census Bureau in 2020 comprising 1.06% of the population[66] and including both Arab and non-Arab Americans.[67] The Arab American Institute in 2014 estimated a population of 3.6 million.[68] US census population estimates are based on responses to the ancestry question on the census, which makes it difficult to accurately count Middle Eastern Americans.[68][69] Though Middle Eastern American communities can be found in each of the 50 states, the majority live in just 10 states; nearly a third live in California, New York, and Michigan.[70] More Middle Eastern Americans live in California than any other state, with ethnic groups such as Arabs, Persians, and Armenians being a large percentage, but Middle Eastern Americans represent the highest percentage of the population of Michigan.[70][71] In particular, Dearborn, Michigan has long been home to a high concentration of Middle Eastern Americans.[72][73]
The US Census Bureau is still finalizing the ethnic classification of MENA populations. Middle Eastern Americans are currently counted as racially White on the census, although many do not identify as such. In 2012, prompted in part by post-9/11 discrimination, the American-Arab Anti-Discrimination Committee petitioned the Department of Commerce's Minority Business Development Agency to designate the MENA populations as a minority/disadvantaged community.[74] Following consultations with MENA organizations, the US Census Bureau announced in 2014 that it would establish a new MENA ethnic category for populations from the Middle East, North Africa, and the Arab world, separate from the "white" classification that these populations had previously sought in 1909. The expert groups felt that the earlier "White" designation no longer accurately represents MENA identity, so they successfully lobbied for a distinct categorization.[28][75] This process does not currently include ethnoreligious groups such as Sikhs, as the Bureau only tabulates these groups as followers of religions rather than members of ethnic groups.[76]
According to the Arab American Institute, countries of origin for Arab Americans include Algeria, Bahrain, Egypt, Iraq, Jordan, Kuwait, Lebanon, Libya, Morocco, Oman, Qatar, Palestine, Saudi Arabia, Syria, Tunisia, United Arab Emirates, and Yemen. As of December 2015, the sampling strata for the new MENA category includes the Census Bureau's working classification of 19 MENA groups, as well as Armenian, Afghan, Iranian, Israeli, Azerbaijani, and Georgian groups.[77] The new category will identify "Israeli" as a choice and raises questions as to how the large US Jewish population (7-8 million) will identify.[78]
The new question on the US census will identify the MENA category to include:[79]
- "Individuals with origins in any of the original peoples of the Middle East or North Africa, including, for example, Lebanese, Iranian, Egyptian, Syrian, Iraqi, and Israeli."
African Americans
[edit]African Americans, or Black Americans, are citizens of the United States with African ancestry.[80] According to the Office of Management and Budget, the grouping includes individuals who self-identify as African American and are descended from Africans that were forcibly relocated to the United States and enslaved, as well as those who recently and voluntarily emigrated from nations in the Caribbean and sub-Saharan Africa.[81] Both groups of people may also identify as Black or some other written-in race. However, some immigrants from the continent of Africa do not identify as Black and are not socially perceived as such, such as the Afrikaners of South Africa.[80] According to the 2009 American Community Survey, there were 38,093,725 Black and African Americans in the United States, representing 12.4% of the population. There were 37,144,530 non-Hispanic Blacks, which comprised 12.1% of the population.[82] According to the 2010 US census, this number increased to 42 million when including multiracial African Americans,[81] making up 13% of the total US population.[a][84] African Americans make up the second largest group in the United States, but the third largest group after White Americans and Hispanic or Latino Americans of any race.[85] The majority of the population (55%) lives in the South, and there has been a decrease of African Americans in the Northeast and Midwest.[84] The US state/territory with the highest percentage of African Americans is the US Virgin Islands (76% African American as of 2010).[25]
Most African Americans are the direct descendants of captives from West Africa, who survived the slavery era within the boundaries of the present United States.[86] The first West Africans were brought to Jamestown, Virginia in 1619. The English settlers treated these captives as indentured servants and released them after a number of years. This practice was gradually replaced by the system of race-based slavery used in the Caribbean.[87] All the American colonies had slavery, but it was usually in the form of personal servants in the North (where 2% of the population were enslaved), and field hands in plantations in the South (where 25% were enslaved);[88] by the beginning of the American Revolutionary War, a fifth of the total population was enslaved.[89] During the revolution, some served in the Continental Army or Continental Navy,[90][91] while others fought for the British Empire in units such as the Ethiopian Regiment.[92] By 1804, the states north of the Mason–Dixon line had abolished slavery.[93] However, slavery would persist in the Southern states until the end of the American Civil War and the passage of the Thirteenth Amendment.[94] Following the end of the Reconstruction era, which saw the first African American representation in Congress,[95] African Americans became disenfranchised and subject to Jim Crow laws,[96] legislation that would persist until the passage of the Civil Rights Act of 1964 and Voting Rights Act of 1965 due to the civil rights movement.[97]
According to US Census Bureau data, very few African immigrants self-identify as "African-American" (as "African-American" is usually referring to Blacks with deeply rooted ancestry dating back to the US slave period as discussed in the previous paragraph.) On average, less than 5% of African residents self-reported as "African-American" or "Afro-American" in the 2000 US census. The overwhelming majority of African immigrants (~95%) identified instead with their own respective ethnicities. Self-designation as "African-American" or "Afro-American" was highest among individuals from West Africa (4–9%), and lowest among individuals from Cape Verde, East Africa, and Southern Africa (0–4%).[98] Nonetheless, African immigrants often develop very successful professional and business working-relationships with African Americans. Immigrants from some Caribbean, Central American, and South American nations and their descendants may or may not also self-identify with the term "African American".[99]
Recent African immigrants in the United States come from countries such as Jamaica, Haiti, Nigeria, Ethiopia, Dominican Republic, Ghana, Trinidad and Tobago, Kenya, Guyana, and Somalia.[100]
Native Americans and Alaska Natives
[edit]Indigenous peoples of the Americas, particularly Native Americans, made up 2.9% of the population in 2020, numbering 3.7 million. An additional 5.9 million persons declared part-American Indian or Alaska Native ancestry.[101] Levels of Native American ancestry (distinct from Native American identity) differ. According to a study using data from 23andMe customers, genomes of self-reported African Americans averaged to 0.8% Native American ancestry, those of European Americans averaged to 0.18%, and those of Latinos averaged to 18.0%.[102][103]
The legal and official designation of who is Native American has aroused controversy by demographers, tribal nations, and government officials for many decades. Federally recognized tribes and state recognized tribes set their own membership requirements; tribal enrollment may require residency on a reservation, documented lineal descent from recognized records, such as the Dawes Rolls, and other criteria. Some tribes have adopted the use of blood quantum, requiring members to have a certain percentage. The federal government requires individuals to certify documented blood quantum of ancestry for certain federal programs, such as education benefits, available to members of recognized tribes. Census takers accept any respondent's identification. Genetic scientists estimated that more than fifteen million other Americans, including African and Hispanic Americans (specifically those of Mexican heritage), may have up to one quarter of Native ancestry.[citation needed]
Once thought to face extinction as a race or culture, Native Americans of numerous tribes have achieved revival of aspects of their cultures, and have fought to retain sovereignty and control of their own affairs for centuries. In recent years, many have started language programs to revive use of traditional languages, established tribally controlled colleges and other schools on their reservations, and developed gaming casinos on their sovereign land to raise revenues for economic development, as well as to promote the education and welfare of their people through health care and construction of improved housing.
Today, more than 800,000 to one million persons claim Cherokee descent in part or as full-bloods; of these, an estimated 300,000 live in California, 160,000 in Oklahoma (of which a majority are Cherokee Nation citizens), and 15,000 in North Carolina, living in ancestral homelands as members of the Eastern Band of Cherokee Indians.[104]
The second largest tribal group is the Navajo, who call themselves Diné and live on a 16‑million-acre[b] Indian reservation covering northeast Arizona, northwest New Mexico, and southeast Utah. It is home to half of the 450,000 members of the Navajo Nation.[citation needed] The third largest group are the Lakota (Sioux) Nation, with distinct federally recognized tribes located in the states of Minnesota, Nebraska, Montana, Wyoming; and North and South Dakota.[citation needed][clarification needed]
As of the 2020 census, the largest self-identified Native American group not combined with another race is Aztec, numbering 378,122 individuals. Though Aztecs are indigenous to Mexico and not the United States, they are nevertheless considered Native American people per census guidelines, which includes any indigenous people from the Americas.[105][106] Of the 3.2 million Americans who identified as American Indian or Alaska Native alone in 2022, around 45% are of Hispanic or Latino ethnicity, with this number growing as increasing numbers of Indigenous people from Latin American countries immigrate to the US and more Latinos self-identify with indigenous heritage.[107]
Asian Americans
[edit]A third significant minority is the Asian American population, which comprised 19.36 million people, or 5.9% of the US population, in 2019.[54] In 2019, 6.12 million Asian Americans lived in California.[51] As of 2019, approximately 532,300 Asians live in Hawaii, forming 37.6% of the islands' people.[50] This makes Hawaii the state with the highest percentage of Asian Americans.[108] Although they were historically first concentrated in Hawaii and the West Coast, Asian Americans now live across the country, living and working in large numbers in New York City, Chicago, Boston, Houston, and other major urban centers. There are also many Asians living in two Pacific US territories (Guam and the Northern Mariana Islands) – as of 2010, Guam's population was 32.2% Asian, and the population of the Northern Mariana Islands was 49.9% Asian.[23]
Filipinos have been in the territories that would become the United States since the 16th century. In 1635, an "East Indian" is listed in Jamestown, Virginia; preceding wider settlement of Indian immigrants on the East Coast in the 1790s and the West Coast in the 1800s. In 1763, Filipinos established the small settlement of Saint Malo, Louisiana, after fleeing mistreatment aboard Spanish ships. Since there were no Filipino women with them, these "Manilamen", as they were known, married Cajun and indigenous women. The first Japanese person to come to the United States, and stay any significant period of time was Nakahama Manjirō who reached the East Coast in 1841, and Joseph Heco became the first Japanese American naturalized US citizen in 1858. As with the new immigration from central and eastern Europe to the East Coast from the mid-19th century on, Asians started immigrating to the United States in large numbers in the 19th century. This first major wave of immigration consisted predominantly of Chinese and Japanese laborers, but also included Korean and South Asian immigrants. Many immigrants also came during and after this period from the Philippines, which was a US colony from 1898 to 1946. Exclusion laws and policies largely prohibited and curtailed Asian immigration until the 1940s. After the US changed its immigration laws during the 1940s to 1960s to make entry easier, a much larger new wave of immigration from Asia began. Today, the largest self-identified Asian American sub-groups, according to census data, are Chinese Americans, Filipino Americans, Indian Americans, Vietnamese Americans, Korean Americans, and Japanese Americans, among other groups.[109]
Не все предки американцев азиатских американцев непосредственно мигрировали из своей страны происхождения в США. Например, более 270 000 человек из Гайаны, южноамериканской страны, проживают в США, но преобладающее количество гайанских народа индийского происхождения . [ 110 ]
Коренные гавайцы и другие американцы тихоокеанских островов американцев
[ редактировать ]В 2019 году коренные гавайцы и другие тихоокеанские островщики насчитывали около 656 400 или 0,2% населения. [ 54 ] Кроме того, почти столько же людей идентифицируют себя как имеющие частичное коренное гавайское происхождение, в общей сложности 829 949 человек полного или частичного коренного гавайского происхождения. [ 111 ] Эта группа представляет собой наименьшее меньшинство в Соединенных Штатах. Более половины идентифицируют себя как «полнокровные», но исторически большинство местных гавайцев на островной сети Гавайев, как полагают, имеют некоторое азиатское и европейское происхождение. [ Цитация необходима ]
Некоторые демографы считают, что к 2025 году последний полнокровный коренной житель будет умереть, оставив культурно отличное, но расово смешанное население. [ Цитация необходима ] Тем не менее, на Гавайях они работают над сохранением и утверждением адаптации местных гавайских обычаев и гавайского языка , создавая культурные школы исключительно для юридически коренных гавайских студентов и многое другое.
Существует значительное население островов Тихого океана, проживающие на трех тихоокеанских территориях США ( Американский Самоа , Гуам и северные Марианские острова ). По состоянию на 2010 год Американского Самоа население составило 92,6% тихоокеанского острова (в основном Самоа ), чаморро население Гуама составило 49,3% тихоокеанского островов (в основном ) , а население северных островов Марианы составило 34,9% Тихоокеанского острова. [ 22 ] [ 23 ] Из всех штатов/территорий США/территорий американский Самоа имеет самый высокий процент жителей островов тихоокеанских островов. [ 22 ]
Две или более гонок
[ редактировать ]Самоидентифицированные многорасовые американцы насчитывали 7,0 млн. В 2008 году или 2,3% населения. [ 112 ] Они идентифицировали любую комбинацию рас (белый, черный или афроамериканский, азиатский, американский индейский или уроженец Аляски, родной гавайский или другой тихоокеанский остров, и «какая -то другая раса») и этнические группы. [ 113 ] США имеют растущее движение многорасовой идентичности.
В то время как колонии и южные штаты защищали белых отцов, заставляя всех детей, рожденных для рабовладельческих матерей как рабов, независимо от отцовства, они также запрещали смещение или межрасовый брак , особенно между белыми и черными. Тем не менее, это мало что могло остановить межрасовые отношения. Демографы утверждают, что из-за новых волн иммиграции американский народ в начале 20-го века был в основном многоэтническими потомками различных национальностей иммигрантов, которые сохраняли культурную отличительность, пока со временем ассимиляция , миграция и интеграция . не произошла [ Цитация необходима ] Движение за гражданские права в течение 20 -го века получило принятие важного законодательства по обеспечению соблюдения конституционных прав меньшинств, включая многорасовых американцев.
Многорасовая популяция, которая является частью белой, является наибольшим процентом многорасовой популяции. По состоянию на переписи 2000 года 7 015 017 человек, идентифицированные как белые/американские индейцы и уроженец Аляски, 737 492 как белый/черный, 727 197 как белый/азиатский и 125 628 как белый/местный гавайский и тихоокеанский остров. [ 114 ]
Генетическая примесь
[ редактировать ]Исследование 2002 года показало в среднем 18,6% европейского генетического вклада и 2,7% генетического вклада коренных американцев (со стандартными ошибками 1,5% и 1,4% соответственно) в выборке из 232 афроамериканцев. [ Цитация необходима ] Между тем, в выборке из 187 европейских американцев из Государственного колледжа, Пенсильвании , в среднем вклады в западноафриканский генетический вклад в среднем составлял 0,7% и генетический вклад в 3,2% (со стандартными ошибками 0,9% и 1,6% соответственно). Большая часть невропейской примеси была сконцентрирована в 30% выборки, при этом западноафриканская примеси в диапазоне от 2 до 20% со средним уровнем 2,3%. [ 115 ]
В 1958 году Роберт Стакерт произвел статистический анализ, используя исторические данные переписи и иммиграционную статистику. Он пришел к выводу, что рост белого населения не может быть отнесен исключительно с рождением в белом населении и иммиграции из Европы, но также связано с тем, что люди, идентифицирующие себя как белые, которые были частично черными. Он пришел к выводу, что 21% белых американцев имели недавние афро-американские предки и что большинство американцев известного африканского происхождения были частично европейскими и не полностью африканскими юристами. [ 116 ]
Совсем недавно многие исследования ДНК показали, что многие афроамериканцы имеют европейскую примесь, отражая долгую историю в этой стране различных групп населения. Пропорции европейской примеси в афро-американской ДНК были обнаружены в исследованиях 17% [ 117 ] и от 10,6% до 22,5%. [ 118 ] Другое недавнее исследование показало, что среднее составляет 21,2%, со стандартной ошибкой 1,2%. [ 115 ]
Работа, этническая принадлежность и генетика Национального института исследований генома человека отмечает, что «хотя генетический анализ большого количества локусов может дать оценки процента предков человека из различных континентальных популяций, эти оценки могут предположить ложную отличительность Из родительского населения, поскольку человеческие группы обменивались товарищами от местных до континентальных масштабов на протяжении всей истории ». [ 119 ]
Члены других рас.
[ редактировать ]Этот раздел нуждается в расширении . Вы можете помочь, добавив к этому . ( Январь 2022 г. ) |
В переписи 2000 года нестандартная категория «Другое» [ 3 ] был особенно предназначен для захвата таких ответов, как Mestizo и Mulatto , [ 31 ] Две крупные многорасовые группы в большинстве стран происхождения латиноамериканцев и латиноамериканцев. Тем не менее, многие другие ответы захватываются категорией.
В 2008 году 15 миллионов человек, почти пять процентов от общего числа населения США, оценивались как «какая -то другая раса», [ 112 ] с 95% из них являются латиноамериканцами или латиноамериканцами. [ 21 ]
Из-за нестандартного статуса этой категории статистика государственных учреждений, кроме Бюро переписей (например, центров контроля заболеваний данных по жизненно важной статистике или статистики преступности ФБР ), но также и собственного официального населения Бюро По оценкам, опустите категорию «Некоторые другие расы» и включают большинство людей в этой группе в белом населении, включая подавляющее большинство (около 90%) латиноамериканских и латиноамериканцев в белом населении. [ 120 ]
Латиноамериканцы и латиноамериканцы
[ редактировать ]Латиноамериканское или латиноамериканское население по расе (2020):
| Латиноамериканцы в 2020 году ( латиноамериканская Америка ) | |||||||
|---|---|---|---|---|---|---|---|
| Год | Население | % из
Латиноамериканцы |
% из
США |
Процент изменения | |||
| Многорасовый | 20,299,960 | 32.70% | 6.12% | 567.2% | |||
| Белый (один) | 12,579,626 | 20.26% | 3.80% | -52.9% | |||
| Родной (один) | 1,475,436 | 2.38% | 0.45% | 115.3% | |||
| Черный (один) | 1,163,862 | 1.87% | 0.35% | -6.2% | |||
| Азиатский (один) | 267,330 | 0.43% | 0.08% | 27.8% | |||
| Тихоокеанский остров (один) | 67,948 | 0.11% | 0.02% | 16.3% | |||
| Какая -то другая раса (одна) | 26,225,882 | 42.25% | 7.91% | 41.7% | |||
| Общий | 62,080,044 | 100% | 18.73% | ||||
| Источник: перепись 2020 года. [ 121 ] | |||||||
Латиноамериканские или латиноамериканцы - 59,8 миллиона человек, или 18,3% от общего числа населения США по состоянию на 2018 год. [ 122 ] Категория включает в себя людей, которые имеют полное или частичное латиноамериканское или латиноамериканское происхождение. Как правило, они происходят в испаноязычных странах Латинской Америки, хотя некоторые из них также приходят из других мест (например, 0,2% латиноамериканцев и латиноамериканцев родились в Азии). [ 123 ] Группа неоднородна в расе и национальном происхождении.
Таким образом, бюро переписи определяет «испаноязычное или латиноамериканское происхождение»:
Для переписи 2000 года, обследование американского сообщества: люди, которые идентифицируют себя с терминами «латиноамериканцы» или «латиноамериканцы», - это те, кто классифицирует себя в одной из конкретных латиноамериканских или латиноамериканских категорий, перечисленных по анкету Census 2000 или ACS («мексиканский», «Пуэрто Рикан, «или« кубинский »), а также те, кто указывает, что это« другие испанские, латиноамериканские или латиноамериканские ». Происхождение можно рассматривать как наследие, национальная группа, происхождение или страна рождения человека, или родителей или предков человека, до их прибытия в Соединенные Штаты. Люди, которые идентифицируют свое происхождение как испанского, латиноамериканского или латиноамериканского языка, могут быть любой расы. [ 124 ]
Согласно обзору американского сообщества латиноамериканцев являются мексиканские 37,2 ( млн 2019 . ) года, ведущими предками для [ 125 ] Кроме того, в Пуэрто -Рико живет 3,19 миллиона человек, которые исключены из графства (см. Пуэрто -риканцы ).
Латиноамериканское население и латиноамериканцев в Соединенных Штатах достигло 58 миллионов по состоянию на 2016 год, и с 2000 года является основным фактором демографического роста США. Мексиканцы составляют большую часть латиноамериканского и латиноамериканского населения - 35 758 000. В Соединенных Штатах также есть крупные доминиканские , гватемальские , колумбийские , гондуранские , испанские , эквадорские , перуанские , сальвадорские , никарагуанские , венесуэльцы , аргентинские и панамские популяции. [ 126 ] Население латиноамериканцев, получивших образование в колледже, также растет; В 2015 году 40% латиноамериканцев в возрасте от 25 лет и старше получили опыт колледжа, но в 2000 году этот процент составил 30%. Среди штатов США в Калифорнии находится самое большое население латиноамериканцев. В 2019 году в Калифорнии жили 15,56 миллионов. [ 51 ] [ 127 ] По состоянию на 2019 год территорией США с наибольшим процентом латиноамериканцев/латиноамериканцев является Пуэрто -Рико (98,9% латиноамериканцев или латиноамериканцев). [ 50 ] [ 24 ]
Латиноамериканская или латиноамериканская популяция молода и быстрорастущая из-за иммиграции и более высокого рождаемости. [ 123 ] В течение десятилетий он значительно способствовал увеличению численности населения США, и ожидается, что это будет продолжаться. Бюро переписей прогнозирует, что к 2050 году четверть населения будет латиноамериканцем или латиноамериканцами. [ 128 ] [ 129 ]
Происхождение
[ редактировать ]Происхождение народа Соединенных Штатов широко разнообразно и включает в себя потомков населения со всего мира. В дополнение к его вариации, происхождение людей в Соединенных Штатах также отмечено различным количеством смешанных браков между этническими и расовыми группами.
В то время как некоторые американцы могут проследить свое происхождение до одной этнической группы или населения в Европе , Африке или Азии , они часто являются американцами первого, второго и третьего поколения. Как правило, степень смешанного наследия увеличивает более длинные предки людей в Соединенных Штатах (см. Плавильный котел ). Существует несколько средств, доступных для обнаружения происхождения людей, живущих в Соединенных Штатах, включая генеалогию , генетику , устную и письменную историю , а также анализ переписи населения федеральных графиков ; На практике лишь немногие из них использовались для большей части населения.
Немецкий английский норвежский голландский финский ирландский ирландский французский итальянец
Мексиканская коренная испанская американская афроамериканская пуэрториканца

2022 Обзор американского сообщества
[ редактировать ]о самоотчете В этой таблице отображаются все предложения с более чем 50 000 членов, в одиночку или в комбинации, согласно оценкам опроса американского сообщества 2022 года. Общая численность населения США в соответствии с опросом составила 333 287 550 550, и 251 732 240 человек сообщили о происхождении. Из них 175,054 020 сообщили о одном происхождении, а 76 678 224 сообщили о двух или более предках . [ 130 ] Латиноамериканские группы не различают полного и частичного происхождения [ 131 ] [ 132 ] [ 133 ] [ 134 ] [ 135 ]
| Происхождение | Число в 2022 году (в одиночку) [ 136 ] | Число по состоянию на 2022 год (отдельно или в любой комбинации) | % Общий |
|---|---|---|---|
| Черный или афроамериканец
(Включая афро-карибский и странный африканец) |
40,603,656 | 47,859,760 | 14.4% |
| немецкий | 13,241,923 | 41,137,168 | 12.3% |
| Мексиканец | — | 37,414,772 | 11.2% |
| Английский | 12,331,696 | 31,380,620 | 9.4% |
| Ирландский | 8,649,243 | 30,655,612 | 9.2% |
| Американец
(В основном старые белые американцы британского происхождения) |
14,929,899 | 17,786,214 | 5.3% |
| Итальянский | 5,766,634 | 16,009,774 | 4.8% |
| Лак | 2,658,632 | 8,249,491 | 2.5% |
| Французский
(Не считая французского канадца ) |
1,360,631 | 6,310,548 | 1.9% |
| Пуэрто -Риканец | — | 5,905,178 | 1.8% |
| китайский
(Не включая тайваньский ) |
4,258,198 | 5,465,428 | 1.6% |
| Шотландский | 1,555,579 | 5,352,344 | 1.6% |
| Индийский | 4,534,339 | 4,946,306 | 1.5% |
| В целом " европейский "
(Ни одна страна не указана) |
3,718,055 | 4,819,541 | 1.4% |
| Филиппинец | 2,969,978 | 4,466,918 | 1.3% |
| Шведский | 740,478 | 3,936,772 | 1.2% |
| норвежский | 1,224,373 | 3,317,462 | 1.0% |
| Голландский | 858,809 | 3,019,465 | 0.9% |
| Американец коренного населения
(Не указано племя) |
493,837 | 2,550,528 | 0.8% |
| Скотч-ирландский | 940,337 | 2,524,746 | 0.8% |
| SASCIAVADORAN | — | 2,480,509 | 0.7% |
| Кубинский | — | 2,435,573 | 0.7% |
| Доминиканский | — | 2,396,784 | 0.7% |
| вьетнамский | 1,887,550 | 2,301,868 | 0.7% |
| Другое латиноамериканское или латиноамериканское
(Включая испано , Калифорнию , Теджано , Айленьо и неуточненное испаноязычное происхождение) |
— | 2,276,867 | 0.7% |
| Арабский
(В том числе ливанцы (583 719), египтянин (334 574), сирийский (203 282), палестинский (171 969), Ирак (164 851), Марокканский (140, 196) и все другие арабские предки), Марокканский (140, 196) и все другие арабские предки |
1,502,360 | 2,237,982 | 0.7% |
| Русский | 747,866 | 2,099,079 | 0.6% |
| корейский | 1,501,587 | 2,051,572 | 0.6% |
| испанский
(Включая ответы «испанца», «испанского» и «испанского американца». Многие испано идентифицируют Нью -Мексико как испанский/испанец) |
— | 1,926,228 | 0.6% |
| Гватемал | — | 1,878,599 | 0.6% |
| В широком смысле « африканский »
(Не указано) |
1,297,668 | 1,721,108 | 0.5% |
| Французский канадец | 694,089 | 1,626,456 | 0.5% |
| Японский | 717,413 | 1,587,040 | 0.5% |
| валлийский | 293,551 | 1,521,565 | 0.5% |
| Колумбиян | — | 1,451,271 | 0.4% |
| Чероки | 239,224 | 1,449,888 | 0.4% |
| португальский | 543,531 | 1,350,442 | 0.4% |
| венгерский | 390,561 | 1,247,165 | 0.4% |
| Ямайский | 903,516 | 1,234,336 | 0.4% |
| Гондуран | — | 1,219,212 | 0.4% |
| Греческий | 486,878 | 1,200,706 | 0.4% |
| В широком смысле «британцы »
(Не указано) |
503,077 | 1,196,265 | 0.4% |
| чешский | 340,768 | 1,188,711 | 0.4% |
| Украинский | 565,431 | 1,164,728 | 0.3% |
| Гаитянский | 937,373 | 1,138,855 | 0.3% |
| Датский | 268,019 | 1,127,518 | 0.3% |
| В широком смысле " восточная европейская "
(Не указано) |
566,715 | 951,384 | 0.3% |
| В широком смысле " Скандинавский "
(Не указано) |
372,673 | 935,153 | 0.3% |
| Мексиканский коренной | 548,717 | 875,183 | 0.3% |
| Эквадорский | — | 870,965 | 0.3% |
| Швейцарский | 196,120 | 847,247 | 0.3% |
| Венесуэль | — | 814,080 | 0.2% |
| Перуанский | — | 751,519 | 0.2% |
| Родный Гавайский | 185,466 | 714,847 | 0.2% |
| Нигерийский | 532,438 | 712,294 | 0.2% |
| Центральная Америка из числа коренных народов
( Майя и т. Д.) |
315,313 | 634,503 | 0.2% |
| Пакистанец | 560,494 | 625,570 | 0.2% |
| Финский | 189,603 | 606,028 | 0.2% |
| словацкий | 186,902 | 602,949 | 0.2% |
| литовский | 167,355 | 598,508 | 0.2% |
| В широком смысле " азиат "
(Не указано) |
218,730 | 591,806 | 0.2% |
| Австрийский | 123,987 | 584,517 | 0.2% |
| Бразилец | 389,082 | 546,757 | 0.2% |
| Канадский | 249,309 | 542,459 | 0.2% |
| Иранский | 392,051 | 519,658 | 0.2% |
Тем не менее, демографы рассматривают сообщаемое число английских американцев как статистическую ошибку, поскольку индекс несоответствия высок, а многие, если не большинство, американцы из английского запаса имеют тенденцию идентифицировать просто как американцы, [ 137 ] [ 138 ] [ 139 ] [ 140 ] или, если из смешанного европейского происхождения, с другой европейской этнической группой. [ 62 ]
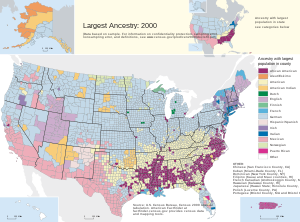
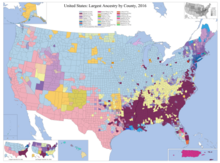
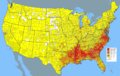
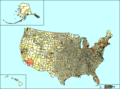
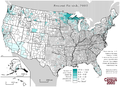
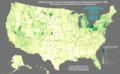
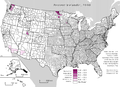
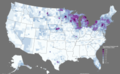
Карты происхождения
[ редактировать ]Крупные предки
[ редактировать ]Эти изображения отображают частоты самооценки предков, по состоянию на переписи США 2000 года. Региональные африканские предки не перечислены, хотя из другого источника была добавлена афроамериканская карта.
-
 Частота американского происхождения
 -
 Плотность азиатских американцев
 -
 Процент азиатских американцев
 -
 Плотность афроамериканцев
 -
 Процент афроамериканцев
 -

-

-
 Плотность коренных американцев
 -
 Процент коренных американцев
 -
 Плотность белых американцев
 -
 Процент белых американцев
 -
 Африканское происхождение
 -
 Арабское происхождение
 -
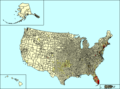
 Плотность латиноамериканского происхождения
 -
 Процент испаноязычного происхождения
 -
 Западно -индийское происхождение


Европейские американские предки
[ редактировать ]Эти изображения отображают частоты самооценки европейских американских предков на посту переписи США 2000 года.
-
-
-
-
-
-

-
 Французское канадское происхождение
 -

-

-
-
-

-
-

-
-
-
-

-

-
-

-

-

-


Смотрите также
[ редактировать ]- Культура Соединенных Штатов
- Культура южного Соединенного Штата
- Демография Соединенных Штатов
- Дискриминация в Соединенных Штатах
- Этнокультурная политика в Соединенных Штатах
- Историческая расовая и этническая демография Соединенных Штатов
- История Соединенных Штатов
- История южных Соединенных Штатов
- Иммиграция в Соединенные Штаты
- Язык, на котором говорят дома
- Нативизм в политике Соединенных Штатов
- Человек цвета
- Политика Соединенных Штатов
- Политика южного Соединенного Штата
- Раса и преступность в Соединенных Штатах
- Расизм против афроамериканцев
- Расизм в Соединенных Штатах
- Религия в Соединенных Штатах
- Рабство в Соединенных Штатах
- Ксенофобия в Соединенных Штатах
Примечания
[ редактировать ]Ссылки
[ редактировать ]- ^ «Наше разнообразное население: раса и латиноамериканское происхождение, 2000» (PDF) . Бюро переписи Соединенных Штатов . Получено 16 апреля 2005 года .
- ^ Jump up to: а беременный в дюймовый и «Пересмотр стандартов для классификации федеральных данных о расе и этнической принадлежности» . Управление управления и бюджета . Архивировано из оригинала 8 февраля 2004 года . Получено 5 мая 2008 года .
- ^ Jump up to: а беременный в дюймовый и фон глин час я Дж Грико, Элизабет М; Рэйчел С. Кэссиди. «Обзор расы и латиноамериканского происхождения: 2000» (PDF) . Бюро переписи Соединенных Штатов . Получено 30 января 2008 года .
- ^ Jump up to: а беременный в дюймовый и «Сайт Бюро переписи Соединенных Штатов» . Оценка населения 2008 года . Бюро переписи Соединенных Штатов . Получено 28 февраля 2010 года .
- ^ «Ирландские американцы должны ответить на этнический вопрос в 2020 году переписи США» . Получено 5 мая 2021 года .
- ^ Jump up to: а беременный «Вид сетки: Таблица B02001 - Репортер переписи» . CensusReporter.org . Получено 3 июля 2024 года .
- ^ Jump up to: а беременный «Вид сетки: Таблица B02001 - Репортер переписи» . CensusReporter.org . Получено 3 июля 2024 года .
- ^ Jump up to: а беременный «Вид сетки: Таблица B02001 - Репортер переписи» . CensusReporter.org . Получено 3 июля 2024 года .
- ^ Jump up to: а беременный «Вид сетки: Таблица B02001 - Репортер переписи» . CensusReporter.org . Получено 3 июля 2024 года .
- ^ Jump up to: а беременный «Вид сетки: Таблица B02001 - Репортер переписи» . CensusReporter.org . Получено 3 июля 2024 года .
- ^ «Вид сетки: Таблица B02001 - Репортер переписи» . CensusReporter.org . Получено 3 июля 2024 года .
- ^ Jump up to: а беременный «Вид сетки: Таблица B02008 - Репортер переписи» . CensusReporter.org . Получено 3 июля 2024 года .
- ^ «Вид сетки: Таблица B02001 - Репортер переписи» . CensusReporter.org . Получено 3 июля 2024 года .
- ^ «Вид сетки: Таблица B02001 - Репортер переписи» . CensusReporter.org . Получено 3 июля 2024 года .
- ^ «Вид сетки: Таблица B03002 - Репортер переписи» . CensusReporter.org . Получено 3 июля 2024 года .
- ^ «Вид сетки: Таблица B03002 - Репортер переписи» . CensusReporter.org . Получено 3 июля 2024 года .
- ^ «Вид сетки: Таблица B02001 - Репортер переписи» . CensusReporter.org . Получено 3 июля 2024 года .
- ^ «Вид сетки: Таблица B02001 - Репортер переписи» . CensusReporter.org . Получено 3 июля 2024 года .
- ^ «Вид сетки: Таблица B03002 - Репортер переписи» . CensusReporter.org . Получено 3 июля 2024 года .
- ^ «Вид сетки: Таблица B03002 - Репортер переписи» . CensusReporter.org . Получено 3 июля 2024 года .
- ^ Jump up to: а беременный в «B03002. Латиноамериканское или латиноамериканское происхождение по расе - Вселенная: общая численность населения по региону» . 2008 Американское обследование сообщества 1 год . Бюро переписи Соединенных Штатов . Получено 2 марта 2010 года .
- ^ Jump up to: а беременный в «Американский демографический профиль Samoa 2010» . Американский фактфейнт . Архивировано из оригинала 3 мая 2017 года . Получено 29 ноября 2019 года .
- ^ Jump up to: а беременный в «Американский факт -финдер» . Бюро переписи Соединенных Штатов. Архивировано с оригинала 13 апреля 2016 года.
«Данные демографического профиля Гуам / Северная Мариана» . Американский фактфейнт . 2010. Архивировано с оригинала 6 ноября 2018 года . Получено 29 ноября 2019 года . - ^ Jump up to: а беременный «Пуэрто -Рико (ACS 2013–2017 населения)» . Американский фактфейнт . Архивировано из оригинала 14 февраля 2020 года . Получено 29 ноября 2019 года .
- ^ Jump up to: а беременный [1] Американский факт. 2010 Данные Демографические профиль США. Данные. Получено 29 ноября 2019 года.
- ^ «Население США по год, раса, возраст, этническая принадлежность и многое другое» . ДВЕЙСКИЙ ДВЕТ . 18 мая 2023 года . Получено 3 июня 2023 года .
- ^ «Раса и этническая принадлежность в Соединенных Штатах: перепись 2010 года и перепись 2020 года» . Бюро переписей США . Получено 2 декабря 2021 года .
- ^ Jump up to: а беременный «Общественные комментарии к Уведомлению о федеральном реестре NCT» (PDF) . Бюро переписей США; Министерство торговли . Получено 19 апреля 2016 года .
- ^ Alshammari, Yousef H (1 апреля 2020 г.). «Почему нет категории MENA по переписи США 2020 года?» Полем Аль Джазира . Получено 25 сентября 2020 года .
- ^ «Люди, сообщающие о какой -то другой гонке, процент, 2000» . Бюро переписи Соединенных Штатов . Архивировано из оригинала 13 февраля 2020 года . Получено 19 июля 2019 года .
- ^ Jump up to: а беременный «Расовые и этнические классификации, используемые в переписи 2000 года и за его пределами» . Бюро переписи Соединенных Штатов . Архивировано с оригинала 27 ноября 2001 года . Получено 2 ноября 2007 г.
- ^ «Бюро переписей США: часто задаваемые вопросы» . Ask.census.gov . Получено 16 мая 2013 года .
- ^ Американский факт, заархивированный 31 августа 2009 г., на машине Wayback
- ^ «Введение в данные о расе и этническом (латиноамериканском происхождении) для специального файла EEO Census 2000» . Архивировано из оригинала 13 августа 2009 года.
- ^ «Окончательные изменения в информационном отчете работодателя (EEO-1)» . Архивировано из оригинала 13 августа 2009 года.
- ^ Орвис, Карин (28 марта 2024 г.). «OMB публикует ревизии в Статистическую политику директивы № 15: Стандарты для поддержания, сбора и представления федеральных данных о расе и этнической принадлежности | OMB» . Белый дом . Получено 28 марта 2024 года .
- ^ «Управление по управлению и статистической политике США в США № 15: Стандарты для поддержания, сбора и представления федеральных данных о расе и этнической принадлежности» . Управление по управлению и бюджетному бюджету Межведомственная техническая рабочая группа по стандартам расы и этнической принадлежности . Получено 28 марта 2024 года .
- ^ «Анкета короткой формы» (PDF) . Бюро переписи Соединенных Штатов . Получено 5 мая 2008 года .
- ^ «ЦРУ - Всемирный факт -книг - Полевой листинг: этнические группы» . ЦРУ Архивировано из оригинала 13 июня 2007 года . Получено 2 апреля 2010 года .
- ^ «Руководство Бюро переписей США о презентации и сравнении данных о расе и латиноамериканском происхождении» . Бюро переписи Соединенных Штатов . Получено 6 апреля 2007 года .
Раса и латиноамериканское происхождение являются двумя отдельными понятиями в федеральной статистической системе. Люди, которые являются латиноамериканцами, могут быть любой расы. Люди в каждой гоночной группе могут быть либо латиноамериканскими, либо не латиноамериканскими. У каждого человека есть два атрибута, их раса (или расы) и независимо от того, являются ли они латиноамериканцами.
- ^ Мелвин Рэндольф Гилмор, «Истинный Логан Фонтенелл» , публикации Государственного исторического общества штата Небраска, вып. 19, под редакцией Альберта Уоткинса, Государственное историческое общество штата Небраска, 1919, с. 64, в Gennet, доступ к 25 августа 2011 г.
- ^ Jump up to: а беременный "Домашняя страница" . www.freeafricanamericans.com .
- ^ Джонс, Сюзанна В., Смешивание расы: Южная выдумка с шестидесятых , Jhu Press, 2006, p. 186, ISBN 9780801883934 [2]
- ^ «Американский Самоа: правительство и общество» . Encyclopædia Britannica (онлайн изд.) . Получено 1 июля 2020 года .
- ^ «О теме расы» . Получено 7 декабря 2022 года .
- ^ «Белое население: 2000» (PDF) . Бюро переписи Соединенных Штатов. Август 2001 . Получено 10 марта 2011 года .
- ^ «Вид сетки: Таблица B02001 - Репортер переписи» . CensusReporter.org . Получено 3 июля 2024 года .
- ^ Jump up to: а беременный «Американский демографический профиль Samoa 2010» . Американский фактфейнт . Архивировано из оригинала 3 мая 2017 года . Получено 25 июля 2020 года .
- ^ Jump up to: а беременный «Виргинские острова США» , World Factbook CIA , полученная 25 июля 2020 года.
- ^ Jump up to: а беременный в «Быстрые факты: Гавайи» . Бюро переписи Соединенных Штатов . Получено 10 февраля 2022 года .
«Быстрые факты: район Колумбии» . Бюро переписи Соединенных Штатов . Получено 10 февраля 2022 года .
«Быстрые факты: Пуэрто -Рико» . Бюро переписи Соединенных Штатов . Получено 10 февраля 2022 года . - ^ Jump up to: а беременный в «Быстрые факты: Калифорния» . Бюро переписи Соединенных Штатов . Получено 10 февраля 2022 года .
«Быстрые факты: Мэриленд» . Бюро переписи Соединенных Штатов . Получено 10 февраля 2022 года .
«Быстрые факты: Невада» . Бюро переписи Соединенных Штатов . Получено 10 февраля 2022 года .
«Быстрые факты: Нью -Мексико» . Бюро переписи Соединенных Штатов . Получено 10 февраля 2022 года .
«Быстрые факты: Техас» . Бюро переписи Соединенных Штатов . Получено 10 февраля 2022 года . - ^ «Американский факт -финдер» . Бюро переписи Соединенных Штатов. Архивировано с оригинала 13 апреля 2016 года.
«Американский факт -финдер» . Бюро переписи Соединенных Штатов. Архивировано из оригинала 12 февраля 2020 года. - ^ «Техас становится новейшим государством большинства в стране», объявляет Бюро переписей » . Бюро переписи Соединенных Штатов . Архивировано из оригинала 20 апреля 2008 года . Получено 5 мая 2008 года .
- ^ Jump up to: а беременный в «QuickFacts: Соединенные Штаты» . Бюро переписей США . Получено 25 июля 2020 года .
- ^ «Методология, предположения и входные данные для прогнозов национального населения 2023 года» (PDF) . Бюро переписей США . 3 июля 2024 года.
- ^ Бюро, перепись США. «Модифицированные данные гонки» . Перепись.gov . Получено 3 июля 2024 года .
{{cite web}}:|last=имеет общее имя ( справка ) - ^ Бюро, перепись США. «2023 Национальные проекции населения таблицы: основная серия» . Перепись.gov . Получено 3 июля 2024 года .
{{cite web}}:|last=имеет общее имя ( справка ) - ^ Разделение мечты: белые мужчины в мультикультурной Америке Доминика Дж. Пулеры.
- ^ Фарли, Рейнольдс (1 января 1991 г.). "Новый вопрос переписи о происхождении: что он нам сказал?" Полем Демография . 28 (3): 411–429. doi : 10.2307/2061465 . JSTOR 2061465 . PMID 1936376 . S2CID 41503995 .
- ^ Стэнли Либерсон и Лоуренс Санти, «Использование данных о рождении для оценки этнических характеристик и моделей», Social Science Research , Vol. 14, № 1 (1985), с. 44–46.
- ^ Стэнли Либерсон и Мэри С. Уотерс, «Этнические группы в потоке: изменяющиеся этнические реакции американских белых», Анналы Американской академии политических и социальных наук , вып. 487, № 79 (сентябрь 1986 г.), с. 82–86.
- ^ Jump up to: а беременный Мэри С. Уотерс, Этнические варианты: выбор личности в Америке (Беркли: Университет Калифорнийской Прессы, 1990), с. 36
- ^ «Латиноамериканское население: 2010» (PDF) . Перепись.gov . Министерство торговли США . Получено 13 августа 2021 года .
- ^ Tafoya, Sonya (2004). «Оттенки принадлежности» (PDF) . Пью латиноамериканский центр . Архивировано из оригинала (PDF) 28 мая 2008 года . Получено 22 января 2008 года .
- ^ Микати, Массара (6 июля 2019 г.). «Арабские американцы, другие ближневосточного происхождения говорят, что формы переписи заставляют их чувствовать себя невидимыми» . Хьюстон Хроника .
- ^ «3,5 миллиона сообщили о ближневосточном и североафриканском происхождении в 2020 году» . Перепись.gov . 21 сентября 2023 года . Получено 21 мая 2024 года .
- ^ Кайяли, Ранда (2006). Арабские американцы . Westport, CT: Greenwood Press. Стр. 45–64.
- ^ Jump up to: а беременный Фонд арабского американского института (2014). «Демография» (PDF) . Получено 6 февраля 2018 года .
- ^ Анжела Бриттингем; Г. Патриция де ла Крус (2005). «Мы, народ арабского происхождения в Соединенных Штатах» (PDF) . Бюро переписей США . Получено 6 февраля 2018 года .
- ^ Jump up to: а беременный «Быстрые факты об арабских американцах» (PDF) . Арабский американский институт . Получено 9 февраля 2018 года .
- ^ «Арабское американское сообщество в Калифорнии, самое большое» . Арабская Америка .
- ^ Набил, Авраам; Shryock, Andrew (2000). Арабский Детройт: от края до мейнстрима . Детройт, Мичиган: издательство Уэйнского государственного университета. ISBN 9780814328125 .
- ^ Hassoun, Rosina (2005). Арабы в Мичигане . Ист -Лансинг, Мичиган: издательство Мичиганского государственного университета. ISBN 9780870136672 .
- ^ «Лоббирование категории« Мена »по переписи США» Вильц, Терезея. USA сегодня. Опубликовано 7 октября 2014 года. Доступ 14 декабря 2015 года.
- ^ Коэн, Дебра Нуссбаум. «Новая категория переписи США, чтобы включить израильский вариант» . Хаарец . Получено 16 декабря 2015 года .
- ^ «Национальный тест на контент 2015 года» (PDF) . Бюро переписей США. С. 33–34 . Получено 13 декабря 2015 года .
Управление управления и бюджета проводит связанные с этим исследование в середине десятилетия для кодирования и классификации подробного национального происхождения и этнических групп, и рассматривает возможность добавления флажок ближневосточной или североафриканской флажки в совместном вопросе расы и этнической принадлежности. Наши консультации с внешними экспертами по азиатскому сообществу также предложили Сикху получить уникальный код, классифицированный при азиатской. Бюро переписей в настоящее время не содержит таблицу религиозных реакций на расу или этнические вопросы (например, сикх, еврейский, католический, мусульманский, лютеранский и т. Д.).
- ^ «Национальный тест на контент 2015 года» (PDF) . Бюро переписей США. п. 60 Получено 13 декабря 2015 года .
- ^ Мирски, Майя (4 мая 2023 г.). «Являются ли евреи белыми? Предложенные переписные переписи впадают в вопрос» . Еврейские новости о Северной Калифорнии - через Newspapers.com .
- ^ «Что обновления в стандартах расы/этнической принадлежности OMB означают для Бюро переписей» . Бюро переписи Соединенных Штатов . 8 апреля 2024 года.
- ^ Jump up to: а беременный «Раса, этническая принадлежность и языковые данные - стандартизация для улучшения качества здравоохранения» (PDF) . Институт медицины Национальных академий . Получено 10 мая 2016 года .
- ^ Jump up to: а беременный Соня Тастоги; Таллез Д. Джонсон; Элизабет М. Хоффель; Малкольм П. Дрюри -младший (сентябрь 2011 г.). «Черное население: 2010» (PDF) . Бюро переписи Соединенных Штатов . Министерство торговли США . Получено 11 сентября 2012 года .
- ^ Соединенные Штаты - Демографические и жилищные оценки ACS: Архивировано 11 февраля 2020 года на Archive.today . Factfinder.census.gov. Получено 9 декабря 2010 года.
- ^ Грико, Элизабет М.; Acosta, Esenia D.; де ла Круз, Г. Патриция; Гамино, Кристина; Грин, Томас; Ларсен, Люк Дж.; Trevelyan, Edward N.; Уолтерс, Натан П. (май 2012 г.). «Население, родившегося иностранных дел, в Соединенных Штатах: 2010» (PDF) . Отчеты обследования американского сообщества . Бюро переписи Соединенных Штатов. Архивировано из оригинала (PDF) 9 февраля 2015 года . Получено 27 января 2015 года .
- ^ Jump up to: а беременный «Перепись 2010 года показывает, что черная популяция имеет самую высокую концентрацию на юге» . Бюро переписи Соединенных Штатов . Министерство торговли США. 29 сентября 2011 года. Архивировано с оригинала 15 сентября 2012 года . Получено 11 сентября 2012 года .
- ^ Бюро, перепись США. «Американский факт - результаты» . factfinder2.census.gov .
{{cite web}}:|last=имеет общее имя ( справка ) [ Постоянная мертвая ссылка ] - ^ «Размер и региональное распределение чернокожих населения» . Льюис Мамфорд Центр. Архивировано с оригинала 12 октября 2007 года . Получено 1 октября 2007 года .
- ^ «Исследование Нового Света и английские амбиции» . Ужасная трансформация . Пбс. Архивировано из оригинала 14 июня 2007 года . Получено 11 сентября 2011 года .
- ^ Гомес, Майкл А. (1998). Обмен следями нашей страной: трансформация африканской идентичности в колониальном и антебеллуме на юге . Университет Северной Каролины Пресс. п. 384. ISBN 9780807846940 .
- ^ Вуд, Гордон С. (2002). Американская революция: история . Современная библиотека. п. 55 ISBN 9780679640578 .
- ^ Свобода! Американская революция (документальный фильм) Эпизод II: удары должны решить: 1774–1776 . © 1997 Twin Cities Public Television, Inc. ISBN 1-4157-0217-9
- ^ Фонер, Филипп Шелдон (1976). Чернокожие в американской революции . Том 55 вкладов в американскую историю. Greenwood Press. п. 70. ISBN 9780837189468 .
- ^ "Черные лоялисты" . Черное присутствие . Национальный архив . Получено 11 сентября 2012 года .
- ^ Николас Бостон; Дженнифер Халлам (2004). «Свобода и эмансипация» . Образовательная вещательная корпорация . Общественная служба вещания . Получено 11 сентября 2012 года .
- ^ «13 -я поправка к Конституции США» . OreDocuments.gov . Национальное управление архивами и записями . Получено 11 сентября 2012 года .
- ^ «Пятнадцатая поправка в плоти и крови» . Офис клерка . Палата представителей Соединенных Штатов. Архивировано из оригинала 11 декабря 2012 года . Получено 11 сентября 2012 года .
- ^ Уолтер, Хазен (2004). Американская черная история . Лоренц Образовательная пресса. п. 37. ISBN 9780787706036 Полем Получено 11 сентября 2012 года .
- ^ "Приз" . Мы преодолеем . Служба национальных парков . Получено 11 сентября 2012 года .
- ^ Kusow, Am. «Африканские иммигранты в Соединенных Штатах: последствия для позитивных действий» . Университет штата Айова . Получено 10 мая 2016 года .
- ^ «Льюис Мамфорд Центр Перепись 2000 Столичная серия расовых и этнических изменений» . 12 октября 2007 года. Архивировано с оригинала 12 октября 2007 года.
- ^ Гринвуд, Шеннон (20 января 2022 года). «1. Карибский бассейн является крупнейшим источником происхождения чернокожих иммигрантов, но самый быстрый рост входит в число африканских иммигрантов» .
- ^ «Обзор 2020 г. Айан перераспределяет данные: 2020» (PDF) . Получено 16 января 2022 года .
- ^ Брайк, Катаржина; Дюран, Эрик Й.; Макферсон, Дж. Майкл; Рейх, Дэвид; Гора, Джоанна Л. (январь 2015 г.). «Генетическое происхождение афроамериканцев, латиноамериканцев и европейских американцев по всей территории Соединенных Штатов» . Американский журнал человеческой генетики . 96 (1): 37–53. doi : 10.1016/j.ajhg.2014.11.010 . ISSN 0002-9297 . PMC 4289685 . PMID 25529636 .
- ^ Карл Циммер (24 декабря 2014 г.). «Белый? Черный? Мрачное различие становится все еще мрачнее» . New York Times . Получено 21 октября 2018 года .
Исследователи обнаружили, что у европейских американцев были геномы, которые в среднем были в среднем 98,6 процента европейских, 0,19 процента африканских и 0,18 процентов коренных американцев.
- ^ «Исследовательские гиды и классовые страницы: коренные американцы и коренные исследования: чероки» .
- ^ Бюро, перепись США. «Бюро переписей выпускает данные переписи 2020 года для почти 1500 подробных групп расы и этнической принадлежности, племен и деревень» . Перепись.gov . Получено 1 апреля 2024 года .
{{cite web}}:|last=имеет общее имя ( справка ) - ^ «Анализ | население коренных американцев взорвалось, показывает перепись. Вот почему» . Вашингтон пост . 27 октября 2023 года . Получено 1 апреля 2024 года .
- ^ «Вид сетки: Таблица B03002 - Репортер переписи» . CensusReporter.org . Получено 15 июля 2024 года .
- ^ «B02001. Раса - Вселенная: Общая численность населения и штаты» . 2008 Американское обследование сообщества 1 год . Бюро переписи Соединенных Штатов . Получено 25 апреля 2010 года .
- ^ «Азиатские американцы» . Проект социальных и демографических тенденций Pew Research Center . 18 июня 2012 г. Получено 7 июня 2016 года .
- ^ «10 фактов о гайанских иммигрантах в США, которые вы должны знать» . 9 мая 2016 года.
- ^ «B02012. Родные гавайские и другие тихоокеанские островеры в одиночку или в сочетании с одной или несколькими другими рас» . 2008 Американское обследование сообщества 1 год . Бюро переписи Соединенных Штатов . Получено 11 мая 2010 года .
- ^ Jump up to: а беременный «B02001. Раса - Вселенная: общая численность населения» . 2008 Американское обследование сообщества 1 год . Бюро переписи Соединенных Штатов . Получено 28 февраля 2010 года .
- ^ Джонс, Николас А.; Эми Сименс Смит. «Две или более расы Население: 2000. Краткое описание переписи 2000» (PDF) . Бюро переписи Соединенных Штатов . Получено 8 мая 2008 года .
- ^ "Аллен Тернер" . Архивировано из оригинала 2 октября 2008 года . Получено 9 ноября 2008 года .
- ^ Jump up to: а беременный Марк Д. Шрайвер ; и др. (2003). «Пигментация кожи, биогеографическое происхождение и картирование примесей» (PDF) . Человеческая генетика . 112 (4): 387–399. doi : 10.1007/s00439-002-0896-y . PMID 12579416 . S2CID 7877572 . Получено 24 августа 2017 года .
- ^ «Роберт Стакерт», африканское происхождение белого американского населения » ( PDF) . Получено 16 мая 2013 года .
- ^ Коллинз-Шрамм, Хизер Э. (2002). «Маркеры, которые различают европейское и африканское происхождение, показывают ограниченные различия в Африке». Человеческая генетика . 111 (6): 566–569. doi : 10.1007/s00439-002-0818-z . PMID 12436248 . S2CID 30319228 .
- ^ Парра, Эстебан Дж.; Марцини, Эми; Кей, Джошуа; Мартинсон, Джереми; Бацер, Марк А.; Купер, Ричард; Форрестер, Терренс; Эллисон, Дэвид Б.; Дека, Ранджан; Феррелл, Роберт Э.; Шрайвер, Марк Д. (1998). «Оценка пропорций афроамериканской примеси по использованию аллелей, специфичных для населения» (PDF) . Американский журнал человеческой генетики . 63 (6): 1839–1851. doi : 10.1086/302148 . PMC 1377655 . PMID 9837836 . Архивировано из оригинала (PDF) 4 марта 2009 года . Получено 16 мая 2013 года .
- ^ Работа, этническая принадлежность и генетика Рабочая группа (2005). «Использование расовых, этнических и наследственных категорий в исследованиях генетики человека» . Американский журнал человеческой генетики . 77 (4): 519–532. doi : 10.1086/491747 . PMC 1275602 . PMID 16175499 .
- ^ «Мировой факт - Соединенные Штаты» . ЦРУ Получено 8 мая 2008 года .
- ^ Бюро, перепись США. «Раса и этническая принадлежность в Соединенных Штатах: перепись 2010 года и перепись 2020 года» . Перепись.gov . Получено 4 июля 2024 года .
{{cite web}}:|last=имеет общее имя ( справка ) - ^ «B03002 Латиноамериканское или латиноамериканское происхождение по расу-Соединенные Штаты-2018 год, обследование американского сообщества 1 год» . Бюро переписи Соединенных Штатов. 1 июля 2018 года . Получено 25 ноября 2019 года .
- ^ Jump up to: а беременный «Соединенные Штаты - отобранный профиль населения в Соединенных Штатах (латиноамериканцы или латиноамериканцы (любой расы))» . 2008 Американское обследование сообщества 1 год . Бюро переписи Соединенных Штатов. Архивировано из оригинала 2 сентября 2010 года . Получено 8 апреля 2010 года .
- ^ «Американский факт -сердечник; латиноамериканское или латиноамериканское происхождение» . Бюро переписи Соединенных Штатов. Архивировано из оригинала 24 мая 2017 года . Получено 13 сентября 2017 года .
- ^ «B03001 Латиноамериканское или латиноамериканское происхождение по конкретному происхождению - Соединенные Штаты - 2019 год обследования американского сообщества 1 год» . Бюро переписи Соединенных Штатов. 1 июля 2019 года . Получено 4 февраля 2021 года .
- ^ Ноа-Бустаман, Луис; Флорес, Антонио; Шах, Соно. 2017 Пью -исследовательский центр 2022 2022.
- ^ Флорес, Антонио (18 сентября 2017 г.). «Как меняется латиноамериканское население США» . Пью -исследовательский центр .
- ^ «Прогнозируемое население Соединенных Штатов, расовым и латиноамериканским происхождением: с 2000 по 2050 год» (PDF) . Бюро переписи Соединенных Штатов . 2004. Архивировано из оригинала (PDF) 6 марта 2008 года . Получено 5 мая 2008 года .
- ^ «Пресс -релизы в переписи США» . Бюро переписи Соединенных Штатов. 18 марта 2004 года. Архивировано с оригинала 13 марта 2008 года . Получено 5 мая 2008 года .
- ^ «Вид сетки: Таблица B04007 - Репортер переписи» . CensusReporter.org . Получено 3 июля 2024 года .
- ^ «Вид сетки: Таблица B04006 - Репортер переписи» . CensusReporter.org . Получено 3 июля 2024 года .
- ^ «Вид сетки: Таблица B03001 - Репортер переписи» . CensusReporter.org . Получено 3 июля 2024 года .
- ^ «Просмотр сетки: Таблица B02018 - Репортер переписи» . CensusReporter.org . Получено 3 июля 2024 года .
- ^ «Вид сетки: Таблица B02017 - Репортер переписи» . CensusReporter.org . Получено 3 июля 2024 года .
- ^ «Просмотр сетки: Таблица B02019 - Репортер переписи» . CensusReporter.org . Получено 3 июля 2024 года .
- ^ «Вид сетки: Таблица B04004 - Репортер переписи» . CensusReporter.org . Получено 3 июля 2024 года .
- ^ Пулера, Доминик (20 октября 2004 г.). Делитесь мечтой: белые мужчины в мультикультурной Америке . A & C Black. ISBN 9780826416438 Полем Получено 21 августа 2017 года - через Google Books.
- ^ Рейнольдс Фарли, «Новый вопрос переписи о происхождении: что он сказал нам?», Демография , вып. 28, № 3 (август 1991 г.), с. 414, 421.
- ^ Стэнли Либерсон и Лоуренс Санти, «Использование данных о рождении для оценки этнических характеристик и моделей», Social Science Research , Vol. 14, № 1 (1985), с. 44-46.
- ^ Стэнли Либерсон и Мэри С. Уотерс, «Этнические группы в потоке: изменяющиеся этнические реакции американских белых», Анналы Американской академии политических и социальных наук , вып. 487, № 79 (сентябрь 1986 г.), с. 82-86.
Внешние ссылки
[ редактировать ]- American FactFinder; Поиск ключевых слов "Ancestry", все программы ; Бюро переписей США
- Для дополнительных карт США на уровне округа на широком спектре этнических и национальных групп посетите карту галереи этнических групп в США , архивные 10 марта 2013 года, на Wayback Machine , часть материалов курса для американской этнической географии в Вальпараисо Университет
- Американская терминология для различных расовых групп социолога Памелы Э. Оливер