Агломерация Нью-Йорка
Агломерация Нью-Йорка | |
|---|---|
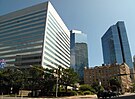
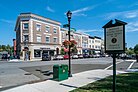
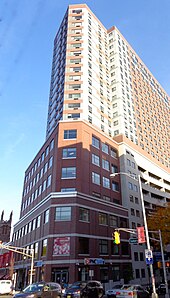
From top, left to right: The Financial District of Lower Manhattan, the world's principal financial center;[1][2][3][4][5] Montauk Point Light, on the East End of Long Island at sunrise; Downtown White Plains, in the Hudson Valley region; the Paramount Theatre, at Asbury Park Convention Hall at nightfall on the Jersey Shore; Greenwich, on Connecticut's Gold Coast, home to many wealthy financiers and hedge funds; and Midtown Manhattan overlooking Hudson County, New Jersey toward the west, across the Hudson River | |
![Map of the divisions of the New York metropolitan area as defined by the U.S. Census Bureau[6]](http://upload.wikimedia.org/wikipedia/commons/thumb/3/38/New_York_Metropolitan_Area_Counties.svg/250px-New_York_Metropolitan_Area_Counties.svg.png) Map of the divisions of the New York metropolitan area as defined by the U.S. Census Bureau[6] | |
| Country | |
| States | |
| Core city | |
| Satellite cities | List of satellite cities |
| Area | |
| • Urban | 3,248.1 sq mi (8,413 km2) |
| • Metro | 8,294.2 sq mi (21,482 km2) |
| Population | |
| • Urban [7] (2020) | 19,426,449 |
| • Urban density | 5,980.8/sq mi (2,309.2/km2) |
| • Metro density | 2,350.8/sq mi (907.6/km2) |
| • Metropolitan Statistical Area (MSA) (2023) | 19,498,249 (1st) |
| • Combined Statistical Area (CSA) (2023) | 21,859,598 (1st) |
| Demonym | Metro New Yorker |
| GDP | |
| • MSA | $2.163 trillion (2022) |
| • CSA | $2.504 trillion (2022) |
| Time zone | UTC−05:00 (EST) |
| • Summer (DST) | UTC−04:00 (EDT) |
| Area codes | 201, 203, 212, 332, 272, 347, 475, 484, 516, 551, 570, 609, 610, 631, 640, 646, 718, 732, 845, 848, 860, 862, 908, 914, 917, 929, 973 |
| Highest elevation 4,180 ft/1,274 m (Slide Mountain (Ulster County, New York), in the Catskill Mountains). Lowest elevation 0 ft/0 m (sea level) at the Atlantic Ocean, Long Island Sound, and at Hudson River estuary waterways. | |


, Агломерация Нью-Йорка широко называемая территорией трех штатов и часто также называемая Большим Нью-Йорком , является крупнейшей агломерацией в мире по площади городских территорий . [ 11 ] [ 12 ] [ 13 ] охватывающая 4669,0 квадратных миль (12 093 км 2 ). 2 ). [ 14 ] Агломерация Нью-Йорка — одна из самых густонаселенных агломераций в мире, крупнейшая агломерация в США и единственная агломерация США с населением более 20 миллионов человек по данным переписи населения США 2020 года .
Обширная агломерация включает Нью-Йорк , самый густонаселенный город страны, Лонг-Айленд , среднюю и нижнюю долину Гудзона в штате Нью-Йорк , 14 округов и одиннадцать крупнейших городов штата Нью-Джерси , а также шесть из семи крупнейших городов. в Коннектикуте . Фраза « зона трех штатов» обычно используется для обозначения Нью-Йорка , Нью-Джерси и Коннектикута , хотя все большее число людей, работающих в Нью-Йорке, ездят на работу из Пенсильвании , особенно из регионов Лихай-Вэлли , округа Бакс и Поконос в восточная Пенсильвания, в результате чего агломерация охватывает четыре штата. Агломерация Нью-Йорка является географическим и демографическим центром более крупного северо-восточного мегаполиса .
The New York metropolitan area is the most populous metropolitan statistical area in the United States with 20.1 million residents, or slightly over 6% of the nation's total population, as of 2020.[8] The combined statistical area includes 23.6 million residents as of 2020.[15][16] It is one of the largest urban agglomerations in the world.[17][18][19] The New York metropolitan area continues to be the premier gateway for legal immigration to the United States,[20][21][22][23] having the largest foreign-born population of any metropolitan region in the world. The metropolitan statistical area covers 6,720 sq mi (17,405 km2) while the combined statistical area is 13,318 sq mi (34,493 km2), encompassing an ethnically and geographically diverse region. The New York metropolitan area's population is larger than that of the state of New York, and the metropolitan airspace accommodated over 130 million passengers in 2016.[24]
As of 2022[update], the New York metropolitan area is the largest metropolitan economy in the world, with a gross metropolitan product of over US$2.5 trillion.[10] Greater New York is the hub of multiple industries, including finance, health care, pharmaceuticals, and scientific output in life sciences,[25][26] international trade, publishing, real estate, education, fashion, entertainment, tourism, law, and manufacturing; and if the New York metropolitan area were an independent sovereign state, it would constitute the eighth-largest economy in the world. New York City is also considered the cultural capital of the world.[27][28][29][30] It is the most prominent financial,[31][32][33] diplomatic, and media hub[34][35] in the world.[36][37]
According to Forbes, in 2014, the New York metropolitan area was home to eight of the top ten ZIP Codes in the United States by median housing price, with six in Manhattan alone.[38] The New York metropolitan area is known for its varied landscape and natural beauty, and contains five of the top ten richest places in America, according to Bloomberg. These are Scarsdale, New York; Short Hills, New Jersey; Old Greenwich, Connecticut; Bronxville, New York; and Darien, Connecticut.[39] The New York metropolitan region's higher education network comprises hundreds of colleges and universities, including campuses of four Ivy League universities: Columbia, Princeton, Yale, and Cornell (at Cornell Tech and Weill Cornell Medicine); the flagship campuses of the largest public universities systems at SUNY Stony Brook and Rutgers; and globally-ranked New York University, Rockefeller University, and Cold Spring Harbor Laboratory.
Definitions
[edit]Metropolitan statistical area
[edit]The counties and county groupings constituting the New York metropolitan area are listed below, with 2010 census figures:


The U.S. Office of Management and Budget utilizes two definitions of the urbanized area: the metropolitan statistical area (MSA) and the combined statistical area (CSA). The MSA definition is titled the New York-Newark-Jersey City, NY-NJ-PA Metropolitan Statistical Area, and includes a population of 20.3 million people by 2017 Census estimates, roughly 1 in 16 Americans and nearly 7 million more than the second-place Los Angeles metropolitan area in the United States. The MSA is further subdivided into four metropolitan divisions. The 23-county MSA includes 10 counties in New York State (coextensive with the five boroughs of New York, the two remaining counties of Long Island, and three counties in the Lower Hudson Valley); 12 counties in Northern and Central New Jersey; and one county in northeastern Pennsylvania. The largest urbanized area in the United States is at the heart of the metropolitan area, the New York–Newark, NY–NJ–CT Urbanized Area, which had a land area of 3,450 square miles in 2010 according to the 2010 census. The New York State portion of the metropolitan area, which includes the five boroughs of New York City, the lower Hudson Valley, and Long Island, accounts for over 65 percent of the state's population.
New York–Newark–Jersey City-Yonkers, NY–NJ–PA Metropolitan Statistical Area (19,043,386)
- New York–Jersey City–White Plains, NY–NJ Metropolitan Division (11,732,233)
- Kings County, NY (the borough of Brooklyn in NYC)
- Queens County, NY (the borough of Queens in NYC)
- New York County, NY (the borough of Manhattan in NYC)
- Bronx County, NY (the borough of The Bronx in NYC)
- Richmond County, NY (the borough of Staten Island in NYC)
- Westchester County, NY
- Bergen County, NJ
- Hudson County, NJ
- Passaic County, NJ
- Rockland County, NY
- Putnam County, NY
- Nassau County–Suffolk County, NY Metropolitan Division (2,832,882)
- New Brunswick–Lakewood, NJ Metropolitan Division (2,383,854)
- Newark, NJ–PA Metropolitan Division (2,174,944)
Combined statistical area
[edit]Combined statistical areas (CSAs) group together adjacent core-based statistical areas with a high degree of economic interconnection.[40] The New York–Newark, NY–NJ–CT–PA Combined Statistical Area had an estimated population of 23.7 million as of 2014.[16] About one out of every fifteen Americans resides in this region, which includes eight additional counties in New York, New Jersey, Connecticut, and Pennsylvania. This area, less the Pennsylvania portion, is often referred to as the tri-state area and less commonly the tri-state region. The New York City television designated market area (DMA) includes Pike County, Pennsylvania,[41] which is also included in the CSA.
In addition to the New York–Newark–Jersey City, NY–NJ–PA metropolitan statistical areas (MSA), the following core-based statistical areas are also included in the New York–Newark, NY–NJ–CT–PA CSA:
- Bridgeport–Stamford–Norwalk–Danbury, CT MSA (916,829)
- New Haven–Milford, CT MSA (862,477)
- Trenton–Princeton, NJ MSA (396,811)
- Torrington, CT micropolitan statistical area (189,927)
- Kingston, NY MSA (182,693)
- Kiryas Joel-Poughkeepsie-Newburgh, NY MSA (670,301)
Geography
[edit]
The area is frequently divided into the following subregions:[43][44]
- New York City (the primary urban center of the metropolitan region, comprising five boroughs, one of which is Manhattan, the geographical, cultural, and economic core of the entire metropolitan area)
- Central and eastern Long Island (Nassau and Suffolk Counties – separated by water from the rest of the region except New York City; not including Queens County or Kings County (Brooklyn), which are concurrent with two of New York's five boroughs)
- North Jersey (northern portion of New Jersey)
- Central Jersey (middle portion of New Jersey)
- Hudson Valley (Lower Hudson Valley suburbs of Westchester, Putnam, and Rockland Counties; and Mid-Hudson exurbs of Dutchess, Sullivan, Orange, and Ulster Counties)
- Western Connecticut (Only Fairfield, New Haven, and Litchfield Counties are part of the region and separated by the state line)
- Southern and Eastern Poconos (Monroe and Pike Counties in Pennsylvania)
All eight subregions are often further subdivided. For instance, Long Island can be divided into its South and North Shores (usually when speaking about Nassau County and western Suffolk County) and the East End. The Hudson Valley and Connecticut are sometimes grouped together and referred to as the Northern Suburbs, largely because of the shared usage of the Metro-North Railroad system.[45]
Climate
[edit]Under the Köppen climate classification, New York City, western (and parts of eastern) Long Island, and the Jersey Shore experience a humid subtropical climate (Cfa),[46][47] and New York is thus the northernmost major city on the North American continent with this climate type.
Much of the remainder of the metropolitan area lies in the transition zone from a humid subtropical (Cfa) to a humid continental climate (Dfa),[46][47] and it is only the inland, more exurban areas far to the north and west such as Sussex County, New Jersey, that have a January daily average of −3 °C (26.6 °F) or below and are fully humid continental; the Dfb (warm summer subtype) regime is only found inland at a higher elevation,[46] and receives greater snowfall[48] than the Dfa region. Much of Monroe and most of Pike County in Pennsylvania also have a fully humid continental climate.
Summers in the area are typically hot and humid. Nighttime conditions in and around the five boroughs of New York are often exacerbated by the urban heat island phenomenon, and temperatures exceed 90 °F (32 °C) on average of 7–8 days (on the immediate Long Island Sound and Atlantic coasts), up to in excess of 27 days (inland suburbs in New Jersey) each summer and may exceed 100 °F (38 °C).[citation needed] Normally, warm to hot temperatures begin in mid-May, and last through early October. Summers also feature passing thundershowers which build in the heat of the day and then drop brief, but intense, rainfall.
Winters are cold with a mix of rain and snow. Although prevailing winds in winter are offshore, and temper the moderating effects of the Atlantic Ocean, the Atlantic and the partial shielding by the Appalachians from colder air keep the New York area warmer in the winter than inland North American metropolitan areas located at similar or lesser latitudes including Pittsburgh, Cincinnati, and Indianapolis. Warm periods with 50 °F (10 °C)+ temperatures may occasionally occur during winter as well.[49] The hardiness zone in the New York metropolitan area varies over a wide range from 5a in the highest areas of Dutchess, Monroe, and Ulster Counties to 7b in most of NYC as well as Hudson County from Bayonne up the east side of the Palisades to Route 495, the majority of Nassau County, the north coast of Monmouth County, and Copiague Harbor, Lindenhurst, and Montauk in Suffolk County.[50]
Almost all of the metropolitan area receives at least 42 inches (1,070 mm) of precipitation annually, which is relatively evenly spread throughout the year, and many areas receive upwards of 50 in (1,270 mm). Average winter snowfall for 1981 to 2010 ranges from just under 25 inches (64 cm) along the coast of Long Island to more than 50 in (127 cm) in some inland areas, but this usually varies considerably from year to year.[51] Hurricanes and tropical storms have impacted the Tri-State area in the past, though a direct hit is rare. Several areas on Long Island, New Jersey, and the Connecticut coast have been impacted by serious storm surges in the past. Inland areas have been impacted by heavy rain and flooding from tropical cyclones.[52]
The New York metropolitan area averages 234 days with at least some sunshine and 59% of possible sunlight annually,[53] accumulating 2,400 to 2,800 hours of sunshine per annum.[54]
| Month | Jan | Feb | Mar | Apr | May | Jun | Jul | Aug | Sep | Oct | Nov | Dec | Year |
|---|---|---|---|---|---|---|---|---|---|---|---|---|---|
| Record high °F (°C) | 72 (22) |
78 (26) |
86 (30) |
96 (36) |
99 (37) |
101 (38) |
106 (41) |
104 (40) |
102 (39) |
94 (34) |
84 (29) |
75 (24) |
106 (41) |
| Mean maximum °F (°C) | 60.4 (15.8) |
60.7 (15.9) |
70.3 (21.3) |
82.9 (28.3) |
88.5 (31.4) |
92.1 (33.4) |
95.7 (35.4) |
93.4 (34.1) |
89.0 (31.7) |
79.7 (26.5) |
70.7 (21.5) |
62.9 (17.2) |
97.0 (36.1) |
| Mean daily maximum °F (°C) | 39.5 (4.2) |
42.2 (5.7) |
49.9 (9.9) |
61.8 (16.6) |
71.4 (21.9) |
79.7 (26.5) |
84.9 (29.4) |
83.3 (28.5) |
76.2 (24.6) |
64.5 (18.1) |
54.0 (12.2) |
44.3 (6.8) |
62.6 (17.0) |
| Daily mean °F (°C) | 33.7 (0.9) |
35.9 (2.2) |
42.8 (6.0) |
53.7 (12.1) |
63.2 (17.3) |
72.0 (22.2) |
77.5 (25.3) |
76.1 (24.5) |
69.2 (20.7) |
57.9 (14.4) |
48.0 (8.9) |
39.1 (3.9) |
55.8 (13.2) |
| Mean daily minimum °F (°C) | 27.9 (−2.3) |
29.5 (−1.4) |
35.8 (2.1) |
45.5 (7.5) |
55.0 (12.8) |
64.4 (18.0) |
70.1 (21.2) |
68.9 (20.5) |
62.3 (16.8) |
51.4 (10.8) |
42.0 (5.6) |
33.8 (1.0) |
48.9 (9.4) |
| Mean minimum °F (°C) | 9.8 (−12.3) |
12.7 (−10.7) |
19.7 (−6.8) |
32.8 (0.4) |
43.9 (6.6) |
52.7 (11.5) |
61.8 (16.6) |
60.3 (15.7) |
50.2 (10.1) |
38.4 (3.6) |
27.7 (−2.4) |
18.0 (−7.8) |
7.7 (−13.5) |
| Record low °F (°C) | −6 (−21) |
−15 (−26) |
3 (−16) |
12 (−11) |
32 (0) |
44 (7) |
52 (11) |
50 (10) |
39 (4) |
28 (−2) |
5 (−15) |
−13 (−25) |
−15 (−26) |
| Average precipitation inches (mm) | 3.64 (92) |
3.19 (81) |
4.29 (109) |
4.09 (104) |
3.96 (101) |
4.54 (115) |
4.60 (117) |
4.56 (116) |
4.31 (109) |
4.38 (111) |
3.58 (91) |
4.38 (111) |
49.52 (1,258) |
| Average snowfall inches (cm) | 8.8 (22) |
10.1 (26) |
5.0 (13) |
0.4 (1.0) |
0.0 (0.0) |
0.0 (0.0) |
0.0 (0.0) |
0.0 (0.0) |
0.0 (0.0) |
0.1 (0.25) |
0.5 (1.3) |
4.9 (12) |
29.8 (76) |
| Average extreme snow depth inches (cm) | 5.8 (15) |
7.9 (20) |
4.4 (11) |
0.4 (1.0) |
0.0 (0.0) |
0.0 (0.0) |
0.0 (0.0) |
0.0 (0.0) |
0.0 (0.0) |
0.0 (0.0) |
0.4 (1.0) |
3.7 (9.4) |
12.3 (31) |
| Average precipitation days (≥ 0.01 in) | 10.8 | 10.0 | 11.1 | 11.4 | 11.5 | 11.2 | 10.5 | 10.0 | 8.8 | 9.5 | 9.2 | 11.4 | 125.4 |
| Average snowy days (≥ 0.1 in) | 3.7 | 3.2 | 2.0 | 0.2 | 0.0 | 0.0 | 0.0 | 0.0 | 0.0 | 0.0 | 0.2 | 2.1 | 11.4 |
| Average relative humidity (%) | 61.5 | 60.2 | 58.5 | 55.3 | 62.7 | 65.2 | 64.2 | 66.0 | 67.8 | 65.6 | 64.6 | 64.1 | 63.0 |
| Average dew point °F (°C) | 18.0 (−7.8) |
19.0 (−7.2) |
25.9 (−3.4) |
34.0 (1.1) |
47.3 (8.5) |
57.4 (14.1) |
61.9 (16.6) |
62.1 (16.7) |
55.6 (13.1) |
44.1 (6.7) |
34.0 (1.1) |
24.6 (−4.1) |
40.3 (4.6) |
| Mean monthly sunshine hours | 162.7 | 163.1 | 212.5 | 225.6 | 256.6 | 257.3 | 268.2 | 268.2 | 219.3 | 211.2 | 151.0 | 139.0 | 2,534.7 |
| Percent possible sunshine | 54 | 55 | 57 | 57 | 57 | 57 | 59 | 63 | 59 | 61 | 51 | 48 | 57 |
| Average ultraviolet index | 2 | 3 | 4 | 6 | 7 | 8 | 8 | 8 | 6 | 4 | 2 | 1 | 5 |
| Source 1: NOAA (relative humidity and sun 1961–1990; dew point 1965–1984)[56][57][58] | |||||||||||||
| Source 2: Weather Atlas[59]. | |||||||||||||
| Month | Jan | Feb | Mar | Apr | May | Jun | Jul | Aug | Sep | Oct | Nov | Dec | Year |
|---|---|---|---|---|---|---|---|---|---|---|---|---|---|
| Average sea temperature °F (°C) |
41.7 (5.4) |
39.7 (4.3) |
40.2 (4.5) |
45.1 (7.3) |
52.5 (11.4) |
64.5 (18.1) |
72.1 (22.3) |
74.1 (23.4) |
70.1 (21.2) |
63.0 (17.2) |
54.3 (12.4) |
47.2 (8.4) |
55.4 (13.0) |
| Climate data for Newark, New Jersey (Newark Liberty Int'l) |
|---|
| Climate data for White Plains, New York (Westchester Co. Airport) |
|---|
| Climate data for West Point, New York |
|---|
| Climate data for Bridgehampton, New York |
|---|
| Climate data for Bridgeport, Connecticut (Sikorsky Airport) |
|---|
| Climate data for Danbury, Connecticut |
|---|
| Climate data for Stroudsburg, Pennsylvania |
|---|
| Climate data for Morristown, New Jersey |
|---|
Subregions
[edit]New York City
[edit]
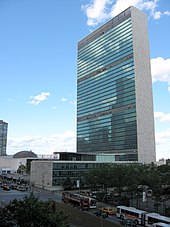
The geographical, cultural, and economic center of the metropolitan area is New York City, the most populous city in the United States and has been described as the capital of the world.[64] The city consists of five boroughs, each of which is coterminous with a county of New York State. The five boroughs – Brooklyn, Queens, Manhattan, the Bronx, and Staten Island – were consolidated into a single city in 1898.[65] With a Census-estimated population of 8,335,897 in 2022 (8,467,513 in 2021[66][67]), distributed over a land area of just 305 square miles (790 km2),[68] New York is the most densely populated major city in the United States.[69] A global power city,[70] New York City exerts a significant impact upon commerce, finance, health care and life sciences,[26] media, dining, art, fashion, research, technology, education, and entertainment, its fast pace[71][72] defining the term New York minute.[73] Home to the headquarters of the United Nations,[74] New York is an important center for international diplomacy.[75] New York is a global city[76] and has been described as the cultural,[77][78] financial,[31][32] entertainment,[64] and media capital[34][35] of the world, as well as the world's most economically powerful city.[37][32][79][33]
Long Island
[edit]

Long Island, the most populous island in the United States, is located just off the northeast coast of the United States and is a region wholly included within both the U.S. state of New York and the New York metropolitan area. Extending 118 miles east-northeast of Roosevelt Island, Manhattan from New York Harbor into the Atlantic Ocean, the island comprises four counties: Kings and Queens (these form the New York boroughs of Brooklyn and Queens, respectively) to the west; then Nassau and Suffolk to the east. However, most people in the New York metropolitan area (even those living in Queens and Brooklyn) colloquially use the term "Long Island" (or "The Island") exclusively to refer to the Nassau-Suffolk county area collectively, which is mainly suburban in character.[80] North of the island is Long Island Sound, across which are the U.S. states of Connecticut and Rhode Island.
With a population of 8,063,232 enumerated at the 2020 U.S. Census, constituting nearly 40% of New York State's population,[81][82][83][84][85] the majority of New York City residents, 58.4% as of 2020, live on Long Island, namely the estimated 4,896,398 residents living in the New York City boroughs of Brooklyn and Queens.[86] Long Island is the most populated island in any U.S. state or territory, and the 17th-most populous island in the world (ahead of Ireland, Jamaica, and Hokkaidō). Its population density is 5,571 inhabitants per square mile (2,151/km2). If Long Island geographically constituted an independent metropolitan statistical area, it would rank fourth most populous in the United States; while if it were a U.S. state, Long Island would rank 13th in population and first in population density. Queens is the most ethnically diverse urban area in the world.[87][88] The Town of Hempstead in Nassau County, with an estimated population of 770,367 in 2016, is the most populous municipality in the New York metropolitan area outside of New York City.[89]
Long Island is also the 17th most populous island in the world, but is more prominently known for recreation, boating, and miles of public beaches, including numerous town, county, and state parks, as well as Fire Island National Seashore and wealthy and expensive coastal residential enclaves. Along the north shore, the Gold Coast of Long Island, featured in the film The Great Gatsby, is an upscale section of Nassau and western Suffolk counties that once featured many lavish mansions built and inhabited by wealthy business tycoons in the earlier years of the 20th century, of which only a few remain preserved as historic sites. The East End of Long Island (known as the "Twin Forks" because of its physical shape) boasts open spaces for farmland and wineries. The South Fork, in particular, comprises numerous towns and villages known collectively as "The Hamptons" and has an international reputation as a "playground for the rich and famous", with some of the wealthiest communities in the United States. In 2015, according to Business Insider, the 11962 zip code encompassing Sagaponack, within Southampton, was listed as the most expensive in the U.S. by real estate-listings site Property Shark, with a median home sale price of $5,125,000.[90] During the summer season, many celebrities and the wealthy visit or reside in mansions and waterfront homes, while others spend weekends enjoying the beaches, gardens, bars, restaurants, and nightclubs.
Long Island is served by a network of parkways and expressways, with the Long Island Expressway, Northern State Parkway, and Southern State Parkway being major east–west routes across significant portions of the island. Commuter rail access is provided by the Metropolitan Transportation Authority (MTA) Long Island Rail Road, one of the largest commuter railroads in the United States. Air travel needs are served by several airports. Within Queens, the island is home to John F. Kennedy International Airport and LaGuardia Airport, two of the three major airline hubs serving the New York area (with Newark Liberty International Airport being the third; all three major airports are operated by The Port Authority of New York & New Jersey). Long Island MacArthur Airport (serving commercial airlines) and Farmingdale/Republic Airport (private and commuter flights) are both located in Suffolk County.
Lower Hudson Valley
[edit]Known for its hilly terrain, picturesque settings, and quaint small towns and villages, the Lower Hudson Valley is centered around the Hudson River north of New York City and lies within New York State. Westchester and Putnam counties are located on the eastern side of the river, and Rockland and Orange counties are located on the western side of the river. Westchester and Rockland counties are connected by the heavily trafficked New Tappan Zee Bridge, as well as by the Bear Mountain Bridge near their northern ends. Several branches of the MTA Metro-North Railroad serve the region's rail commuters. Southern Westchester County contains more densely populated areas and includes the cities of Yonkers, Mount Vernon, New Rochelle, and White Plains. Many of the suburban communities of Westchester are known for their affluence and expense (some examples: Bronxville, Scarsdale, Chappaqua, Armonk, Katonah, and Briarcliff Manor). Rockland's river towns along the Hudson, including Nyack and Piermont, are known for their vibrant dining and art scenes. 30% of Rockland's land area is designated parkland with impressive scenery, which attracts many visitors from the tristate area. In recent years, the high cost of housing in the Lower Hudson Valley, plus increased remote working opportunities, has caused some to move further north into the Mid Hudson Valley.
Historically, the valley was home to many factories, including paper mills, but a significant number have closed. After years of lingering pollution, cleanup efforts to improve the Hudson River water quality are currently planned and will be supervised by the United States Environmental Protection Agency (EPA).[91]
Mid-Hudson Valley
[edit]The Mid-Hudson Valley region of the State of New York is midway between New York City and the state capital of Albany. The area includes the counties of Dutchess, Ulster, and Sullivan, as well as the northern portions of Orange County, with the region's main cities being Poughkeepsie, Newburgh, Kingston, and Beacon. The Walkway over the Hudson, is the second longest pedestrian footbridge in the world. It crosses the Hudson River connecting Poughkeepsie and Highland. The 13 mile-long Dutchess Rail Trail stretches from Hopewell Junction to the beginning of the Walkway over the Hudson in Poughkeepsie. The area is home to the Wappingers Central School District, which the second-largest school district in the state of New York. The Newburgh Waterfront in the City of Newburgh is home to many high-end restaurants.
U.S. Route 9, I-84, and the Taconic State Parkway all run through Dutchess County. Metro-North Railroad train station, New Hamburg, is located in the Town of Poughkeepsie and runs from Poughkeepsie to Grand Central Terminal in New York City.
Northern New Jersey
[edit]

Northern New Jersey, also known colloquially as North Jersey, is typically defined as comprising the following counties:
- Bergen County
- Essex County
- Somerset County (anything north of Bridgewater Township)
- Hudson County
- Hunterdon County (anything north of Readington Township)
- Morris County
- Passaic County
- Sussex County
- Union County
- Warren County
The New Jersey State Department of Tourism splits North Jersey into the urban Gateway Region and the more rural Skylands Region. Northern New Jersey is home to four of the largest cities of that state: Newark, Jersey City, Paterson, and Elizabeth.
The region is geographically diverse with wetlands, mountains, and valleys throughout the area. It has a large network of expressways and public transportation rail services, mostly operated by New Jersey Transit. Northern New Jersey also contains the second busiest airport in the New York metropolitan area, Newark Liberty International Airport.
Although it is a suburban and rural region of New York, much of the Gateway Region is highly urbanized. The entirety of Hudson County, eastern Essex County, southern Passaic County as well as Elizabeth in Union County are all densely populated areas.
Central New Jersey
[edit]


Central Jersey is the middle portion of New Jersey. Municipalities including Trenton (the state capital of New Jersey and the only U.S. state capital within the New York metropolitan area) and Princeton, home to Princeton University, are located in this subregion, as is a significant portion of the Jersey Shore. Major transportation links include the New Jersey Turnpike and the Northeast Corridor, which bisect Central Jersey. Although Central Jersey does not have any officially defined boundaries, it generally comprises the following counties:
- Middlesex County
- Mercer County
- Monmouth County
- Ocean County (sometimes considered part of South Jersey)
- Union County
- Hunterdon County (anything south of Readington Township)
- Somerset County (anything south of Bridgewater Township)

Western Connecticut
[edit]
Fairfield, New Haven, and Litchfield counties in western Connecticut (like the state in general) are known for affluence. Large businesses are scattered throughout the area, mostly in Fairfield County. The land is flat along the coast with low hills eventually giving way to larger hills such as The Berkshires further inland, to the Massachusetts border. Most of the largest cities in the state are in New Haven County (home to Yale University) and Fairfield County.
Candlewood Lake is the largest recreational lake in the New York metropolitan area. The lake is located within the Greater Danbury region, and is home to many second homes of New York City residents.
Pike County, Pennsylvania
[edit]
Pike County, Pennsylvania is located in Northeastern Pennsylvania. As of the 2010 Census, the population was 57,369.[94] Its county seat is Milford.[95] Part of the Pocono Mountains region lies within Pike County, which has ranked among the fastest-growing counties of Pennsylvania.[96]
Communities
[edit]Main cities and towns
[edit]


The following is a list of "principal cities" and their respective population estimates from the 2020 U.S. Census. Principal cities include those with populations over 100,000 or major job, cultural, educational, and economic centers.[101][c]
| New York–Newark-Jersey City MSA | ||||
|---|---|---|---|---|
| City | State | 2020
census |
Land area | 2020 population density |
| New York City | 8,804,190 | 301.5 sq mi (781 km2) | 29,303/sq mi (11,314/km2) | |
| Hempstead | 793,409 | 191.7 sq mi (497 km2) | 6,685/sq mi (2,581/km2) | |
| Brookhaven | 485,773 | 531.5 sq mi (1,377 km2) | 1,873/sq mi (723/km2) | |
| Islip | 339,938 | 162.9 sq mi (422 km2) | 3,275/sq mi (1,264/km2) | |
| Newark | 311,549 | 24.1 sq mi (62 km2) | 12,904/sq mi (4,982/km2) | |
| Oyster Bay | 301,332 | 169.4 sq mi (439 km2) | 1,800/sq mi (690/km2) | |
| Jersey City | 292,449 | 14.8 sq mi (38 km2) | 19,835/sq mi (7,658/km2) | |
| North Hempstead | 237,639 | 69.1 sq mi (179 km2) | 4,441/sq mi (1,715/km2) | |
| Babylon | 218,223 | 114.2 sq mi (296 km2) | 4,170/sq mi (1,610/km2) | |
| Yonkers | 211,569 | 18 sq mi (47 km2) | 11,750/sq mi (4,540/km2) | |
| Huntington | 204,127 | 137.1 sq mi (355 km2) | 2,162/sq mi (835/km2) | |
| Paterson | 159,732 | 8.4 sq mi (22 km2) | 18,986/sq mi (7,331/km2) | |
| Ramapo | 148,919 | 61.8 sq mi (160 km2) | 2,400/sq mi (930/km2) | |
| Elizabeth | 137,298 | 12.3 sq mi (32 km2) | 11,145/sq mi (4,303/km2) | |
| Lakewood | 135,158 | 24.7 sq mi (64 km2) | 5,476/sq mi (2,114/km2) | |
| Smithtown | 116,296 | 111.4 sq mi (289 km2) | 1,000/sq mi (390/km2) | |
| Edison | 107,588 | 30.1 sq mi (78 km2) | 3,578/sq mi (1,381/km2) | |
| Woodbridge | 103,639 | 23.3 sq mi (60 km2) | 4,456/sq mi (1,720/km2) | |
| Toms River | 95,438 | 40.55 sq mi (105.0 km2) | 2,353/sq mi (908/km2) | |
| Greenburgh | 95,397 | 30.31 sq mi (78.5 km2) | 3,147/sq mi (1,215/km2) | |
| Clifton | 90,296 | 11.28 sq mi (29.2 km2) | 8,005/sq mi (3,091/km2) | |
| Clarkstown | 86,855 | 38.47 sq mi (99.6 km2) | 2,258/sq mi (872/km2) | |
| New Rochelle | 79,726 | 10.29 sq mi (26.7 km2) | 7,751/sq mi (2,993/km2) | |
| Mount Vernon | 73,893 | 4.39 sq mi (11.4 km2) | 16,824/sq mi (6,496/km2) | |
| Passaic | 70,537 | 3.13 sq mi (8.1 km2) | 22,535/sq mi (8,701/km2) | |
| Union City | 68,589 | 1.29 sq mi (3.3 km2) | 53,170/sq mi (20,530/km2) | |
| Piscataway | 60,804 | 18.79 sq mi (48.7 km2) | 3,236/sq mi (1,249/km2) | |
| Hoboken | 60,419 | 1.25 sq mi (3.2 km2) | 48,335/sq mi (18,662/km2) | |
| White Plains | 59,559 | 9.74 sq mi (25.2 km2) | 6,117/sq mi (2,362/km2) | |
| Union | 59,728 | 9.05 sq mi (23.4 km2) | 6,600/sq mi (2,500/km2) | |
| Perth Amboy | 55,436 | 4.66 sq mi (12.1 km2) | 11,896/sq mi (4,593/km2) | |
| New Brunswick | 55,266 | 5.23 sq mi (13.5 km2) | 10,567/sq mi (4,080/km2) | |
| Wayne | 54,838 | 23.72 sq mi (61.4 km2) | 2,312/sq mi (893/km2) | |
| West Orange | 48,843 | 12 sq mi (31 km2) | 4,070/sq mi (1,570/km2) | |
| Hackensack | 46,030 | 4.19 sq mi (10.9 km2) | 10,986/sq mi (4,242/km2) | |
| Montclair | 40,921 | 6.24 sq mi (16.2 km2) | 6,558/sq mi (2,532/km2) | |
| Fort Lee | 40,191 | 2.52 sq mi (6.5 km2) | 15,949/sq mi (6,158/km2) | |
| Long Beach | 35,029 | 2.22 sq mi (5.7 km2) | 15,793/sq mi (6,098/km2) | |
| Long Branch | 31,667 | 5.12 sq mi (13.3 km2) | 6,185/sq mi (2,388/km2) | |
| Westfield | 31,032 | 6.72 sq mi (17.4 km2) | 4,618/sq mi (1,783/km2) | |
| East Hampton | 28,385 | 74.33 sq mi (192.5 km2) | 381.88/sq mi (147.44/km2) | |
| Harrison | 28,218 | 16.77 sq mi (43.4 km2) | 1,683/sq mi (650/km2) | |
| Peekskill | 25,431 | 4.34 sq mi (11.2 km2) | 5,854/sq mi (2,260/km2) | |
| Morristown | 20,180 | 2.91 sq mi (7.5 km2) | 6,935/sq mi (2,678/km2) | |
| South Orange | 18,484 | 2.85 sq mi (7.4 km2) | 6,846/sq mi (2,643/km2) | |
| Rye | 16,592 | 5.85 sq mi (15.2 km2) | 2,835/sq mi (1,095/km2) | |
| Asbury Park | 15,188 | 1.43 sq mi (3.7 km2) | 10,621/sq mi (4,101/km2) | |
| Red Bank | 12,936 | 1.75 sq mi (4.5 km2) | 7,392/sq mi (2,854/km2) | |
| Freehold | 12,538 | 1.93 sq mi (5.0 km2) | 6,496/sq mi (2,508/km2) | |
| Somerville | 12,346 | 2.34 sq mi (6.1 km2) | 5,276/sq mi (2,037/km2) | |
| Milford | 1,103 | 0.47 sq mi (1.2 km2) | 2,352/sq mi (908/km2) | |
| Trenton-Princeton MSA | ||||
| Hamilton | 92,297 | 39.44 sq mi (102.1 km2) | 2,340/sq mi (900/km2) | |
| Trenton | 90,871 | 7.61 sq mi (19.7 km2) | 11,941/sq mi (4,610/km2) | |
| Ewing | 37,264 | 15.21 sq mi (39.4 km2) | 2,450/sq mi (950/km2) | |
| Princeton | 30,681 | 17.95 sq mi (46.5 km2) | 1,709/sq mi (660/km2) | |
| Bridgeport-Stamford-Norwalk-Danbury MSA | ||||
| Bridgeport | 148,654 | 16 sq mi (41 km2) | 7,700/sq mi (3,000/km2) | |
| Stamford | 135,470 | 37.62 sq mi (97.4 km2) | 3,601/sq mi (1,390/km2) | |
| Norwalk | 91,184 | 22.89 sq mi (59.3 km2) | 3,984/sq mi (1,538/km2) | |
| Danbury | 86,518 | 41.95 sq mi (108.7 km2) | 2,062/sq mi (796/km2) | |
| Greenwich | 63,518 | 47.8 sq mi (124 km2) | 1,329/sq mi (513/km2) | |
| Fairfield | 61,512 | 29.9 sq mi (77 km2) | 2,057/sq mi (794/km2) | |
| Stratford | 52,355 | 17.6 sq mi (46 km2) | 2,975/sq mi (1,149/km2) | |
| New Haven-Milford-Waterbury MSA | ||||
| New Haven | 135,081 | 18.69 sq mi (48.4 km2) | 7,170/sq mi (2,770/km2) | |
| Waterbury | 114,403 | 28.52 sq mi (73.9 km2) | 4,011/sq mi (1,549/km2) | |
| Hamden | 61,169 | 32.8 sq mi (85 km2) | 1,800/sq mi (690/km2) | |
| West Haven | 55,584 | 10.75 sq mi (27.8 km2) | 5,171/sq mi (1,997/km2) | |
| Milford | 50,558 | 21.91 sq mi (56.7 km2) | 2,308/sq mi (891/km2) | |
| Kiryas Joel-Poughkeepsie-Newburgh MSA | ||||
| Kiryas Joel | 32,954 | 1.46 sq mi (3.8 km2) | 22,571/sq mi (8,715/km2) | |
| Poughkeepsie | 31,577 | 5.14 sq mi (13.3 km2) | 6,137/sq mi (2,370/km2) | |
| Middletown | 30,345 | 5.31 sq mi (13.8 km2) | 5,719/sq mi (2,208/km2) | |
| Newburgh | 28,856 | 3.81 sq mi (9.9 km2) | 7,582/sq mi (2,927/km2) | |
| Beacon | 13,769 | 4.74 sq mi (12.3 km2) | 2,905/sq mi (1,122/km2) | |
| Port Jervis | 8,775 | 2.53 sq mi (6.6 km2) | 3,468/sq mi (1,339/km2) | |
| Kingston MSA | ||||
| Kingston | 24,069 | 7.48 sq mi (19.4 km2) | 3,217/sq mi (1,242/km2) | |
| New Paltz | 7,324 | 1.76 sq mi (4.6 km2) | 4,157/sq mi (1,605/km2) | |
| East Stroudsburg MSA | ||||
| East Stroudsburg | 9,669 | 2.84 sq mi (7.4 km2) | 3,400/sq mi (1,300/km2) | |
| Stroudsburg | 5,927 | 1.73 sq mi (4.5 km2) | 3,436/sq mi (1,327/km2) | |
| Torrington μSA | ||||
| Torrington | 35,515 | 39.77 sq mi (103.0 km2) | 893/sq mi (345/km2) | |
Urban areas
[edit]
| Urban area | Population (2020 census) |
Land area (sq mi) |
Land area (km2) |
Density (population / sq mi) |
Density (population / km2) |
|---|---|---|---|---|---|
| New York–Jersey City–Newark, NY–NJ | 19,426,449 | 3,248.12 | 8,412.59 | 5,980.83 | 2,309.21 |
| Bridgeport–Stamford, CT–NY † | 916,408 | 397.29 | 1,028.98 | 2,306.63 | 890.60 |
| New Haven, CT † | 561,456 | 298.01 | 771.85 | 1,884.00 | 727.42 |
| Trenton, NJ † | 370,422 | 133.13 | 344.81 | 2,782.39 | 1,074.29 |
| Poughkeepsie–Newburgh, NY † | 314,766 | 209.92 | 543.69 | 1,499.45 | 578.94 |
| Waterbury, CT † | 199,317 | 92.44 | 239.41 | 2,156.22 | 832.52 |
| Danbury, CT–NY † | 171,680 | 118.49 | 306.88 | 1,448.92 | 559.43 |
| Kiryas Joel, NY † | 71,582 | 28.75 | 74.47 | 2,489.47 | 961.19 |
| Middletown, NY † | 61,516 | 25.96 | 67.24 | 2,369.55 | 914.89 |
| Riverhead–Southold, NY | 51,120 | 52.80 | 136.74 | 968.25 | 373.84 |
| Kingston, NY † | 50,254 | 31.10 | 80.54 | 1,615.96 | 623.93 |
| East Stroudsburg–Stroudsburg, PA † | 47,891 | 38.94 | 100.85 | 1,229.95 | 474.89 |
| Torrington, CT † | 35,212 | 21.76 | 56.36 | 1,618.24 | 624.81 |
| Hamburg–Vernon–Highland Lakes, NJ | 28,250 | 21.81 | 56.48 | 1,295.53 | 500.21 |
| Ridgefield, CT † | 25,683 | 28.80 | 74.59 | 891.77 | 344.32 |
| Coolbaugh–Pocono Pines, PA † | 24,893 | 19.74 | 51.13 | 1,260.93 | 486.85 |
| Flemington–Raritan, NJ | 24,401 | 18.39 | 47.64 | 1,326.60 | 512.20 |
| Mystic Island–Little Egg Harbor, NJ | 23,074 | 12.97 | 33.60 | 1,778.41 | 686.65 |
| East Hampton North–Springs–Northwest Harbor, NY | 21,812 | 35.85 | 92.86 | 608.39 | 234.90 |
| West Milford, NJ–NY | 17,659 | 14.22 | 36.83 | 1,241.82 | 479.47 |
| Port Jervis, NY–PA | 16,187 | 7.59 | 19.65 | 2,133.62 | 823.80 |
| Clinton, NJ | 16,136 | 10.46 | 27.10 | 1,541.92 | 595.34 |
| Walden, NY † | 15,784 | 11.56 | 29.95 | 1,365.14 | 527.08 |
| Lake Mohawk, NJ | 13,164 | 8.23 | 21.32 | 1,598.92 | 617.35 |
| Newton, NJ | 12,813 | 7.90 | 20.47 | 1,621.50 | 626.06 |
| New Paltz, NY † | 9,969 | 4.89 | 12.66 | 2,039.69 | 787.53 |
| Oak Ridge, NJ | 8,871 | 5.41 | 14.01 | 1,640.23 | 633.30 |
| Winsted, CT † | 7,804 | 6.12 | 15.86 | 1,274.47 | 492.08 |
| Ellenville, NY † | 7,090 | 3.30 | 8.56 | 2,146.31 | 828.70 |
| Warwick, NY † | 7,084 | 2.92 | 7.56 | 2,427.84 | 937.40 |
| Chester, NY † | 5,900 | 4.57 | 11.84 | 1,290.39 | 498.22 |
| Montauk, NY | 3,845 | 5.93 | 15.35 | 648.76 | 250.49 |
| Palmyra, PA | 3,772 | 8.30 | 21.49 | 454.71 | 175.56 |
History
[edit]
During the Wisconsinan glaciation, the region was situated at the edge of a large ice sheet over 1,000 feet in depth. The ice sheet scraped away large amounts of soil, leaving the bedrock that serves as the geologic foundation for much of the New York metropolitan region today. Later on, the ice sheet would help split apart what are now Long Island and Staten Island.
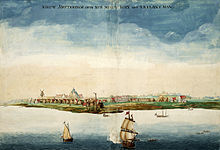
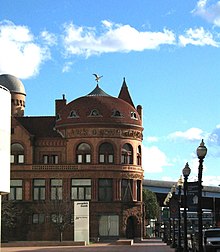
At the time of European contact the region was inhabited by Native Americans, predominantly the Lenape,[103] and others. The Native Americans used the abundant waterways in the area for many purposes, such as fishing and trade routes. Sailing for France in 1524, Giovanni da Verrazzano was the first European to enter the local waters and encounter the residents, but he did not make landfall. Henry Hudson, sailing for the Dutch in 1609, visited the area and built a settlement on Lower Manhattan Island that was eventually renamed New Amsterdam by Dutch colonists in 1626.[104] In 1664, the area went under English control,[104][105] and was later renamed New York after King Charles II of England granted the lands to his brother, the Duke of York.[106][107]
As the fur trade expanded further north, New York became a trading hub, which brought in a diverse set of ethnic groups including Africans, Jews, and Portuguese. The island of Manhattan had an extraordinary natural harbor formed by New York Bay (actually the drowned lower river valley of the Hudson River, enclosed by glacial moraines), the East River, which is a tidal strait, and the Hudson River, all of which merge at the southern tip, from which all later development spread. During the American Revolution, the strategic waterways made New York vitally important as a wartime base for the British navy. Many battles such as the Battle of Long Island and the Battle of New York were fought in the region to secure it. New York was captured by the British early in the war, becoming a haven for Loyalist refugees from other parts of the country, and remained in the hands of the British until the war ended in 1783. New York served as the capital of the United States from 1785 until 1790,[108] after which the capital moved to Philadelphia. New York has been the country's largest city since 1790.[109] In 1792, the Buttonwood Agreement, made by a group of merchants, created what is now the New York Stock Exchange in Lower Manhattan. Today, many people in the metropolitan area work in this important stock exchange.
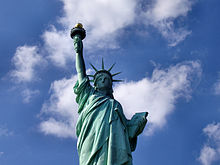
The Statue of Liberty in New York Harbor greeted millions of immigrants as they came to America by ship in the late 19th and early 20th centuries[111] and is a globally recognized symbol of the United States and its democracy.[112] Large-scale immigration into New York was a result of a large demand for manpower. A cosmopolitan attitude in the city created tolerance for various cultures and ethnic groups. German, Irish, and Italian immigrants were among the largest ethnic groups. Today, many of their descendants continue to live in the region. Cultural buildings such as the Metropolitan Museum of Art, the Metropolitan Opera, and the American Museum of Natural History were built. New York newspapers were read around the country as media moguls James Gordon Bennett, Sr., Joseph Pulitzer and William Randolph Hearst battled for readership. In 1884, over 70% of exports passed through ports in New York or in one of the surrounding towns. The five boroughs of New York — The Bronx, Brooklyn, Manhattan, Queens, and Staten Island — were consolidated into a single city in 1898.[113][114]

The newly unified New York City encouraged both more physical connections between the boroughs and the growth of bedroom communities. The New York City Subway began operating in 1904 as the Interborough Rapid Transit Company, one of three systems (the other two being the Brooklyn-Manhattan Transit Corporation and the Independent Subway System) that were later taken over by the city. Railroad stations such as Grand Central Terminal and Pennsylvania Station helped fuel suburban growth. During the era of the Prohibition, when alcohol was banned nationwide, organized crime grew to supply the high demand for bootleg alcohol. The Broadway Theater District began to develop with the opening of the New York Subway in 1904 and, by the early part of the twentieth century, had been made world-famous as New York's theatrical and entertainment center through popular musical productions like Ziegfeld Follies and Show Boat and the opening of multiple large, extravagantly decorated theatres in the area spanning Broadway from 47th to 42nd Streets.
The Great Depression suspended the region's fortunes as a period of widespread unemployment and poverty began. City planner Robert Moses began his automobile-centered career of building bridges, parkways, and later expressways across the tri-state area. During World War II, the city economy was hurt by blockades of German U-boats, which limited shipping with Europe.
After its population peaked in 1950, a significant portion of the city's population left for the suburbs of New York over the following decades. The effects were a result of white flight. Industry and commerce also declined in this era, with businesses relocating to the suburbs or other regions. The era also saw an increase in the construction of housing projects for the city's low-income population under the New York City Housing Authority, coinciding with the destruction of communities to construct interstate highways to link the city with its suburbs. The city, particularly Brooklyn, was dealt a psychological as well as an economic blow with the loss of the iconic Brooklyn Dodgers major-league baseball team, which moved to Los Angeles after the 1957 season. Crime affected the city severely. Urban renewal projects alleviated decay in poorer neighborhoods to a certain extent, but many of these later proved to be failures and caused unanticipated consequences like ghettoization, informal racial segregation in housing, and disruption of the organic urban fabric that made the city's neighborhoods cohesive and healthy places to live. There was little reported social unrest during the Northeast Blackout of 1965, but the New York City Blackout of 1977 led to massive rioting, looting, and arson in some parts of the city. In addition, the 1970s recession crippled traditional industries such as manufacturing in the New York City region. A rare positive highlight of the period was the completion of the original World Trade Center, a massive office complex in New York's Financial District whose iconic, 110-story Twin Towers for a short time stood as the world's tallest buildings.
In the 1980s, the city's economy was booming, particularly in the financial sector. Wall Street was fueling an economic surge in the real estate market, and later the dot-com bubble. Despite this, crime was still an issue. This was exacerbated by the crack epidemic, with the New York City area being one of the major ports of entry for narcotics entering the United States. Neighborhoods such as the South Bronx became prime examples of late 20th century urban decay. Beginning in the 1990s, however, crime dropped substantially due to tough on crime policies. Crime in New York City has continued to decline through the 21st century.


The September 11th attacks in 2001 were pivotal in the region and nation's history. The attacks killed nearly 3,000 people as two planes crashed into the former World Trade Center and caused the towers to collapse. Businesses led an exodus from Lower Manhattan because of this but were replaced by an increased number of high-rise residences and a building boom in New York continues to this day.
In 2003, another blackout occurred, the 2003 North America blackout, but the city suffered no looting.

On October 29 and 30, 2012, Hurricane Sandy caused extensive destruction in the metropolitan area, ravaging portions of the Atlantic coastline with record-high storm surge, severe flooding, and high winds, causing power outages for millions of residents via downed trees and power lines and malfunctions at electrical substations, leading to gasoline shortages and snarling mass transit systems. Damage to New York and New Jersey in terms of physical infrastructure and private property as well as including interrupted commerce was estimated at several tens of billions of dollars.[115] The storm and its profound impacts have prompted the discussion of constructing seawalls and other coastal barriers around the shorelines of the metropolitan area to minimize the risk of destructive consequences from another such event in the future.[116][117]
One World Trade Center, also known as Freedom Tower, was completed in 2014 to replace the fallen Twin Towers.
The 2017–2021 New York City transit crisis, which began with what media outlets referred to as the 2017 "summer of hell," led New York Governor Andrew Cuomo to declare a state of emergency. The crisis was due to the interaction of multiple severe problems in the New York City Subway system and in New York City bus lines, as well as at Penn Station, the final stop on several of the commuter lines connecting New York City with other parts of the metropolitan area. Its root causes included long-term neglect of critical infrastructure and lack of adequate funding for ongoing operations, among others. The state of emergency was formally ended on June 30, 2021.
Statistical history
[edit]
The U.S. Census Bureau first designated metropolitan areas in 1950 as standard metropolitan areas (SMAs). The "New York–Northeastern NJ SMA" was defined to include 17 counties: 9 in New York (the five boroughs of New York City, Nassau, Suffolk, Westchester, and Rockland) and 8 in New Jersey (Bergen, Hudson, Passaic, Essex, Union, Morris, Somerset, and Middlesex). In 1960, the metropolitan area standards were modified and renamed standard metropolitan statistical areas (SMSAs). The new standards resulted in the splitting of the former SMA into several pieces: the nine New York counties became the "New York SMSA"; three of the New Jersey counties (Essex, Union, and Morris) became the "Newark SMSA"; two other New Jersey counties (Bergen and Passaic) became the "Paterson–Passaic–Clifton SMSA"; Hudson County was designated the "Jersey City SMSA"; and Middlesex and Somerset counties lost their metropolitan status. In 1973, a new set of metropolitan area standards resulted in further changes: Nassau and Suffolk counties were split off as their own SMSA ("Nassau–Suffolk SMSA"); Bergen County (originally part of the Paterson–Clifton–Passaic SMSA) was transferred to the New York SMSA; the New York SMSA also received Putnam County (previously non-metropolitan); Somerset County was added to the Newark SMSA; and two new SMSAs, the "New Brunswick–Perth Amboy–Sayreville SMSA" (Middlesex County) and "Long Branch–Asbury Park SMSA" (Monmouth County), were established. In 1983, the concept of a consolidated metropolitan statistical area (CMSA) was first implemented. A CMSA consisted of several primary metropolitan statistical areas (PMSAs), which were individual employment centers within a wider labor market area. The "New York–Northern New Jersey–Long Island CMSA" consisted of 12 PMSAs.

Seven PMSAs were based on the original 1950 New York SMA that were split up: New York, Bergen–Passaic, Jersey City, Middlesex–Somerset–Hunterdon (Hunterdon added for the first time), Monmouth–Ocean (Ocean added for the first time), Nassau–Suffolk, and Newark (Sussex added for the first time). One additional PMSA was the Orange County PMSA (previously the Newburgh–Middletown SMSA). The other four PMSAs were former SMSAs in Connecticut: Bridgeport, Stamford, Norwalk, and Danbury. In 1993, four PMSAs were added to the New York–Northern New Jersey–Long Island CMSA: Trenton PMSA (Mercer County), Dutchess County PMSA, Waterbury PMSA, and New Haven PMSA. Several new counties were also added to the CMSA: Sussex, Warren, and Pike. The CMSA model was originally utilized for tabulating data from the 2000 census. In 2003, a new set of standards was established using the Core Based Statistical Area (CBSA) model was adopted and remains in use as of 2010. The CBSA model resulted in the splitting up of the old CMSA into several metropolitan statistical areas: New York–Northern New Jersey–Long Island, Poughkeepsie–Newburgh–Middletown, Trenton–Princeton, Bridgeport–Stamford–Norwalk (includes Danbury), and New Haven–Milford (includes Waterbury). In 2013, the Census Bureau added Carbon, Lehigh, Northampton, and Monroe counties in Pennsylvania, and Warren County, New Jersey (encompassing collectively the Allentown-Bethlehem-Easton, PA-NJ MSA and the East Stroudsburg, PA MSA), to the Combined Statistical Area,[120] and assimilated Poughkeepsie–Newburgh–Middletown into the larger New York–Northern New Jersey–Long Island–NY–NJ–PA MSA. In 2018, the Allentown-Bethlehem-Easton, PA-NJ MSA was removed from the Combined Statistical Area.[121]
Proposals for the region
[edit]The metropolitan region has never had separate political representation from the rest of their original states. This has to do with disagreements in the desired model and the constitutional complexity of the metropolitan region being cross-state. Within the State of New York over the last 30 years,[122] discussions have emerged of splitting the states into different regions with separate governors and legislators whilst remaining part of the same state — as opposed to seeing New York and its metropolitan area being split into a separate state.[123][124] The idea has been seen by Republicans in the state as an opportunity to dislocate the Democratic party's hold in the state legislature.[125][126]
The discussion surrounding the re-organization of New York State has commonly been in two models: The two-region model creates a "downstate" New York region which would consist of all five New York City boroughs, Long Island's Nassau and Suffolk counties, and Westchester and Rockland counties, then Upstate would be the remaining 53;[125][123] and the three-region model is New York having five counties; Montauk would consist of Nassau, Suffolk, Rockland, and Westchester counties and; New Amsterdam would be the remaining portion of New York State.[125][124][127] This debate was reported as recent as February 2019, when Republican state Senator Daphne Jordan supported the state being split into two states;[125][123] however, it was believed that the proposal would require an act of congress for it to be passed.[128]
Demographics
[edit]


| Census | Pop. | Note | %± |
|---|---|---|---|
| 1830 | 552,237 | — | |
| 1840 | 740,120 | 34.0% | |
| 1850 | 1,142,304 | 54.3% | |
| 1860 | 1,801,668 | 57.7% | |
| 1870 | 2,319,319 | 28.7% | |
| 1880 | 2,951,270 | 27.2% | |
| 1890 | 3,845,151 | 30.3% | |
| 1900 | 5,231,748 | 36.1% | |
| 1910 | 7,248,147 | 38.5% | |
| 1920 | 8,693,184 | 19.9% | |
| 1930 | 11,123,506 | 28.0% | |
| 1940 | 11,950,188 | 7.4% | |
| 1950 | 13,299,834 | 11.3% | |
| 1960 | 15,346,313 | 15.4% | |
| 1970 | 17,065,328 | 11.2% | |
| 1980 | 16,363,636 | −4.1% | |
| 1990 | 16,846,046 | 2.9% | |
| 2000 | 18,323,006 | 8.8% | |
| 2010 | 18,897,109 | 3.1% | |
| 2020 | 20,140,470 | 6.6% | |
| 2023 (est.) | 19,498,249 | −3.2% | |
| U.S. Decennial Census 1900–1990[135] | |||
2020 census
[edit]| County | 2020 census | 2010 census | Change | Area | Density |
|---|---|---|---|---|---|
| Bronx County, New York | 1,472,654 | 1,385,108 | +6.32% | 42.2 sq mi (109 km2) | 34,897/sq mi (13,474/km2) |
| Kings County, New York | 2,736,074 | 2,504,700 | +9.24% | 69.4 sq mi (180 km2) | 39,425/sq mi (15,222/km2) |
| Nassau County, New York | 1,395,774 | 1,339,532 | +4.20% | 284.5 sq mi (737 km2) | 4,906/sq mi (1,894/km2) |
| New York County, New York | 1,694,251 | 1,585,873 | +6.83% | 22.7 sq mi (59 km2) | 74,637/sq mi (28,817/km2) |
| Putnam County, New York | 97,668 | 99,710 | −2.05% | 230.2 sq mi (596 km2) | 424/sq mi (164/km2) |
| Queens County, New York | 2,405,464 | 2,230,722 | +7.83% | 108.7 sq mi (282 km2) | 22,129/sq mi (8,544/km2) |
| Richmond County, New York | 495,747 | 468,730 | +5.76% | 57.5 sq mi (149 km2) | 8,622/sq mi (3,329/km2) |
| Rockland County, New York | 338,329 | 311,687 | +8.55% | 173.4 sq mi (449 km2) | 1,951/sq mi (753/km2) |
| Suffolk County, New York | 1,525,920 | 1,493,350 | +2.18% | 911.2 sq mi (2,360 km2) | 1,675/sq mi (647/km2) |
| Westchester County, New York | 1,004,457 | 949,113 | +5.83% | 430.7 sq mi (1,116 km2) | 2,332/sq mi (900/km2) |
| Bergen County, New Jersey | 955,732 | 905,116 | +5.59% | 233.8 sq mi (606 km2) | 4,088/sq mi (1,578/km2) |
| Essex County, New Jersey | 863,728 | 783,969 | +10.17% | 126.1 sq mi (327 km2) | 6,850/sq mi (2,645/km2) |
| Hudson County, New Jersey | 724,854 | 634,266 | +14.28% | 46.2 sq mi (120 km2) | 15,689/sq mi (6,058/km2) |
| Hunterdon County, New Jersey | 128,947 | 128,349 | +0.47% | 427.8 sq mi (1,108 km2) | 301/sq mi (116/km2) |
| Middlesex County, New Jersey | 863,162 | 809,858 | +6.58% | 309.2 sq mi (801 km2) | 2,792/sq mi (1,078/km2) |
| Monmouth County, New Jersey | 643,615 | 630,380 | +2.10% | 468.2 sq mi (1,213 km2) | 1,375/sq mi (531/km2) |
| Morris County, New Jersey | 509,285 | 492,276 | +3.46% | 461.0 sq mi (1,194 km2) | 1,105/sq mi (427/km2) |
| Ocean County, New Jersey | 637,229 | 576,567 | +10.52% | 628.3 sq mi (1,627 km2) | 1,014/sq mi (392/km2) |
| Passaic County, New Jersey | 524,118 | 501,226 | +4.57% | 186.0 sq mi (482 km2) | 2,818/sq mi (1,088/km2) |
| Somerset County, New Jersey | 345,361 | 323,444 | +6.78% | 301.9 sq mi (782 km2) | 1,144/sq mi (442/km2) |
| Sussex County, New Jersey | 144,221 | 149,265 | −3.38% | 518.7 sq mi (1,343 km2) | 278/sq mi (107/km2) |
| Union County, New Jersey | 575,345 | 536,499 | +7.24% | 102.8 sq mi (266 km2) | 5,597/sq mi (2,161/km2) |
| Pike County, Pennsylvania | 58,535 | 57,369 | +2.03% | 544.9 sq mi (1,411 km2) | 107/sq mi (41/km2) |
| Total | 20,140,470 | 18,897,109 | +6.58% | 8,294.21 sq mi (21,481.9 km2) | 2,428/sq mi (938/km2) |
2010 census
[edit]This section needs additional citations for verification. (October 2023) |
| Racial composition | 2010 |
|---|---|
| White | 73.4% |
| —Non-Hispanic White | 51.7% |
| —Hispanic or Latino (of any race) | 21.7% |
| Black or African-American | 15.3% |
| Asian | 9% |
| Native American or Alaskan Native | 0.2% |
| Other | 0.5% |
| Two or more races | 1.6% |
As of the 2010 Census, the metropolitan area had a population of 22,085,649. The population density was 1,865 per square mile. The racial markup was 51.7% White (non-Latino), 21.7% Latino, 15.3% African-American, 9.0% Asian-American, 0.16% Native American and Alaskan Native, 0.03% Pacific Islands American, 0.5% Other, and 1.6% Multiracial.[136]
The median age was 37.9. 25.5% were under 18, 9.5% were 18 to 24 years, 28% were 25 to 44 years of age, 26.6% were 45 to 64 years old, and 13.2% were over the age of 65. Males composed 48.3% of the population while females were 51.7% of the population.[citation needed]
97.7% of the population were in households, 2.3% were in group quarters, and 1% were institutionalized. There were 8,103,731 households, of which 30.2% or 2,449,343 had children. 46.1% or 3,736,165 were composed of opposite sex and married couples. Male households with no wife composed 4.9% or 400,534. 15.0% or 1,212,436 were female households with no husbands. 34% or 2,754,596 were non-family households. The household density was 684 per square mile. 91.9% of housing units were occupied with a 3.8% vacancy rate. The average household size was 2.65 per household. The average income for non-family households was $90,335, and the average income for families was $104,715. 13.3% or 2,888,493 of the population were below the poverty line.[citation needed]
26.7% or 5,911,993 of the population were born outside the United States. Out of this, most (50.6% or 2,992,639) were born in Latin America, 27.0% or 1,595,523 were born in Asia, 17.4% or 1,028,506 were born in Europe, 3.8% or 224,109 were born in Africa, and 0.2% or 11,957 were born in Oceania.[citation needed]
Population estimates
[edit]
As of 2020, the United States Census Bureau estimated the population of the New York combined statistical area at 23,582,649, the most populous in the United States and one of the world's most populous urban agglomerations. The increase in the population of the combined statistical area was distributed across the portions of the states of New York, New Jersey, Connecticut, and Pennsylvania which together constitute the greater New York City metropolitan area.
The New York metropolitan region is ethnically diverse. Asian Americans in New York City, according to the 2010 Census, number more than one million, greater than the combined totals of San Francisco and Los Angeles.[140] New York contains the highest total Asian population of any U.S. city proper.[141] The New York borough of Queens is home to the state's largest Asian American population and the largest Andean (Colombian, Ecuadorian, Peruvian, Chilean and Bolivian) populations in the United States, and is also the most ethnically diverse urban area in the world.[142][143] The Han Chinese population constitutes the fastest-growing ethnicity in New York State; multiple satellites of the original Manhattan Chinatown (紐約華埠), in Brooklyn (布鲁克林華埠), and around Flushing, Queens (法拉盛華埠), are thriving as traditionally urban enclaves, while also expanding rapidly eastward into suburban Nassau County.[144] on Long Island,[145] as the New York metropolitan region and New York State have become the top destinations for new Chinese immigrants, respectively, and large-scale Chinese immigration continues into New York City and surrounding areas.[146][147][148][149][150][151] In 2012, 6.3% of New York was of Chinese ethnicity, with nearly three-fourths living in either Queens or Brooklyn, geographically on Long Island.[152] In particular, the New York area has over 100,000 Fuzhounese people.[153] A community numbering 20,000 Korean-Chinese (Chaoxianzu (Chinese: 朝鲜族) or Joseonjok (Korean: 조선족)) is centered in Flushing, Queens, while New York is also home to the largest Tibetan population outside China, India, and Nepal, also centered in Queens.[154] Koreans made up 1.2% of the city's population, and Japanese 0.3%. Filipinos were the largest Southeast Asian ethnic group at 0.8%, followed by Vietnamese, who made up 0.2% of New York's population in 2010. Indians are the largest South Asian group, accounting for 2.4% of the city's population, with Bangladeshis and Pakistanis at 0.7% and 0.5%, respectively.[155] Queens is the preferred borough of settlement for Asian Indians, Koreans, and Filipinos,[156] as well as Malaysians[20] and other Southeast Asians;[157] while Brooklyn is receiving large numbers of both West Indian[158] as well as Asian Indian immigrants.
New York has the largest European and non-Hispanic white population of any American city. At 2.7 million in 2012, New York's non-Hispanic white population is larger than the non-Hispanic white populations of Los Angeles (1.1 million), Chicago (865,000), and Houston (550,000) combined.[159] The European diaspora residing in the city is very diverse. According to 2012 Census estimates, there were roughly 560,000 Italian Americans, 385,000 Irish Americans, 253,000 German Americans, 223,000 Russian Americans, 201,000 Polish Americans, and 137,000 English Americans. Additionally, Greek and French Americans numbered 65,000 each, with those of Hungarian descent estimated at 60,000 people. Ukrainian and Scottish Americans numbered 55,000 and 35,000, respectively. People identifying ancestry from Spain numbered 30,838 total in 2010.[160] People of Norwegian and Swedish descent both stood at about 20,000 each, while people of Czech, Lithuanian, Portuguese, Scotch-Irish, and Welsh descent all numbered between 12,000 and 14,000 people.[161] Arab Americans number over 160,000 in New York City,[162] with the highest concentration in Brooklyn. Central Asians, primarily Uzbek Americans, are a rapidly growing segment of the city's non-Hispanic white population, enumerating over 30,000, and including over half of all Central Asian immigrants to the United States,[163] most settling in Queens or Brooklyn. Albanian Americans are most highly concentrated in the Bronx.[164]
The wider New York metropolitan area is also ethnically diverse.[165] The New York metropolitan area is home the largest African American/Black population in the nation with nearly four million.[166] The New York region continues to be by far the leading metropolitan gateway for legal immigrants admitted into the United States, substantially exceeding the combined totals of Los Angeles and Miami, the next most popular gateway regions.[167][168][169][170] It is home to the largest Jewish as well as Israeli communities outside Israel, with the Jewish population in the region numbering over 1.5 million in 2012 and including many diverse Jewish sects from around the Middle East and Eastern Europe.[154] The metropolitan area is also home to 20% of the nation's Indian Americans and at least 20 Little India enclaves, as well as 15% of all Korean Americans and four Koreatowns;[171][172] the largest Asian Indian population in the Western Hemisphere; the largest Russian American,[146] Italian American, and African American populations; the largest Dominican American, Puerto Rican American, and South American[146] and second-largest overall Hispanic population in the United States, numbering 4.8 million;[160] and includes at least 6 established Chinatowns within New York City alone,[173] with the urban agglomeration consisting of a population of 819,527 uniracial overseas Chinese as of 2014 Census estimates,[174] the largest outside of Asia.[133][134]
Ecuador, Colombia, Guyana, Peru, and Brazil were the top source countries from South America for legal immigrants to the New York region in 2013; the Dominican Republic, Jamaica, Haiti, and Trinidad and Tobago in the Caribbean; Egypt, Ghana, and Nigeria from Africa; and El Salvador, Honduras, and Guatemala in Central America.[175] Amidst a resurgence of Puerto Rican migration to New York City, this population had increased to approximately 1.3 million in the metropolitan area as of 2013.
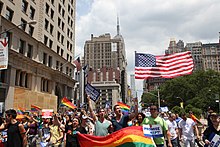
New York City has been described as the gay capital of the world, and is home to one of the world's largest LGBTQ populations and the most prominent.[176] The New York metropolitan area is home to a self-identifying gay and bisexual community estimated at 568,903 individuals, the largest in the United States and one of the world's largest.[138][139] Same-sex marriages in New York were legalized on June 24, 2011, and were authorized to take place beginning 30 days thereafter.[177] The annual New York City Pride March (or gay pride parade) traverses southward down Fifth Avenue in Manhattan, ending at Greenwich Village, and is the largest pride parade in the world, attracting tens of thousands of participants and millions of sidewalk spectators each June.[178]
Religion
[edit]


The 2014 Pew Religious Landscape Survey showed that the religious makeup of the New York metro area was as follows:
| Affiliation | % of New York population | |
|---|---|---|
| Christian | 59 | |
| Catholic | 33 | |
| Protestant | 23 | |
| Evangelical Protestant | 9 | |
| Mainline Protestant | 8 | |
| Black church | 6 | |
| Other Christian | 3 | |
| Unaffiliated | 24 | |
| Nothing in particular | 15 | |
| Agnostic | 4 | |
| Atheist | 4 | |
| Jewish | 8 | |
| Muslim | 4 | |
| Hindu | 2 | |
| Buddhist | 1 | |
| Other faiths | 1 | |
| Don't know/refused answer | 1 | |
| Total | 100 | |
Economy
[edit]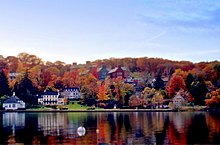
The New York City regional economy is the largest in the world, with a GDP of US$2.5 trillion in 2022, which would rank 8th among sovereign countries. Many Fortune 500 corporations are headquartered in New York,[182] as are a large number of foreign corporations. One out of ten private sector jobs in the city is with a foreign company.[183] In 2012 and 2015, New York topped the first and second Global Economic Power Index lists, respectively, as published by The Atlantic, with cities ranked according to criteria reflecting their presence on five different lists as published by five separate entities.[37][184] Finance, international trade, new and traditional media, real estate, education, fashion and entertainment, tourism, biotechnology, and manufacturing are the leading industries in the area. Along with its wealth, the area has a cost of living that is the highest in the United States.
Gross Domestic Product by County
[edit]| Rank (2022) |
County | GDP by County (million US$)[10] |
|---|---|---|
| 1 | New York | 885,651.810
|
| 2 | Kings | 125,866.867
|
| 3 | Suffolk | 125,184.540
|
| 4 | Queens | 122,288.187
|
| 5 | Nassau | 121,290.784
|
| 6 | Fairfield | 104,368.153
|
| 7 | Westchester | 103,162.225
|
| 8 | Bergen | 95,627.951
|
| 9 | Middlesex | 78,784.425
|
| 10 | Morris | 69,014.834
|
| 11 | Essex | 67,415.140
|
| 12 | New Haven | 61,456.416
|
| 13 | Hudson | 59,260.996
|
| 14 | Bronx | 51,573.982
|
| 15 | Mercer | 49,620.483
|
| 16 | Somerset | 48,293.447
|
| 17 | Monmouth | 46,342.232
|
| 18 | Union | 45,128.578
|
| 19 | Ocean | 28,260.414
|
| 20 | Passaic | 25,843.403
|
| 21 | Orange | 25,001.648
|
| 22 | Rockland | 22,031.406
|
| 23 | Richmond | 21,103.447
|
| 24 | Dutchess | 17,859.624
|
| 25 | Litchfield | 10,737.359
|
| 26 | Ulster | 9,052.826
|
| 27 | Hunterdon | 8,836.259
|
| 28 | Sussex | 5,900.635
|
| 29 | Putnam | 4,687.684
|
| 30 | Pike | 1,659.595
|
| New York-Newark, NY-NJ-CT-PA CSA | 2,504,721.129
|
Wall Street
[edit]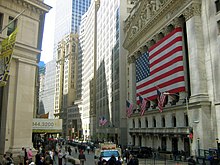

The New York metropolitan area's most important economic sector lies in its role as the headquarters for the U.S. financial industry, metonymously known as Wall Street. Anchored by Wall Street, in the Financial District of Lower Manhattan, New York has been called both the most economically powerful city and the leading financial center of the world,[37][188][189][190][191] and the city is home to the world's two largest stock exchanges by total market capitalization, the New York Stock Exchange and NASDAQ.[185][186] The city's securities industry, enumerating 163,400 jobs in August 2013, continues to form the largest segment of the city's financial sector and an important economic engine, accounting in 2012 for 5 percent of the city's private sector jobs, 8.5 percent (US$3.8 billion) of its tax revenue, and 22 percent of the city's total wages, including an average salary of US$360,700.[192]
Manhattan had approximately 520 million square feet (48.1 million m2) of office space in 2013,[193] making it the largest office market in the United States,[194] while Midtown Manhattan is the largest central business district in the nation.[195]
Lower Manhattan is the third-largest central business district in the United States and is home to both the New York Stock Exchange, on Wall Street, and the NASDAQ, at 165 Broadway, representing the world's largest and second largest stock exchanges, respectively, when measured both by overall average daily trading volume and by total market capitalization of their listed companies in 2013.[186] Wall Street investment banking fees in 2012 totaled approximately US$40 billion,[196] while in 2013, senior New York bank officers who manage risk and compliance functions earned as much as US$324,000 annually.[197]
In July 2013, NYSE Euronext, the operator of the New York Stock Exchange, took over the administration of the London interbank offered rate from the British Bankers Association.[198]
Many Wall Street firms have added or moved auxiliary financial or technical operations into Jersey City, to take advantage of New Jersey's relatively lower commercial real estate and rental prices, while offering continued geographic proximity to Manhattan's financial industry ecosystem.[199]
Tech and biotech
[edit]Silicon Alley, centered in New York, has evolved into a metonym for the sphere encompassing the metropolitan region's high technology industries[200] involving the internet, new media, financial technology (fintech) and cryptocurrency, telecommunications, digital media, software development, biotechnology, game design, and other fields within information technology that are supported by its entrepreneurship ecosystem and venture capital investments. High technology startup companies and employment are growing in New York and across the metropolitan region, bolstered by the city's emergence as a global node of creativity and entrepreneurship, social tolerance,[201] and environmental sustainability,[202][203] as well as New York's position as the leading Internet hub and telecommunications center in North America, including its vicinity to several transatlantic fiber optic trunk lines,[204] the city's intellectual capital, and its extensive outdoor wireless connectivity.[205] Verizon Communications, headquartered at 140 West Street in Lower Manhattan, was at the final stages in 2014 of completing a US$3 billion fiberoptic telecommunications upgrade throughout New York City.[206]
The biotechnology sector is also growing in the New York metropolitan region, based upon its strength in academic scientific research and public and commercial financial support. On December 19, 2011, then-New York mayor Michael Bloomberg announced his choice of Cornell University and Technion-Israel Institute of Technology to build Cornell Tech, a US$2 billion graduate school of applied sciences on Roosevelt Island, Manhattan with the goal of transforming New York into the world's premier technology capital.[207][208] By mid-2014, Accelerator, a biotech investment firm, had raised more than US$30 million from investors, including Eli Lilly and Company, Pfizer, and Johnson & Johnson, for initial funding to create biotechnology startups at the Alexandria Center for Life Science, which encompasses more than 700,000 square feet (65,000 m2) on East 29th Street and promotes collaboration among scientists and entrepreneurs at the center and with nearby academic, medical, and research institutions. The New York City Economic Development Corporation's Early Stage Life Sciences Funding Initiative and venture capital partners, including Celgene, General Electric Ventures, and Eli Lilly, committed a minimum of US$100 million to help launch 15 to 20 ventures in life sciences and biotechnology.[209] Westchester County has also developed a burgeoning biotechnology sector in the 21st century, with over US$1 billion in planned private investment as of 2016,[210] earning the county the nickname Biochester.[211]
Port of New York and New Jersey
[edit]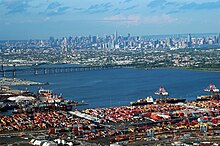
The Port of New York and New Jersey is the port district of the New York metropolitan area, encompassing the region within approximately a 25-mile (40 km) radius of the Statue of Liberty National Monument. A major economic engine for the New York metropolitan area, the port includes the system of navigable waterways in the estuary along 650 miles (1,050 km) of shoreline in the vicinity of New York and the Gateway Region of northeastern New Jersey, as well as the region's airports and supporting rail and roadway distribution networks. The Port of New York and New Jersey handled a maritime cargo volume in the ten months through October 2022 of over 8.2 million TEUs, benefitting post-Panamax from the expansion of the Panama Canal, and accelerating ahead of California seaports in monthly cargo volumes.[212][213]
Water purity and availability
[edit]Water purity and availability are a lifeline for the New York metropolitan region. New York City is supplied with drinking water by the protected Catskill Mountains watershed.[214] As a result of the watershed's integrity and undisturbed natural water filtration system, New York is one of only four major cities in the United States the majority of whose drinking water is pure enough not to require purification by water treatment plants.[215] The Croton Watershed north of the city is undergoing construction of a US$3.2 billion water purification plant to augment New York's water supply by an estimated 290 million gallons daily, representing a greater than 20% addition to the city's current availability of water.[216] The ongoing expansion of New York City Water Tunnel No. 3, an integral part of the New York City water supply system, is the largest capital construction project in the city's history,[217] with segments serving Manhattan and The Bronx completed, and with segments serving Brooklyn and Queens planned for construction in 2020.[218] Much of the fresh water for northern and central New Jersey is provided by reservoirs, but numerous municipal water wells exist which accomplish the same purpose.
Education
[edit]


The New York metropolitan area is home to many prestigious institutions of higher education. Three Ivy League universities: Columbia University in Manhattan, New York City; Princeton University in Princeton, New Jersey; Yale University in New Haven, Connecticut – all ranked amongst the top 3 U.S. national universities as per U.S. News & World Report as of 2018[219] – reside in the region,[220] as well as New York University and The Rockefeller University, both located in Manhattan; all of the above have been ranked amongst the top 35 universities in the world.[221] Rutgers University, a global university located 27 mi (43 km) southwest of Manhattan in New Brunswick, New Jersey, is by far the largest university in the region.[222] New York Institute of Technology is located on two campuses, one in Old Westbury, Long Island and one near Columbus Circle in Manhattan. Hofstra University is Long Island's largest private university.[223] Fordham University, also a Tier-1 university,[224] is the oldest Catholic institution of higher education in the northeastern United States,[225] and the third-oldest university in New York.[226] The New York City Department of Education is the largest school district in the United States serving over 1.2 million students.[227] The overall region also hosts many public high schools, some of which have been described as among the most prestigious in the country.[228]
Attainment
[edit]According to the 2010 American Community Survey, of the 14,973,063 persons in this area over 25 years of age, 14.8% (2,216,578) had a graduate or professional degree, 21.1% (3,166,037) had a bachelor's degree, 6.4% (962,007) had an associate degree, 16.0% (2,393,990) had some college education but no degree, 26.8% (4,009,901) had a high school diploma or equivalent, 14.8% (2,224,557) had less than a high school education.[229] In 2010, CNN Money ranked the area as one of the top 10 smartest regions in the United States.[230]
Transportation
[edit]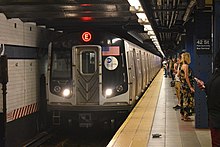


The depth and intricacy of the transportation network in the New York region parallels the size and complexity of the metropolis itself.
In 2013, the New York-Newark-Jersey City metropolitan statistical area (New York MSA) had the lowest percentage of workers who commuted by private automobile (56.9 percent), with 18.9 percent of area workers traveling via rail transit. During the period starting in 2006 and ending in 2013, the New York MSA had a 2.2 percent decline of workers commuting by automobile.[231]
Rail
[edit]About one in every three users of mass transit in the United States and two-thirds of the nation's rail riders live in the New York metropolitan area.[232][233]
New York City Subway
[edit]The New York City Subway is the largest rapid transit system in the world when measured by stations in operation, with 472, and by length of routes. In 2006 it was the third largest when measured by annual ridership (1.5 billion passenger trips in 2006),[234] However, in 2013, the subway delivered over 1.71 billion rides,[235] but slipped to being the seventh busiest rapid transit rail system in the world.[236] New York's subway is also notable because nearly the entire system remains open 24 hours a day, in contrast to the overnight shutdown common to systems in most cities, including Hong Kong,[237][238] London, Seoul,[239][240] Tokyo, and Toronto.[241]
PATH
[edit]PATH is a rapid transit system connecting the cities of Newark, Harrison, Hoboken, and Jersey City, in metropolitan northern New Jersey, with the Lower and Midtown sections of Manhattan in New York City. The PATH is operated by the Port Authority of New York and New Jersey. PATH trains run 24 hours a day and 7 days a week.[242] The system has a total route length of 13.8 mi (22.2 km), not double-counting route overlaps.[243]
Commuter rail
[edit]The metropolitan area is also fundamentally defined by the areas from which people commute into New York. The city is served by three primary commuter rail systems, and is provided intercity rail transit with Amtrak.
The Long Island Rail Road (LIRR), the busiest commuter railroad in the United States as of 2015,[244] is operated by the Metropolitan Transportation Authority (MTA), an agency of the State Government of New York that focuses on New York City-area transit). It has two major terminals at Pennsylvania Station in Midtown Manhattan and Atlantic Terminal in Downtown Brooklyn, with a minor terminal at the Long Island City station and a major transfer point at the Jamaica station in Queens.
New Jersey Transit (NJT), the second busiest commuter railroad in the United States as of 2015,[244] is operated by the New Jersey Transit Corporation, an agency of the state of New Jersey, in conjunction with Metro-North Railroad and Amtrak. It has major terminals at Pennsylvania Station in Manhattan, Hoboken Terminal, and Newark Pennsylvania Station, with a major transfer point at Secaucus Junction in Hudson County, New Jersey. New Jersey Transit also operates the Hudson–Bergen Light Rail through Hudson County, the Newark Light Rail, and the River Line that runs along tracks shared with Conrail Shared Assets Operations from Trenton to Camden in South Jersey. NJ Transit also has commuter buses operating in and out of Manhattan.
Metro-North Railroad (MNRR), the third busiest commuter railroad in the United States as of 2015,[244] is also operated by the MTA, in conjunction with the Connecticut Department of Transportation and New Jersey Transit. Its major terminal is Grand Central Terminal. Trains on the Port Jervis Line and Pascack Valley Line terminate at Hoboken Terminal in Hoboken, New Jersey; commuters may transfer at either Secaucus Junction for New Jersey Transit trains to New York Pennsylvania Station or at Hoboken Terminal for PATH trains into Manhattan.
Amtrak's Northeast Corridor offers service to Philadelphia, New Haven, and other points between and including Boston and Washington, D.C.
Major stations in the metropolitan area include:
| Station | Railroad(s) | State | County | Type |
|---|---|---|---|---|
| New York Pennsylvania Station | Amtrak, LIRR, NJT | NY | New York | Terminal and Transfer |
| Grand Central Terminal | MNRR | NY | New York | Terminal |
| Newark Pennsylvania Station | Amtrak, NJT, PATH | NJ | Essex | Transfer |
| Hoboken Terminal | NJT, MNRR, PATH | NJ | Hudson | Terminal |
| Atlantic Terminal | LIRR | NY | Kings | Terminal |
| Stamford Station | Amtrak, MNRR, Shore Line East | CT | Fairfield | Terminal and Transfer |
| Hunterspoint Avenue | LIRR | NY | Queens | Terminal |
| Woodside Station | LIRR | NY | Queens | Transfer |
| Jamaica Station | LIRR | NY | Queens | Transfer |
| Secaucus Junction | NJT, MNRR | NJ | Hudson | Transfer |
| New Haven Union Station | Amtrak, MNRR, Shore Line East, CT Rail | CT | New Haven | Terminal and Transfer |
| Trenton Station | Amtrak, NJT, SEPTA | NJ | Mercer | Terminal and Transfer |
The following table shows all train lines operated by these commuter railroads in the New York metropolitan area. New Jersey Transit operates an additional train line in the Philadelphia metropolitan area. (Shown counterclockwise from the Atlantic Ocean):
Major highways
[edit]The following highways serve the region:


Interstates
[edit]
 I-78
I-78 I-80
I-80 I-84
I-84 I-87
I-87 I-91
I-91 I-95
I-95 I-195
I-195 I-278 – serves as southern beltway around New York City
 I-280
I-280 I-287 – serves as northern beltway around New York City
 I-295
I-295- I-295 - serves as a northern partial beltway around Trenton in Mercer County, NJ
 I-478
I-478 I-495 − also known as Long Island Expressway or LIE
 I-678
I-678 I-684
I-684 I-695
I-695 I-878 – unsigned
U.S. Routes
[edit]State Routes
[edit]

 Route 3
 Route 4
 Route 8
 NY 9A
NY 9A Route 15
 Route 17
 Route 18
 Route 21
 Route 23
 Route 24
 NY 24
NY 24 Route 25
 NY 25
NY 25 Route 27
 NY 27
NY 27 Route 28
 Route 29
 Route 31
 Route 33
 Route 34
 Route 35
 Route 36
 Route 53
 Route 62
 Route 139
 Route 208
 NY 440 / Route 440
 Route 495
 NY 895
Other limited-access roads
[edit]
Some of these roads have a numerical designation assigned to it:
 Belt Parkway
 Bronx River Parkway
- Conn. Turnpike (part of I-95)
 Cross Island Parkway
 FDR Drive
 G.S. Parkway
 Grand Central Parkway
 Harlem River Drive
 Henry Hudson Parkway
 Hutchinson River Parkway
 Jackie Robinson Parkway (formerly: Interboro Parkway)
 Merritt Parkway (part of Route 15)
 N.J. Turnpike (part of I-95)
 New York Thruway (part of I-87)
 Northern State Parkway
 Palisades Parkway
 Saw Mill River Parkway
 Southern State Parkway
 Sprain Brook Parkway
 Taconic State Parkway
Named bridges and tunnels
[edit]


- Alexander Hamilton Bridge connecting the Trans-Manhattan Expressway in the Washington Heights section of Manhattan and the Cross-Bronx Expressway, as part of Interstate 95
- Basilone Bridge (part of I-95 and the New Jersey Turnpike)
- Chaplain Washington-Harry Laderman Bridge (part of I-95 and NJ Turnpike)
- Bayonne Bridge (part of NY 440 and NJ 440), underwent a $1 billion project to raise the roadway by 64 feet to 215 feet to allow taller container ships to pass underneath to access seaports in New York City and northern New Jersey.[250]
- Bear Mountain Bridge (part of US 6 and US 202)
- Bronx–Whitestone Bridge (part of I-678) – connects the boroughs of Bronx and Queens.
- Brooklyn Bridge, iconic of New York and designated a National Historic Landmark by the U.S. National Park Service on January 29, 1964.[251] Connects Brooklyn and lower Manhattan (at Park Row and City Hall).
- Brooklyn–Battery Tunnel (part of I-478), officially renamed the Hugh L. Carey Tunnel, in honor of the former New York State governor – connects Brooklyn and lower Manhattan (financial district).
- Delaware Water Gap Toll Bridge (part of I-80 crossing the Delaware River)
- Driscoll Bridge (part of the Garden State Parkway), with a total of 15 travel lanes and 6 shoulder lanes, the widest motor vehicle bridge in the world by number of lanes[252] and one of the world's busiest.
- Ed Koch Queensboro Bridge (part of NY 25) – renamed in honor of former New York Mayor Edward I. Koch, also known informally as the "59th Street Bridge". Connects Queens and the east side of Manhattan.
- George Washington Bridge (part of I-95 and US 1-9/46), the world's busiest motor vehicle bridge[245][246] and one of the world's widest, with 14 lanes.[252]
- Goethals Bridge (part of I-278)
- Great South Bay Bridge, Long Island
- Heroes Tunnel (formerly the West Rock Tunnel) (part of CT 15)
- Holland Tunnel (part of I-78 and NJ 139)
- Lincoln Tunnel (part of Route 495)
- Manhattan Bridge, connecting Brooklyn to Chinatown, Manhattan, carries four tracks of the B, D, N, and Q trains of the New York City Subway, in addition to seven lanes of traffic.
- Mid-Hudson Bridge (part of US 44 and NY 55)
- Newark Bay Bridge (part of I-78)
- New Hope – Lambertville Toll Bridge (part of US 202 crossing the Delaware River)
- Newburgh–Beacon Bridge (part of I-84 and NY 52)
- Otisville Tunnel (takes the Metro-North Railroad Port Jervis Line through the Shawangunk Ridge in Orange County, New York)
- Outerbridge Crossing (part of NY 440 and NJ 440)
- Pearl Harbor Memorial Bridge (part of I-95 and the Connecticut Turnpike)
- Poughkeepsie Bridge, also known as Walkway over the Hudson, the world's longest pedestrian bridge,[247] connecting Ulster and Dutchess counties in New York
- Pulaski Skyway (part of US 1–9)
- Queens–Midtown Tunnel (part of I-495) – connects Queens and Midtown Manhattan.
- Scudder Falls Bridge (part of I-295 crossing the Delaware River)
- Sikorsky Memorial Bridge (part of CT 15 Merritt & Wilbur Cross Parkways)
- Tappan Zee Bridge (part of I-87, I-287, and the New York State Thruway), the longest bridge in New York State; underwent a $4 billion replacement.[253]
- Thomas Alva Edison Memorial Bridge (part of US 9)
- Throgs Neck Bridge (part of I-295) – connects the boroughs of Bronx and Queens (at the western end of Long Island Sound).
- Trenton–Morrisville Toll Bridge (part of US 1)
- Triborough Bridge (part of I-278), officially renamed the Robert F. Kennedy (RFK) Bridge – connects the three boroughs of Manhattan, Bronx and Queens (hence its name).
- Verrazzano-Narrows Bridge (part of I-278), the longest suspension bridge in the Americas and one of the longest in the world (formerly the world's longest) – connects the boroughs of Staten Island and Brooklyn.[248][249]
- William A. Stickel Memorial Bridge (part of I-280)
- Williamsburg Bridge, carries 2 tracks of the J, M, and Z trains of the New York City Subway, in addition to 8 lanes of traffic – connects Williamsburg, Brooklyn, and the Lower East Side or Manhattan.
Commuter bus
[edit]New Jersey Transit, Academy Bus, Coach USA, Spanish Transportation, Trailways of New York, and several other companies operate commuter coaches into the Port Authority Bus Terminal in Manhattan, and many other bus services in New Jersey. Bus services also operate in other nearby counties in the states of New York and Connecticut, but most terminate at a subway terminal or other rail station.
Major airports
[edit]
The three busiest airports in the New York metropolitan area include John F. Kennedy International Airport, Newark Liberty International Airport, and LaGuardia Airport; 130.5 million travelers used these three airports in 2016, and the metropolitan area's airspace is the busiest in the nation.[24]
| Airport | IATA code | ICAO code | County | State |
|---|---|---|---|---|
| John F. Kennedy International Airport | JFK | KJFK | Queens | New York |
| Newark Liberty International Airport | EWR | KEWR | Essex/Union | New Jersey |
| LaGuardia Airport | LGA | KLGA | Queens | New York |
The following smaller airports are also in the metro area and provide daily commercial service:
| Airport | IATA code | ICAO code | County | State |
|---|---|---|---|---|
| Long Island MacArthur Airport | ISP | KISP | Suffolk | New York |
| Stewart International Airport | SWF | KSWF | Orange | New York |
| Trenton–Mercer Airport | TTN | KTTN | Mercer | New Jersey |
| Tweed New Haven Regional Airport | HVN | KHVN | New Haven | Connecticut |
| Westchester County Airport | HPN | KHPN | Westchester | New York |
Commuter usage
[edit]According to the 2010 American Community Survey, 54.3% (5,476,169) of commuters used a car or other private vehicle alone, 7.0% (708,788) used a carpool, 27.0% (2,721,372) used public transportation, 5.5% (558,434) walked to work, 2.0% (200,448) used some other means of transportation such as a bicycle to get to work.[254]
Culture and contemporary life
[edit]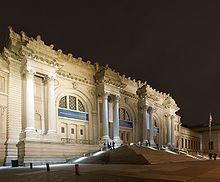
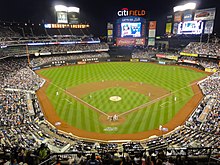


New York has been described as the cultural capital of the world by the diplomatic consulates of Iceland[264] and Latvia[265] and by New York's own Baruch College.[266] A book containing a series of essays titled New York, culture capital of the world, 1940–1965 has also been published as showcased by the National Library of Australia.[267] Tom Wolfe has quoted regarding New York's culture that "Culture just seems to be in the air, like part of the weather."[268]
Although Manhattan remains the epicenter of cultural life in the metropolitan area, the entire region is replete with prominent cultural institutions, with artistic performances and ethnically oriented events receiving international attention throughout the year.
Sports teams
[edit]The New York metropolitan area is home to the headquarters of the National Football League,[269] Major League Baseball,[270] the National Basketball Association,[271] the National Hockey League,[272] and Major League Soccer.[273] Four of the ten most expensive stadiums ever built worldwide (MetLife Stadium, the new Yankee Stadium, Madison Square Garden, and Citi Field) are located in the New York metropolitan area.[256] The New York metropolitan area has the highest total number of professional sports teams in these five leagues.
Listing of the professional sports teams in the New York metropolitan area:
- National Basketball Association (NBA)
- Brooklyn Nets (Brooklyn, New York City)
- New York Knicks (Manhattan, New York City)
- National Women's Soccer League (NWSL)
- Women's National Basketball Association (WNBA)
- New York Liberty (Brooklyn, New York City)
- Major League Baseball (MLB)
- New York Mets (Queens, New York City)
- New York Yankees (The Bronx, New York City)
- Major League Soccer (MLS)
- New York City FC (The Bronx, New York City)
- New York Red Bulls (Harrison, New Jersey)
- Minor League Baseball (MiLB)
- Eastern League (AA)
- South Atlantic League (A)
- Lakewood BlueClaws (Phillies) (Lakewood Township, New Jersey)
- Brooklyn Cyclones (Mets) (Brooklyn, New York City)
- Hudson Valley Renegades (Rays) (Fishkill, New York)
- Atlantic League of Professional Baseball (ALPB)
- Canadian American Association of Professional Baseball (CanAm League)
- National Football League (NFL)
- New York Giants (East Rutherford, New Jersey)
- New York Jets (East Rutherford, New Jersey)
- National Hockey League (NHL)
- New Jersey Devils (Newark, New Jersey)
- New York Islanders (Elmont, New York)
- New York Rangers (Manhattan, New York City)
- American Hockey League (AHL)
- Bridgeport Sound Tigers (Islanders) (Bridgeport, Connecticut)
- Major League Lacrosse (outdoor) (MLL)
- North American Rugby League (NARL)
- College Sports (NCAA Division I)
- Army Black Knights (West Point, New York)
- Columbia University Lions (Manhattan, New York City)
- Fairfield University Stags (Fairfield, Connecticut)
- Fairleigh Dickinson University Knights (Teaneck, New Jersey)
- Fordham University Rams (The Bronx, New York City)
- Hofstra University Pride (Hempstead, New York)
- Iona College Gaels (New Rochelle, New York)
- Long Island University Blackbirds (Brooklyn, New York City)
- Manhattan College Jaspers and Lady Jaspers (The Bronx, New York City)
- Marist College Red Foxes (Poughkeepsie, New York)
- Monmouth University Hawks (West Long Branch, New Jersey)
- New Jersey Institute of Technology Highlanders (Newark, New Jersey)
- Princeton University Tigers (Princeton, New Jersey)
- Quinnipiac University Bobcats (Hamden, Connecticut)
- Rider University Broncs (Lawrenceville, New Jersey)
- Rutgers University Scarlet Knights (New Brunswick, New Jersey)
- Sacred Heart University Pioneers (Fairfield, Connecticut)
- Saint Peter's University Peacocks (Jersey City, New Jersey)
- St. John's University Red Storm (Queens, New York City)
- Seton Hall University Pirates (South Orange, New Jersey)
- Stony Brook University Seawolves (Stony Brook, New York)
- Wagner College Seahawks (Staten Island, New York City)
- Yale University Bulldogs (New Haven, Connecticut)
Media
[edit]The New York metropolitan area is home to the headquarters of several well-known media companies, subsidiaries, and publications, including Thomson Reuters, The New York Times Company, the Associated Press, Warner Bros. Discovery, NBCUniversal, the Hearst Corporation, Paramount Global, News Corp, the Fox Corporation, The Wall Street Journal, Fox News, ABC, CBS, and NBC. Local television channels broadcasting to the New York market include WCBS-TV 2 (CBS), WNBC 4 (NBC), WNYW 5 (FOX), WABC-TV 7 (ABC), WWOR-TV 9 (MyNetworkTV), WPIX 11 (CW), WNET 13 (PBS), WNYE-TV 25 (NYC Media) and WPXN-TV 31 (Ion). NY1 is a 24/7 local news provider available only to cable television subscribers. Radio stations serving the area include: WNYC, WKCR, WFMU, WABC, and WFAN. Many television and radio stations use the top of the Empire State Building to broadcast their terrestrial television signals, while some media entities broadcast from studios in Times Square.
The New York metropolitan area is extensive enough so that its own channels must compete with channels from neighboring television markets (including Philadelphia, Scranton/Wilkes-Barre, and Hartford) within its outlying counties. Cable companies offer such competition in the Pennsylvania portion, Connecticut, and a few counties in central New Jersey.
Theme parks
[edit]In New Jersey
[edit]
| Главный парк | Другие парки | Расположение | Год открытия |
|---|---|---|---|
| Великое приключение Six Flags | Дикое сафари Six Flags , Харрикейн-Харбор Six Flags | Джексон | 1974 |
| Земля воображения | Никто | Надеяться | 1954 |
| Аквапарк Маунтин-Крик | Никто | Вернон | 1998 |
В штате Нью-Йорк
[ редактировать ]Кони-Айленд в Бруклине считается одним из первых парков развлечений в Америке.
Playland в городе Рай , графство Вестчестер , открыт с 1928 года.
Legoland New York в Гошене , округ Ориндж , открылся в 2021 году.
27 сентября 2012 года мэр Нью-Йорка Майкл Блумберг обнародовал планы строительства Нью-Йоркского колеса , гигантского колеса обозрения , которое будет построено на северном берегу Статен-Айленда с видом на Статую Свободы , гавань Нью-Йорка и Нижний берег . Горизонт Манхэттена . [ 276 ]
Коды городов
[ редактировать ]Район обслуживается как минимум 26 кодами города:
- 212 : Обслуживает Манхэттен и накладывается на номера 646 , 917 и 332 .
- 718 : Обслуживает все остальные районы Нью-Йорка и накладывается на номера 347 , 917 и 929 .
- 917 : обслуживает весь Нью-Йорк.
- 516 и 363 : Служить округу Нассау .
- 631 и 934 : Служить округу Саффолк .
- 914 : Служит округу Вестчестер .
- 845 : Обслуживает округа Гудзонской долины на юге штата Нью-Йорк.
- 570 и 272 : Обслуживает округ Пайк в Пенсильвании .
- 203 и 475 : Обслуживает юго-западный Коннектикут .
- 860 и 959 : обслуживают остальную часть Коннектикута, не обслуживаемую 203 или 475.
- 201 : Обслуживает большую часть округа Берген, а также части Эссекса, Гудзона и Пассаика на севере Нью-Джерси и перекрывается с 551 .
- 973 : обслуживает части Бергена, Эссекса, Гудзона, Морриса, Пассаика, Сассекса и части округа Юнион в северном Нью-Джерси и перекрывается с 862 .
- 908 : Обслуживает общины в округах Юнион, Сомерсет, северных частях округов Миддлсекс, Хантердон, Уоррен и Моррис, а также некоторые сотовые телефоны в округе Монмут в центральном Нью-Джерси.
- 732 : Обслуживает округа Миддлсекс, округ Сомерсет, части округов Юнион, Монмут и северные округа Оушен в центральном Нью-Джерси; наложено на 848 .
- 609 и 640 : обслуживает округ Мерсер и некоторые части округов Миддлсекс, Монмут и Оушен в центральном Нью-Джерси.
См. также
[ редактировать ]- Биотехнологические и фармацевтические компании в столичном регионе Нью-Йорка
- Технологические компании в агломерации Нью-Йорка
- Общественный транспорт в Нью-Йорке
- Ассоциация регионального планирования
- Транспорт в Нью-Йорке
- Округ Патнэм, Нью-Йорк
Примечания
[ редактировать ]- ^ Среднемесячные максимумы и минимумы (т.е. ожидаемые самые высокие и самые низкие значения температуры в любой момент в течение года или данного месяца), рассчитанные на основе данных в указанном месте с 1991 по 2020 год.
- ↑ Официальные наблюдения за погодой в Центральном парке проводились в Арсенале на Пятой авеню и 64-й улице с 1869 по 1919 год, а также в замке Бельведер с 1919 года. [ 55 ]
- ^ Многие места в этом списке являются городами Нью-Йорка , но часто имеют значение только определенные деревни или деревни внутри городов.
Ссылки
[ редактировать ]- ^ Джонс, Хью. «Нью-Йорк увеличивает отрыв от Лондона в индексе крупнейших финансовых центров» . Рейтер . Лондон . Архивировано из оригинала 11 июня 2022 года . Проверено 28 августа 2022 г.
- ^ «Нация бросила вызов: в Нью-Йорке; Нью-Йорк продолжает, но испытание ее стойкости только началось». Архивировано 24 марта 2020 г., в Wayback Machine , The New York Times , 11 октября 2001 г. По состоянию на 20 ноября 2016 г. «В финансовом центре мира образовалась ревущая пустота».
- ^ Соррентино, Кристофер (16 сентября 2007 г.). «Когда ему было семнадцать» . Нью-Йорк Таймс . Архивировано из оригинала 17 апреля 2009 года . Проверено 22 декабря 2007 г.
В 1980 году все еще существовали остатки различных революций в центре города, которые вдохнули новую жизнь в музыку и искусство Нью-Йорка и сохранили Манхэттен в том положении, которое он занимал с 1940-х годов как культурный центр мира.
- ^ Майкл П. Вентура (6 апреля 2010 г.). «Манхэттен может быть медиа-столицей мира, но не для пользователей iPad» . ДНКинформация . Архивировано из оригинала 4 августа 2017 года . Проверено 11 июня 2017 г.
- ^ Дон Эннис (24 мая 2017 г.). «ABC впервые будет транслировать парад гордости в Нью-Йорке в прямом эфире» . ЛГБТ-нация. Архивировано из оригинала 28 июля 2017 года . Проверено 23 апреля 2022 г.
- ^ «Профиль переписи населения: Нью-Йорк-Ньюарк-Джерси-Сити, район метро Нью-Йорк-Нью-Джерси-Пенсильвания» . Репортер переписи населения . Архивировано из оригинала 15 октября 2022 года . Проверено 14 октября 2022 г.
- ^ Перейти обратно: а б «Городские и сельские районы: список городских территорий переписи 2020 года» . Бюро переписи населения США . Проверено 22 июля 2023 г.
- ^ Перейти обратно: а б «Общая численность населения мегаполисов и микрополитенов: 2020-2023 гг.» . Бюро переписи населения США , Отдел народонаселения. 14 марта 2024 г. . Проверено 15 марта 2024 г.
- ^ «Общий валовой внутренний продукт для Нью-Йорка-Ньюарка-Джерси-Сити, Нью-Йорк-Нью-Джерси-Пенсильвания (MSA)» , Экономические данные Федеральной резервной системы , Федеральный резервный банк Сент-Луиса
- ^ Перейти обратно: а б с «Валовой внутренний продукт по округам и мегаполисам» , Экономические данные Федеральной резервной системы , Федеральный резервный банк Сент-Луиса.
- ^ «Крупнейший город мира по площади, 2023 год» . Обзор мирового населения. Архивировано из оригинала 19 января 2023 года . Проверено 19 января 2023 г.
- ^ «Крупнейшие города мира по площади» . Мировой Атлас. 7 января 2019 года. Архивировано из оригинала 18 января 2023 года . Проверено 18 января 2023 г.
Нью-Йорк часто называют крупнейшим городом в мире по площади.
- ^ «Городские территории мира» (PDF) . Демография . Апрель 2018. Архивировано (PDF) из оригинала 13 октября 2016 года . Проверено 27 апреля 2018 г.
- ^ Найл Маккарти (5 февраля 2021 г.). «Крупнейшие города мира по площади» . Гамбург: Статистика. Архивировано из оригинала 9 февраля 2021 года . Проверено 1 марта 2021 г.
- ^ «США: Объединенные мегаполисы» . CityPopulation.de. Август 2021. Архивировано из оригинала 2 апреля 2023 года . Проверено 19 ноября 2021 г.
- ^ Перейти обратно: а б «Годовые оценки постоянного населения: с 1 апреля 2010 г. по 1 июля 2015 г. - объединенная статистическая территория; и для Пуэрто-Рико - оценки численности населения на 2015 год» . Бюро переписи населения США. Архивировано из оригинала 13 февраля 2020 года . Проверено 28 марта 2016 г.
- ^ «Крупнейшие городские районы в мире [по численности городского населения]» . Ретт Батлер. 2003–2006 гг. Архивировано из оригинала 9 октября 2009 года . Проверено 25 ноября 2011 г.
- ^ «Крупнейшие города мира (по населению метро)» . Woolwine-Moen Group d/b/a Графические карты. Архивировано из оригинала 18 июня 2016 года . Проверено 25 ноября 2011 г.
- ^ «Крупнейшие городские территории в мире: 2008 г., все городские территории с населением 2 000 000 и более» (PDF) . Консультационная компания Уэнделла Кокса. Архивировано (PDF) из оригинала 1 сентября 2012 г. Проверено 25 ноября 2011 г.
- ^ Перейти обратно: а б «Ежегодник иммиграционной статистики: дополнительная таблица 2 законных постоянных жителей за 2013 г.» . Министерство внутренней безопасности США. Архивировано из оригинала 13 октября 2016 года . Проверено 31 июля 2014 г.
- ^ «Ежегодник иммиграционной статистики: дополнительная таблица 2 за 2012 г.» . Министерство внутренней безопасности США. Архивировано из оригинала 3 апреля 2013 года . Проверено 31 июля 2014 г.
- ^ «Ежегодник иммиграционной статистики: дополнительная таблица 2 за 2011 г.» . Министерство внутренней безопасности США. Архивировано из оригинала 8 августа 2012 года . Проверено 31 июля 2014 г.
- ^ «Ежегодник иммиграционной статистики: дополнительная таблица 2 за 2010 г.» . Министерство внутренней безопасности США. Архивировано из оригинала 12 июля 2012 года . Проверено 31 июля 2014 г.
- ^ Перейти обратно: а б «Отчет администрации порта Нью-Йорка и Нью-Джерси о воздушном движении за 2016 год» (PDF) . Портовое управление Нью-Йорка и Нью-Джерси. 14 апреля 2017 г. Архивировано (PDF) из оригинала 25 мая 2017 г. . Проверено 26 июня 2017 г.
- ^ «50 лучших наукоградов в области наук о жизни» . www.natureindex.com . Архивировано из оригинала 24 октября 2021 года . Проверено 26 марта 2022 г.
- ^ Перейти обратно: а б «Губернатор Хочул и мэр Адамс объявляют о плане создания SPARC Kips Bay, первого в своем роде центра трудоустройства и образования для инноваций в области здравоохранения и биологических наук» (пресс-релиз). Олбани: Управление информационных технологий штата Нью-Йорк. 13 октября 2022 года. Архивировано из оригинала 1 ноября 2022 года . Проверено 13 октября 2022 г.
- ^ «Генеральное консульство Исландии в Нью-Йорке. Культура» . Генеральное консульство Исландии в Нью-Йорке. Архивировано из оригинала 5 февраля 2013 года . Проверено 17 февраля 2013 г.
- ^ «Консульство Латвии в Нью-Йорке» . Консульство Латвии. Архивировано из оригинала 8 февраля 2013 года . Проверено 17 февраля 2013 г.
- ^ «Введение в главу 14: Культура Нью-Йорка (Нью-Йорк)» . Центр международного бизнеса Вейсмана, Колледж Баруха / CUNY, 2011. Архивировано из оригинала 5 мая 2013 года . Проверено 17 февраля 2013 г.
- ^ «Нью-Йорк, культурная столица мира, 1940–1965 / под редакцией Леонарда Уоллока; эссе Дора Эштона… [и др.]» . НАЦИОНАЛЬНАЯ БИБЛИОТЕКА АВСТРАЛИИ. Архивировано из оригинала 13 января 2013 года . Проверено 17 февраля 2013 г.
- ^ Перейти обратно: а б Хью Джонс (27 января 2020 г.). «Нью-Йорк опережает Лондон, затмеваемый Брекзитом, в сфере финансов: опрос» . Рейтер. Архивировано из оригинала 27 января 2020 года . Проверено 27 января 2020 г.
Нью-Йорк остается крупнейшим финансовым центром в мире, отодвигая Лондон на второе место, поскольку неопределенность с Брекситом подрывает отставание столицы Великобритании и азиатских центров, говорится в опросе, проведенном консультантами Duff & Phelps в понедельник.
- ^ Перейти обратно: а б с «8 крупнейших городов по ВВП: Китай против США» Business Insider, Inc., 31 июля 2011 г. Архивировано из оригинала 16 октября 2015 г. Проверено 28 октября 2015 г.
Например, Шанхай, крупнейший китайский город с самым высоким уровнем экономического производства и быстрорастущий глобальный финансовый центр, далек от того, чтобы соответствовать или превосходить Нью-Йорк, крупнейший город США и экономический и финансовый суперцентр мира.
«PAL устанавливает вводные тарифы в Нью-Йорк» . Филиппинские авиалинии . Архивировано из оригинала 27 марта 2015 года . Проверено 25 марта 2015 г. - ^ Перейти обратно: а б Ричард Флорида (8 мая 2012 г.). «Какой самый экономически мощный город в мире?» . Атлантическая ежемесячная группа. Архивировано из оригинала 18 марта 2015 года . Проверено 25 марта 2015 г.
- ^ Перейти обратно: а б Феликс Рихтер (11 марта 2015 г.). «Нью-Йорк — мировая медиа-столица» . Статистика. Архивировано из оригинала 14 июля 2017 года . Проверено 29 мая 2017 г.
- ^ Перейти обратно: а б Дон Эннис (24 мая 2017 г.). «ABC впервые будет транслировать парад гордости в Нью-Йорке в прямом эфире» . ЛГБТ-нация. Архивировано из оригинала 28 июля 2017 года . Проверено 29 мая 2017 г.
- ^ «8 крупнейших городов по ВВП: Китай против США» Business Insider, Inc., 31 июля 2011 г. Архивировано из оригинала 16 октября 2015 г. Проверено 4 февраля 2017 г.
Например, Шанхай, крупнейший китайский город с самым высоким уровнем экономического производства и быстрорастущий глобальный финансовый центр, далек от того, чтобы соответствовать или превосходить Нью-Йорк, крупнейший город США и экономический и финансовый суперцентр мира.
«PAL устанавливает вводные тарифы в Нью-Йорк» . Филиппинские авиалинии . Архивировано из оригинала 27 марта 2015 года . Проверено 4 февраля 2017 г. - ^ Перейти обратно: а б с д Ричард Флорида (3 марта 2015 г.). «Прости, Лондон: Нью-Йорк — самый экономически мощный город в мире» . Bloomberg.com . Атлантическая ежемесячная группа. Архивировано из оригинала 14 марта 2015 года . Проверено 25 марта 2015 г.
В нашем новом рейтинге «Большое Яблоко» прочно занимает первое место.
- ^ Эрин Карлайл (8 октября 2014 г.). «Нью-Йорк доминирует в списке самых дорогих почтовых индексов Америки 2014 года» . Форбс . Архивировано из оригинала 12 октября 2014 года . Проверено 12 октября 2014 г.
- ^ «Это 100 самых богатых мест Америки» . Новости Блумберга . Архивировано из оригинала 13 июня 2018 года . Проверено 11 июня 2018 г.
- ^ «Решения OMB относительно рекомендаций Комитета по рассмотрению стандартов столичных и микрополитенских статистических территорий относительно изменений в стандартах определения столичных и микрополитенских статистических территорий» . Федеральный реестр . Архивировано из оригинала 29 октября 2013 года . Проверено 8 октября 2013 г.
- ^ «Карта обозначенной рыночной зоны Нью-Йорка в формате PDF» (PDF) . Архивировано (PDF) из оригинала 22 октября 2011 г. Проверено 10 сентября 2011 г.
- ^ «Высоты и расстояния в США» . Геологическая служба США. 29 апреля 2005 года. Архивировано из оригинала 2 ноября 2006 года . Проверено 31 августа 2012 г.
- ^ Объяснение географии (см. «Изменения на рынках труда») «Объяснение географии - Департамент труда штата Нью-Йорк» . Архивировано из оригинала 10 октября 2011 года . Проверено 16 сентября 2011 г.
- ^ «Карта переписи населения» (PDF) . Архивировано из оригинала (PDF) 30 октября 2011 г.
- ^ «Метро-Северная железная дорога» . Столичное транспортное управление штата Нью-Йорк. Архивировано из оригинала 14 июля 2013 года . Проверено 27 сентября 2011 г.
- ^ Перейти обратно: а б с Пил, MC; Финлейсон, БЛ; МакМахон, Т.А. «Мировая карта климатической классификации Кеппена-Гейгера» . Университет Мельбурна. Архивировано из оригинала 30 апреля 2011 года . Проверено 3 сентября 2012 г.
- ^ Перейти обратно: а б «Польский портал New York Polonia в Нью-Йорке» . Нью-ЙоркПолония.com. Архивировано из оригинала 4 января 2013 года . Проверено 3 сентября 2012 г.
- ^ «Ежегодная карта снегопадов США» . HowStuffWorks, Inc. Архивировано из оригинала 5 июля 2012 года . Проверено 3 сентября 2012 г.
- ^ «Климат Нью-Йорка» . Климатическое управление штата Нью-Йорк. Архивировано из оригинала 12 апреля 2008 года . Проверено 3 сентября 2012 г.
- ^ [1] Архивировано 4 июля 2019 г. в Wayback Machine.
- ^ «Погодная база Нью-Йорк, Нью-Йорк» . ООО «Кэнти и партнеры». Архивировано из оригинала 16 сентября 2012 года . Проверено 3 сентября 2012 г.
- ^ Сэм Дольник (28 августа 2011 г.). «Ущерб, нанесенный Ирен, в значительной степени щадит Нью-Йорк – восстановление в пригородах Нью-Йорка идет медленнее» . Нью-Йорк Таймс . Архивировано из оригинала 13 сентября 2012 года . Проверено 3 сентября 2012 г.
- ^ «WXPART4: Среднегодовой процент возможного солнечного света в Финиксе по сравнению с другими крупными городами США» . Public.asu.edu. Архивировано из оригинала 13 января 2013 года . Проверено 26 апреля 2013 г.
- ^ «Ежегодная карта солнечного света США» . HowStuffWorks, Inc. Архивировано из оригинала 29 апреля 2011 года . Проверено 26 апреля 2013 г.
- ^ Замок Бельведер в парках Нью-Йорка
- ^ «NowData – онлайн-данные о погоде NOAA» . Национальное управление океанических и атмосферных исследований . Проверено 4 мая 2021 г.
- ^ «Сводка ежемесячных норм за 1991–2020 годы» . Национальное управление океанических и атмосферных исследований . Архивировано из оригинала 4 мая 2021 года . Проверено 4 мая 2021 г.
- ^ «Центральный парк Нью-Йорка, норма климата штата Нью-Йорк, 1961–1990 годы» . Национальное управление океанических и атмосферных исследований . Проверено 18 июля 2020 г.
- ^ Перейти обратно: а б «Нью-Йорк, Нью-Йорк, США - Ежемесячный прогноз погоды и климатические данные» . Погодный Атлас . Проверено 4 июля 2019 г.
- ^ «NowData — онлайн-данные о погоде NOAA» . Национальное управление океанических и атмосферных исследований . Архивировано из оригинала 18 января 2022 года . Проверено 11 августа 2021 г.
- ^ «Станция: Вест-Пойнт, Нью-Йорк» . Климатические нормы США 2020: Ежемесячные климатические нормы США (1991-2020 гг.) . Национальное управление океанических и атмосферных исследований. Архивировано из оригинала 11 августа 2021 года . Проверено 11 августа 2021 г.
- ^ «База погоды: Погода для Страудсбурга, Пенсильвания» . Метеорологическая база. 2011. Архивировано из оригинала 10 августа 2014 года . Проверено 14 ноября 2013 г. Проверено 22 ноября 2011 г.
- ^ «Средняя погода для Морристауна, штат Нью-Джерси – температура и осадки» . Погода.com. Архивировано из оригинала 23 октября 2012 года . Проверено 28 марта 2008 г.
- ^ Перейти обратно: а б Эдвард Робб Эллис (21 декабря 2004 г.). Эпос Нью-Йорка: повествовательная история . Основные книги. п. 594. ИСБН 9780786714360 . Архивировано из оригинала 4 апреля 2023 года . Проверено 12 декабря 2022 г.
- ^ «Предисловие к столетнему юбилею пяти районов к мини-истории Кэтрин Бемент Дэвис» . Департамент исправительных учреждений Нью-Йорка. 1997. Архивировано из оригинала 23 октября 2011 года . Проверено 26 октября 2011 г.
- ^ «Годовые оценки постоянного населения для зарегистрированных населенных пунктов с численностью населения 50 000 и более человек, ранжированных по состоянию на 1 июля 2014 г. Население: с 1 апреля 2010 г. по 1 июля 2014 г. - США - Населенные пункты с населением более 50 000 человек - оценки численности населения на 2014 г.» . Бюро переписи населения США . Архивировано из оригинала 13 февраля 2020 года . Проверено 24 мая 2015 г.
- ^ «Годовая оценка численности постоянного населения: с 1 апреля 2010 г. по 1 июля 2014–2014 гг.» . Бюро переписи населения США. Архивировано из оригинала 4 апреля 2015 года . Проверено 24 мая 2015 г.
- ^ «Землепользование города Нью-Йорка» . Город Нью-Йорк. Архивировано из оригинала 28 марта 2014 года . Проверено 27 марта 2014 г.
- ^ US-25S&-_lang=en Книга данных округов и городов: 2007 (Бюро переписи населения США), Таблица B-1, Площадь и население. Архивировано 12 февраля 2020 г., на archive.today , получено 12 июля 2008 г.
- ^ «Глобальный индекс энергетических городов 2009» (PDF) . Мемориальный фонд Мори. Архивировано (PDF) из оригинала 29 июня 2014 г. Проверено 1 июня 2012 г.
- ^ Поляк, Шира. «Приспособление к Нью-Йорку» . Солнечный страж . Архивировано из оригинала 3 декабря 2015 года . Проверено 1 ноября 2015 г.
Кроме того, динамичный образ жизни Нью-Йорка требует корректировки.
- ^ Стивен Миллер (3 октября 2016 г.). Прогулка по Нью-Йорку: размышления американских писателей от Уолта Уитмена до Теджу Коула, стр. 46, 50, 131 . Издательство Фордхэмского университета. ISBN 9780823274253 . Архивировано из оригинала 17 июля 2017 года . Проверено 10 мая 2017 г.
- ^ «Словарь - Полное определение слова НЬЮ-ЙОРКСКАЯ МИНУТА» . Мерриам-Вебстер . Архивировано из оригинала 23 сентября 2015 года . Проверено 1 ноября 2015 г.
- ^ Запланируйте свой визит. Архивировано 14 марта 2017 года в Wayback Machine , Организация Объединенных Наций . По состоянию на 9 февраля 2017 г. «Штаб-квартира Организации Объединенных Наций расположена в Нью-Йорке, на берегу Ист-Ривер. Когда вы проходите через ворота входа для посетителей Организации Объединенных Наций, вы попадаете на международную территорию. Этот участок площадью 18 акров не принадлежат не одной стране, а всем странам, которые в настоящее время присоединились к Организации, в состав Организации Объединенных Наций входят 193 государства-члена».
- ^ «Управление мэра Нью-Йорка по международным делам» . Город Нью-Йорк. Архивировано из оригинала 16 июня 2015 года . Проверено 24 июня 2015 г.
- ^ «Глобальный индекс энергетических городов 2009» (PDF) . Мемориальный фонд Мори. Архивировано (PDF) из оригинала 29 июня 2014 г. Проверено 2 августа 2014 г.
- ^ «Введение в главу 14: Культура Нью-Йорка (Нью-Йорк)» . Центр международного бизнеса Вейсмана, Колледж Баруха / CUNY, 2011. Архивировано из оригинала 5 мая 2013 года . Проверено 2 августа 2014 г.
- ^ Нью-Йорк, культурная столица мира, 1940–1965 / под редакцией Леонарда Уоллока; эссе Дора Эштона... [и др.] . НАЦИОНАЛЬНАЯ БИБЛИОТЕКА АВСТРАЛИИ. 1988. ISBN 9780847809905 . Архивировано из оригинала 13 января 2013 года . Проверено 2 августа 2014 г.
- ^ «PAL устанавливает вводные тарифы в Нью-Йорк» . Филиппинские авиалинии . Архивировано из оригинала 27 марта 2015 года . Проверено 25 марта 2015 г.
- ^ О Лонг-Айленде. Архивировано 16 мая 2015 г. на Wayback Machine , LongIsland.com.
- ^ «Годовая оценка численности постоянного населения: с 1 апреля 2010 г. по 1 июля 2015–2015 гг. Оценка численности населения» . Бюро переписи населения США. Архивировано из оригинала 13 февраля 2020 года . Проверено 28 марта 2016 г.
- ^ «Краткая информация о округе Кингс, штат Нью-Йорк» . Бюро переписи населения США. Архивировано из оригинала 17 февраля 2016 года . Проверено 28 марта 2016 г.
- ^ «Краткая информация о округе Куинс, штат Нью-Йорк» . Бюро переписи населения США. Архивировано из оригинала 8 августа 2014 года . Проверено 28 марта 2016 г.
- ^ «Краткая информация о округе Нассау, штат Нью-Йорк» . Бюро переписи населения США. Архивировано из оригинала 7 июня 2011 года . Проверено 28 марта 2016 г.
- ^ «Краткая информация о округе Саффолк, штат Нью-Йорк» . Бюро переписи населения США. Архивировано из оригинала 29 июля 2011 года . Проверено 28 марта 2016 г.
- ^ [2] Архивировано 14 февраля 2020 г., на archive.today. Доступ 21 июля 2017 г.
- ^ Кристин Ким; Спрос на СМИ. «Куинс, Нью-Йорк, Достопримечательности» . США СЕГОДНЯ . Архивировано из оригинала 16 июня 2016 года . Проверено 23 июня 2014 г.
- ^ Эндрю Вебер (30 апреля 2013 г.). «Королевы» . Нью-Йорк.com. Архивировано из оригинала 13 мая 2015 года . Проверено 23 июня 2014 г.
- ^ «Краткие сведения о городе Хемпстед, округ Нассау, штат Нью-Йорк» . Архивировано из оригинала 1 октября 2023 года . Проверено 5 июля 2017 г.
- ^ [3] Архивировано 8 августа 2015 г. на Wayback Machine, по состоянию на 8 августа 2015 г.
- ^ «Часто задаваемые вопросы» . Печатные платы реки Гудзон . Нью-Йорк, штат Нью-Йорк: Агентство по охране окружающей среды США. Архивировано из оригинала 21 ноября 2011 года . Проверено 29 сентября 2011 г.
- ^ Марк Дж. Мадьяр (8 ноября 2011 г.). «Национальный парк Патерсон-Грейт-Фолс: больше, чем пейзажи» . njSPOTLIGHT. Архивировано из оригинала 17 января 2013 года . Проверено 2 сентября 2012 г.
- ^ «Программа национальных исторических достопримечательностей - Дом на озере Мохонк» . Служба национальных парков. Архивировано из оригинала 10 ноября 2013 года . Проверено 3 сентября 2012 г.
- ^ «Краткая информация о округе Пайк, штат Пенсильвания» . Бюро переписи населения США. Архивировано из оригинала 6 июня 2011 года . Проверено 11 сентября 2012 г.
- ^ «Администрация суда округа Пайк, Пенсильвания» . Комиссары округа Пайк. Архивировано из оригинала 6 февраля 2013 года . Проверено 11 сентября 2012 г.
- ^ Дэвид Пирс (25 июня 2010 г.). «Население увеличивается в округах Пайк, Монро» . Рекорд Поконо. Архивировано из оригинала 11 марта 2012 года . Проверено 11 сентября 2012 г.
- ^ «Программа национальных исторических достопримечательностей - Зеленый исторический район Нью-Хейвена» . Служба национальных парков. Архивировано из оригинала 1 июля 2019 года . Проверено 3 сентября 2012 г.
- ^ «Город Патерсон – Шелковый город» . Архивировано из оригинала 9 ноября 2013 года . Проверено 2 апреля 2013 г.
- ^ «Краткая история перуанской иммиграции в США» . yumimmigratorcity.com. Архивировано из оригинала 31 июля 2013 года . Проверено 20 апреля 2013 г.
- ^ Джо Малинконико и Чарли Кратовил (9 мая 2012 г.). «Бенгальская община Патерсона гордится неудачной победой Ахтаруззамана» . Альтернативная пресса . Архивировано из оригинала 14 мая 2013 года . Проверено 20 апреля 2013 г.
- ^ «Краткая информация о Бюро переписи населения США» . Бюро переписи населения США . 1 апреля 2020 года. Архивировано из оригинала 6 февраля 2021 года . Проверено 25 ноября 2023 г.
- ^ «Список городских территорий переписи 2020 года» . Бюро переписи населения США. Архивировано из оригинала 14 января 2023 года . Проверено 7 января 2023 г.
- ^ «О ленапе» . [Ленапе Lifeways]. Архивировано из оригинала 14 мая 2012 года . Проверено 8 сентября 2012 г.
- ^ Перейти обратно: а б «История США - История Нью-Йорка, Нью-Йорк» . Архивировано из оригинала 8 сентября 2012 года . Проверено 9 сентября 2012 г.
- ^ Шорто, Рассел (2005). Остров в центре мира, 1-е издание . Нью-Йорк: Винтажные книги. п. 30. ISBN 1-4000-7867-9 .
- ^ «Понимание чтения в колонии Нью-Джерси» . MrNussbaum.com. Архивировано из оригинала 24 октября 2012 года . Проверено 9 сентября 2012 г.
- ^ «КИНГСТОН Откройте для себя 300-летнюю историю Нью-Йорка ГОЛЛАНДСКИЕ КОЛОНИИ» . Служба национальных парков Министерства внутренних дел США. Архивировано из оригинала 23 ноября 2008 года . Проверено 9 сентября 2012 г.
- ^ «Девять столиц США» . Сенат США . Архивировано из оригинала 20 марта 2016 года . Проверено 9 сентября 2012 г.
- ^ «Рейтинг 100 крупнейших городских населенных пунктов по численности населения, перечисленных в алфавитном порядке по штатам: 1790–1990» . Бюро переписи населения США. 15 июня 1998 года. Архивировано из оригинала 12 октября 2012 года . Проверено 9 сентября 2012 г.
- ^ "Статуя Свободы" . Всемирное наследие . ЮНЕСКО. Архивировано из оригинала 28 августа 2012 года . Проверено 31 августа 2012 г.
- ^ "Статуя Свободы" . Телевизионные сети A&E. Архивировано из оригинала 23 сентября 2012 года . Проверено 9 сентября 2012 г.
- ^ "Статуя Свободы" . Всемирное наследие . Центр всемирного наследия ЮНЕСКО. Архивировано из оригинала 24 октября 2011 года . Проверено 23 октября 2011 г.
- ^ «Предисловие к столетнему юбилею пяти районов к мини-истории Кэтрин Бемент Дэвис» . Департамент исправительных учреждений Нью-Йорка. 1997. Архивировано из оригинала 23 октября 2011 года . Проверено 2 сентября 2012 г.
- ^ «Нью-Йорк: город кварталов» . Департамент городского планирования Нью-Йорка. Архивировано из оригинала 15 сентября 2012 года . Проверено 2 сентября 2012 г.
- ^ Мартин З. Браун и Фриман Клопотт (26 ноября 2012 г.). «Bloomberg просит помощи в размере 9,8 миллиарда долларов в связи с потерями Нью-Йорка из-за урагана Сэнди» . Блумберг. Архивировано из оригинала 28 ноября 2012 года . Проверено 27 ноября 2012 г.
- ^ Джефф Стоун и Мария Галлуччи (29 октября 2014 г.). «Годовщина урагана «Сэнди» в 2014 году: укрепление Нью-Йорка – насколько хорошо мы защищены от следующего суперурагана?» . Интернэшнл Бизнес Таймс . Архивировано из оригинала 24 июля 2015 года . Проверено 23 июля 2015 г.
- ^ Роберт С. Эшельман (15 ноября 2012 г.). «АДАПТАЦИЯ: Начинает формироваться политическая поддержка морской дамбы в гавани Нью-Йорка» . Э&Э Паблишинг, ООО. Архивировано из оригинала 5 февраля 2013 года . Проверено 23 июля 2015 г.
- ^ «Куинс: опыт Нью-Йорка» . Город Нью-Йорк. 16 февраля 2011. Архивировано из оригинала 4 мая 2012 года . Проверено 7 сентября 2012 г.
- ^ Шенклер, Майкл. «Мы — нация иммигрантов» . Квинс Трибьюн . Архивировано из оригинала 11 мая 2008 года . Проверено 7 сентября 2012 г.
- ^ «Объединенные статистические районы, 2013 г.» (PDF) . Архивировано из оригинала (PDF) 21 июля 2014 года . Проверено 28 октября 2013 г.
- ^ БЮЛЛЕТЕНЬ OMB №. 18-04: Пересмотренные границы городских статистических территорий, микрополитических статистических территорий и комбинированных статистических территорий, а также Руководство по использованию границ этих территорий. Архивировано 4 марта 2020 года в Wayback Machine . Управление управления и бюджета. 14 сентября 2018 г.
- ^ Кэмпбелл, Джон. «Северная часть штата, нижняя часть штата: почему усилия по отделению Нью-Йорка не увенчались успехом» . Рочестерский демократ и хроника . Архивировано из оригинала 1 ноября 2020 года . Проверено 1 марта 2020 г.
- ^ Перейти обратно: а б с «Разделить Нью-Йорк на два штата? Законодатель северной части штата Нью-Йорк хочет изучить идею» . Сиракузы . Прогресс Медиа Нью-Йорк. 25 февраля 2019 года. Архивировано из оригинала 8 октября 2019 года . Проверено 29 августа 2019 г.
- ^ Перейти обратно: а б Кирни, Брент (11 марта 2019 г.). «Должен ли Нью-Йорк быть разделен на три отдельных региона?» . ВКТВ . Хартленд Медиа . Архивировано из оригинала 29 августа 2019 года . Проверено 29 августа 2019 г.
- ^ Перейти обратно: а б с д Микелионис, Лукас (8 марта 2019 г.). «Сломать власть либералов в Нью-Йорке, разделив штат на 3 региона, предлагает республиканец» . Фокс Ньюс . Архивировано из оригинала 29 августа 2019 года . Проверено 29 августа 2019 г.
- ^ Линге, Мэри Кей (6 апреля 2019 г.). «Нью-йоркский законопроект предлагает разделить Эмпайр-Стейт на три округа» . Нью-Йорк Пост . Архивировано из оригинала 29 августа 2019 года . Проверено 29 августа 2019 г.
- ^ Линге, Мэри Кей (6 апреля 2019 г.). «Нью-йоркский законопроект предлагает разделить Эмпайр-Стейт на три округа» . Нью-Йорк Пост . Архивировано из оригинала 29 августа 2019 года . Проверено 1 марта 2020 г.
- ^ «Нью-Нью-Йорк? Законодатель предлагает превратить Нью-Йорк и Лонг-Айленд в собственный штат» . CBS местный . 23 февраля 2019 года. Архивировано из оригинала 24 августа 2019 года . Проверено 1 марта 2020 г.
- ^ Кинири, Лаура. «Лунные справочники, Нью-Джерси», Avalon Travel Publishing, 2006. стр. 34 ISBN 1-56691-949-5 . Проверено 10 апреля 2015 г.
- ^ Лариса Вирстюк (21 апреля 2014 г.). «В центре внимания района: Журнальная площадь» . Джерси-Сити Индепендент . Архивировано из оригинала 30 июня 2018 года . Проверено 24 мая 2015 г.
- ^ «Район Палисейд-Парк, Нью-Джерси QuickLinks» . Бюро переписи населения США. Архивировано из оригинала 13 мая 2014 года . Проверено 8 августа 2014 г.
- ^ Кирк Семпл (18 мая 2012 г.). «В Нью-Джерси Мемориал «Женщинам для утешения» усугубляет старую враждебность» . Нью-Йорк Таймс . Архивировано из оригинала 29 мая 2019 года . Проверено 24 мая 2015 г.
- ^ Перейти обратно: а б Вивиан Йи (22 февраля 2015 г.). «Обвинение офицеру Нью-Йорка разделяет американцев китайского происхождения» . Нью-Йорк Таймс . Архивировано из оригинала 24 февраля 2015 года . Проверено 23 февраля 2015 г.
- ^ Перейти обратно: а б «Китайский Новый год 2012 во Флашинге» . QueensBuzz.com. 25 января 2012. Архивировано из оригинала 26 мая 2013 года . Проверено 18 июля 2014 г.
- ^ Форстолл, Ричард Л., изд. (27 марта 1995 г.). «Население округов по данным десятилетней переписи: 1900–1990 годы» . Бюро переписи населения США. Архивировано из оригинала 18 июля 2015 года . Проверено 9 августа 2015 г.
- ^ Бюро переписи населения США. «Сайт переписи населения США» . Бюро переписи населения США . Архивировано из оригинала 27 декабря 1996 года . Проверено 10 августа 2015 г.
- ^ [4] Архивировано 9 августа 2017 г., в Wayback Machine , Шульц, Дана (29 ноября 2017 г.). «История рождественской елки Рокфеллер-центра, праздничной традиции Нью-Йорка». 6 кв. футов.
- ^ Перейти обратно: а б Гэри Дж. Гейтс. «Однополые пары и население геев, лесбиянок и бисексуалов: новые оценки исследования американского сообщества» (PDF) . Институт сексуальной ориентации Уильямса. Архивировано из оригинала (PDF) 9 июня 2013 года . Проверено 7 декабря 2013 г.
- ^ Перейти обратно: а б Брайан Сильверман и Келси Шовен (2013). Нью-Йорк Фроммера, 2013 год . Уайли. ISBN 9781118331446 . Архивировано из оригинала 6 сентября 2015 года . Проверено 24 марта 2015 г.
- ^ Кирк Семпл (23 июня 2011 г.). «Азиатские жители Нью-Йорка стремятся к власти, чтобы соответствовать цифрам» . Нью-Йорк Таймс . Архивировано из оригинала 27 июня 2011 года . Проверено 5 июля 2011 г.
Азиаты, группа, которую чаще всего ассоциируют с Западным побережьем, набирают силу в Нью-Йорке, где они уже давно затмеваются в калейдоскопическом расовом и этническом составе города. Впервые, согласно данным переписи населения, опубликованным весной, их число превысило один миллион — почти каждый восьмой житель Нью-Йорка — что больше, чем азиатское население в городах Сан-Франциско и Лос-Анджелес вместе взятых.
- ^ «Азиатско-американская статистика» . Амередия Инкорпорейтед. Архивировано из оригинала 14 июля 2011 года . Проверено 5 июля 2011 г.
- ^ Кристин Ким; Спрос на СМИ. «Куинс, Нью-Йорк, Достопримечательности» . США СЕГОДНЯ . Архивировано из оригинала 16 июня 2016 года . Проверено 18 июля 2014 г.
- ^ Эндрю Вебер (30 апреля 2013 г.). «Королевы» . Нью-Йорк.com. Архивировано из оригинала 13 мая 2015 года . Проверено 18 июля 2014 г.
- ^ «Краткие сведения о штатах и округах, округ Нассау, штат Нью-Йорк, QuickLinks» . Бюро переписи населения США. Архивировано из оригинала 7 октября 2014 года . Проверено 18 июля 2014 г.
- ^ Хэн Шао (10 апреля 2014 г.). «Присоединяйтесь к Великому Гэтсби: китайские покупатели недвижимости устремляются на северный берег Лонг-Айленда» . Форбс . Архивировано из оригинала 8 августа 2014 года . Проверено 2 августа 2014 г.
- ^ Перейти обратно: а б с «Ежегодник иммиграционной статистики: дополнительная таблица 2 за 2011 г.» . Министерство внутренней безопасности США. Архивировано из оригинала 8 августа 2012 года . Проверено 18 июля 2014 г.
- ^ «Ежегодник иммиграционной статистики: дополнительная таблица 2 законных постоянных жителей за 2013 г.» . Министерство внутренней безопасности США. Архивировано из оригинала 13 октября 2016 года . Проверено 18 июля 2014 г.
- ^ «Ежегодник иммиграционной статистики: дополнительная таблица 1 законных постоянных жителей за 2013 г.» . Министерство внутренней безопасности США. Архивировано из оригинала 13 октября 2016 года . Проверено 18 июля 2014 г.
- ^ «Ежегодник иммиграционной статистики: дополнительная таблица 2 за 2012 г.» . Министерство внутренней безопасности США. Архивировано из оригинала 3 апреля 2013 года . Проверено 18 июля 2014 г.
- ^ «Ежегодник иммиграционной статистики: дополнительная таблица 2 за 2010 г.» . Министерство внутренней безопасности США. Архивировано из оригинала 12 июля 2012 года . Проверено 24 февраля 2013 г.
- ^ Джон Марзулли (9 мая 2011 г.). «Малазийец переправил нелегальных китайских иммигрантов в Бруклин с помощью «Куин Мэри-2»: власти» . Нью-Йорк Дейли Ньюс . Нью-Йорк. Архивировано из оригинала 5 мая 2015 года . Проверено 24 февраля 2013 г.
- ^ «Сайт переписи населения США» . Бюро переписи населения США. Архивировано из оригинала 27 декабря 1996 года . Проверено 19 июля 2014 г.
- ^ Космологии кредита: транснациональная мобильность и политика назначения в Китае, 2010, Джули Ю. Чу
- ^ Перейти обратно: а б «Наиболее важные недостигнутые сообщества групп людей в метро Нью-Йорка» . ГЛОБАЛЬНЫЕ ВОРОТА. 17 июля 2012. Архивировано из оригинала 27 октября 2014 года . Проверено 27 октября 2014 г.
- ^ «Таблица SF1-P9 Нью-Йорка: Общая численность населения Азии по выбранным подгруппам» (PDF) . NYC.gov. Архивировано из оригинала (PDF) 5 мая 2012 года . Проверено 27 августа 2011 г.
- ^ «Краткая информация о округе Куинс, штат Нью-Йорк» . Бюро переписи населения США. Архивировано из оригинала 8 августа 2014 года . Проверено 13 августа 2014 г.
- ^ Джон Ролек. «Растущий китайский квартал в Элмхерсте» . О сайте.com. Архивировано из оригинала 11 июля 2014 года . Проверено 13 августа 2014 г.
- ^ Бут, Эмилия (31 августа 2017 г.). «Иммиграция из Вест-Индии и карнавал: приезжаем в Бруклин» . Бруклинология . Автор: Джен Хойер. Бруклинская публичная библиотека . Архивировано из оригинала 3 декабря 2022 года . Проверено 6 октября 2023 г.
- ^ «Американский FactFinder – Результаты» . Министерство торговли США. Архивировано из оригинала 12 февраля 2020 года . Проверено 8 октября 2014 г.
- ^ Перейти обратно: а б «Латиноамериканцы или латиноамериканцы по типу: 2010 г.» . Бюро переписи населения США . Проверено 8 октября 2014 г. [ постоянная мертвая ссылка ]
- ^ «Американский FactFinder – Результаты» . Бюро переписи населения США. Архивировано из оригинала 16 марта 2015 года . Проверено 8 октября 2014 г.
- ^ «Сообщество многих миров: американцы арабского происхождения в Нью-Йорке» . Allied Media Corp. Архивировано из оригинала 8 ноября 2014 года . Проверено 9 октября 2014 г.
- ^ «Ежегодник иммиграционной статистики: дополнительная таблица 2 законных постоянных жителей за 2013 г.» . Министерство внутренней безопасности США. Архивировано из оригинала 13 октября 2016 года . Проверено 19 июля 2014 г.
- ^ Надеж Рагару и Амильда Дюми. «Албанско-американское сообщество в Соединенных Штатах: диаспора становится видимой» (PDF) . Архивировано (PDF) из оригинала 22 августа 2014 г. Проверено 29 июля 2014 г.
- ^ Ян Гордон; Тони Трэверс; и Кристин Уайтхед (июль 2007 г.). «Влияние недавней иммиграции на экономику Лондона» (PDF) . Корпорация Лондонского Сити. Архивировано (PDF) из оригинала 3 ноября 2013 г. Проверено 8 сентября 2013 г.
- ^ Муслимани, Мохамад; Тамир, Кристина; Будиман, Эбби; Ноэ-Бустаманте, Луис; Мора, Лорен (18 января 2024 г.). «Факты о чернокожем населении США» . Исследовательский центр Пью . Проверено 14 августа 2024 г.
- ^ «Ежегодник иммиграционной статистики: дополнительная таблица 2 за 2012 г.» . Министерство внутренней безопасности США. Архивировано из оригинала 3 апреля 2013 года . Проверено 2 апреля 2013 г.
- ^ «Ежегодник иммиграционной статистики: дополнительная таблица 2 за 2011 г.» . Министерство внутренней безопасности США. Архивировано из оригинала 8 августа 2012 года . Проверено 26 апреля 2012 г.
- ^ «Ежегодник иммиграционной статистики: дополнительная таблица 2 за 2010 г.» . Министерство внутренней безопасности США. Архивировано из оригинала 12 июля 2012 года . Проверено 26 апреля 2012 г.
- ^ «Ежегодник иммиграционной статистики: дополнительная таблица 2 за 2009 г.» . Министерство внутренней безопасности США. Архивировано из оригинала 8 августа 2012 года . Проверено 26 апреля 2012 г.
- ^ «Профиль общих характеристик населения и жилья: география данных демографического профиля за 2010 год: Нью-Йорк-Ньюарк-Бриджпорт, Нью-Йорк-Нью-Джерси-Коннектикут-Пенсильвания, CSA» . Архивировано из оригинала 12 февраля 2020 года . Проверено 2 сентября 2012 г.
- ^ «Профиль общих характеристик населения и жилья: география данных демографического профиля 2010 года: Соединенные Штаты» . Бюро переписи населения США. Архивировано из оригинала 27 декабря 1996 года . Проверено 2 сентября 2012 г.
- ^ Кирк Семпл (23 июня 2011 г.). «Азиатские жители Нью-Йорка стремятся к власти, чтобы соответствовать цифрам» . Нью-Йорк Таймс . Архивировано из оригинала 19 декабря 2014 года . Проверено 2 сентября 2012 г.
- ^ «ИЗБРАННЫЙ ПРОФИЛЬ НАСЕЛЕНИЯ В СОЕДИНЕННЫХ ШТАТАХ - оценки американского сообщества 2014 г., оценки за 1 год Нью-Йорк-Ньюарк-Бриджпорт, Нью-Йорк-Нью-Джерси-Коннектикут-Пенсильвания CSA - только китайцы» . Бюро переписи населения США. Архивировано из оригинала 14 февраля 2020 года . Проверено 29 августа 2016 г.
- ^ «Лица, получившие законный статус постоянного жителя по ведущим основным статистическим территориям (CBSA) проживания, региону и стране рождения: 2013 финансовый год» . Министерство внутренней безопасности США. Архивировано из оригинала 1 мая 2015 года . Проверено 6 марта 2015 г.
- ^ Питер Минкофф (5 апреля 2018 г.). «Нью-Йорк – гей-столица мира» . Ваш голос ЛГБТК+. Архивировано из оригинала 4 января 2023 года . Проверено 4 января 2023 г.
- ^ Николас Исповедник и Майкл Барбаро (24 июня 2011 г.). «Нью-Йорк разрешает однополые браки, став крупнейшим штатом, принявшим закон» . Компания Нью-Йорк Таймс. Архивировано из оригинала 9 февраля 2014 года . Проверено 2 сентября 2012 г.
- ^ «Гуляки выходят на улицы на 48-й ежегодный марш гордости Нью-Йорка» . CBS Нью-Йорк. 25 июня 2017 года. Архивировано из оригинала 28 июня 2017 года . Проверено 3 июля 2017 г.
Море радуги окутало Большое Яблоко во время крупнейшего в мире парада гордости в воскресенье.
- ^ Симона Вайхзельбаум (26 июня 2012 г.). «По данным нового исследования, почти каждый четвертый житель Бруклина — еврей» . Нью-Йорк Дейли Ньюс . Архивировано из оригинала 4 июля 2018 года . Проверено 30 мая 2013 г.
- ^ «Самый большой крытый Будда в Западном полушарии» . RoadsideAmerica.com . Архивировано из оригинала 15 ноября 2015 года . Проверено 27 октября 2015 г.
- ↑ Исследовательский центр Pew, «Исследование религиозного ландшафта: район метро Нью-Йорка». Архивировано 24 октября 2016 г., в Wayback Machine.
- ↑ Веб-сайт Fortune 500 (города). Архивировано 24 августа 2011 г. на Wayback Machine , получено 21 июля 2011 г.; Фортуна , Том. 163, нет. 7 (23 мая 2011 г.), стр. F-45
- ^ Уайлд, Кэтрин (23 января 2006 г.). «Поддержание роста экономики» . Готэмская газета. Архивировано из оригинала 6 октября 2008 года . Проверено 24 марта 2015 г.
- ^ Ричард Флорида (8 мая 2012 г.). «Какой самый экономически мощный город в мире?» . Атлантическая ежемесячная группа. Архивировано из оригинала 18 марта 2015 года . Проверено 22 ноября 2012 г.
- ^ Перейти обратно: а б «Справочник листингов Нью-Йоркской фондовой биржи» . Архивировано из оригинала 21 июня 2013 года . Проверено 27 октября 2014 г.
- ^ Перейти обратно: а б с «Основные события рынка WFE за 2013 год» (PDF) . Всемирная федерация бирж. Архивировано из оригинала (PDF) 27 марта 2014 года . Проверено 27 октября 2014 г.
- ^ Карим Лахлу. «Стартапы переезжают в совместные офисы на фоне высоких цен на недвижимость» . Мидтаун Газетт. Архивировано из оригинала 21 августа 2014 года . Проверено 27 октября 2014 г.
- ^ «8 крупнейших городов по ВВП: Китай против США» Business Insider, Inc., 31 июля 2011 г. Архивировано из оригинала 5 февраля 2013 г. Проверено 22 июня 2014 г.
- ^ Джон Гловер (23 ноября 2014 г.). «Нью-Йорк повышает преимущество Лондона как ведущего финансового центра» . Bloomberg LP Архивировано из оригинала 12 января 2015 года . Проверено 25 марта 2015 г.
- ^ «UBS может переместить американский инвестиционный банк в Нью-Йорк» . e-Eighteen.com Ltd., 10 июня 2011 г. Архивировано из оригинала 26 января 2012 г. . Проверено 25 марта 2015 г.
- ^ «Индекс мировых финансовых центров 17» (PDF) . Длинные финансы. 23 марта 2015 г. Архивировано из оригинала (PDF) 14 апреля 2015 г. . Проверено 25 марта 2015 г.
- ^ Томас П. ДиНаполи (контролер штата Нью-Йорк) и Кеннет Б. Блейвас (заместитель контролера штата Нью-Йорк) (октябрь 2013 г.). «Индустрия ценных бумаг в Нью-Йорке» (PDF) . Архивировано (PDF) из оригинала 22 августа 2014 г. Проверено 30 июля 2014 г.
- ^ «Что такое офисный кондоминиум?» . Группа свойств руля направления. Архивировано из оригинала 29 сентября 2010 года . Проверено 28 мая 2013 г.
- ^ «Понимание рынка офисных помещений Манхэттена» . Officespaceseeker.com. Архивировано из оригинала 13 июля 2014 года . Проверено 18 мая 2013 г.
- ^ «Отчет офиса КБР Marketbeat в США за 2 квартал 2011 г.» (PDF) . Cushman & Wakefield, Inc. Архивировано из оригинала (PDF) 8 мая 2013 года . Проверено 18 мая 2013 г.
- ^ Амберин Чоудхури, Элиза Мартинуцци и Бен Мошински (26 ноября 2012 г.). «Лондонские банкиры готовятся к более низким бонусам, чем в Нью-Йорке» . Bloomberg LP Архивировано из оригинала 4 августа 2014 года . Проверено 20 июля 2014 г.
- ^ Санат Валликаппен (10 ноября 2013 г.). «Повышение заработной платы банковским специалистам по рискам в Азии, Трамп, Нью-Йорк» . Bloomberg LP Архивировано из оригинала 4 августа 2014 года . Проверено 20 июля 2014 г.
- ^ Дэвид Энрич; Джейкоб Бунге и Касселл Брайан-Лоу (9 июля 2013 г.). «NYSE Euronext примет на себя Libor» . Уолл Стрит Джорнал . Архивировано из оригинала 19 октября 2013 года . Проверено 10 июля 2013 г.
- ^ Ронда Кайсен (15 августа 2013 г.). «Жители Нью-Йорка открывают Джерси-Сити» . Нью-Йорк Таймс . Архивировано из оригинала 11 августа 2014 года . Проверено 1 августа 2014 г.
- ^ Меган Роуз Дики и Джиллиан Д'Онфро (24 октября 2013 г.). «SA 100 2013: Самые крутые люди в технологическом институте Нью-Йорка» . Бизнес-инсайдер . Архивировано из оригинала 22 июля 2014 года . Проверено 30 июля 2014 г.
- ^ Мэтт Флегенхаймер (23 марта 2016 г.). «Тед Круз сожалеет о «либеральных, левых ценностях», лоббируя голоса в Нью-Йорке» . Нью-Йорк Таймс . Архивировано из оригинала 13 апреля 2016 года . Проверено 22 апреля 2016 г.
- ^ «Последние новости: Китай надеется, что США быстро присоединятся к соглашению по климату» . Нью-Йорк Таймс . Ассошиэйтед Пресс. 22 апреля 2016. Архивировано из оригинала 3 мая 2016 года . Проверено 22 апреля 2016 г.
- ^ Лиза Фодераро (21 сентября 2014 г.). «Выносим на улицы призыв к изменению климата» . Нью-Йорк Таймс . Архивировано из оригинала 26 мая 2015 года . Проверено 22 апреля 2016 г.
- ^ «Телекоммуникации и экономическое развитие в Нью-Йорке: План действий» (PDF) . Корпорация экономического развития Нью-Йорка. Март 2005 г. Архивировано из оригинала (PDF) 4 марта 2006 г. . Проверено 29 июля 2014 г.
- ^ Иван Перейра (10 декабря 2013 г.). «Город открывает крупнейшую в стране зону непрерывного Wi-Fi в Гарлеме» . amNewYork/Ньюсдей. Архивировано из оригинала 12 августа 2014 года . Проверено 29 июля 2014 г.
- ^ Джон Бродкин (9 июня 2014 г.). «Verizon пропустит срок для подключения всего Нью-Йорка к FiOS» . Конде Наст. Архивировано из оригинала 10 августа 2014 года . Проверено 30 июля 2014 г.
- ^ РИЧАРД ПЕРЕС-ПЕНЬЯ (19 декабря 2011 г.). «Выпускник Корнеллского университета стоит за подарком в 350 миллионов долларов на строительство научной школы в городе» . Нью-Йорк Таймс . Архивировано из оригинала 19 декабря 2014 года . Проверено 1 августа 2014 г.
- ^ Джу, Энн (19 декабря 2011 г.). « Технический кампус, меняющий правила игры, переходит в Корнелл, Технион» . Корнелльский университет. Архивировано из оригинала 1 сентября 2015 года . Проверено 1 августа 2014 г.
- ^ Моррис, Кейко (28 июля 2014 г.). «Разыскиваются: биотехнологические стартапы в Нью-Йорке: Александрийский центр наук о жизни надеется на расширение» . Уолл Стрит Джорнал . Архивировано из оригинала 1 августа 2014 года . Проверено 1 августа 2014 г.
- ^ Джон Джордан (январь 2016 г.). «Проект стоимостью 1,2 миллиарда долларов может сделать Вестчестер центром биотехнологий» . Ассоциация риэлторов Hudson Gateway. Архивировано из оригинала 24 апреля 2016 года . Проверено 9 апреля 2016 г.
- ^ Стив Дитли (7 мая 2015 г.). «Неожиданная мощная позиция Вестчестера в биотехнологической отрасли. Спустя четыре года после нашего первого взгляда на биотехнологическую отрасль Вестчестера, этот сектор превратился из молодого в гиганта» . Сегодня СМИ. Архивировано из оригинала 16 апреля 2016 года . Проверено 7 апреля 2016 г.
Вокруг видны признаки цветения биочестера:
- ^ «Ежемесячные объемы грузов портов Нью-Йорка и Нью-Джерси» . Портовое управление Нью-Йорка и Нью-Джерси. Архивировано из оригинала 16 декабря 2022 года . Проверено 10 декабря 2022 г.
- ^ Ванесса Юркевич (9 декабря 2022 г.). «Самый загруженный порт Америки больше не находится на Западном побережье» . Си-Эн-Эн. Архивировано из оригинала 11 декабря 2022 года . Проверено 11 декабря 2022 г.
- ^ «Текущий уровень водохранилища» . Департамент охраны окружающей среды Нью-Йорка. Архивировано из оригинала 7 июля 2016 года . Проверено 4 июля 2016 г.
- ^ Люстгартен, Абрам (6 августа 2008 г.). «Питьевая вода города находится под угрозой исчезновения; затраты оцениваются в 10 миллиардов долларов» . Нью-Йорк Сан . Архивировано из оригинала 20 августа 2016 года . Проверено 4 июля 2016 г.
- ^ Данлэп, Дэвид В. (23 июля 2014 г.). «Тихая веха в проекте по возвращению кротоновой воды в Нью-Йорк» . Нью-Йорк Таймс . Архивировано из оригинала 17 июля 2016 года . Проверено 4 июля 2016 г.
- ^ Флегенхаймер, Мэтт (16 октября 2013 г.). «Спустя десятилетия водный туннель теперь может обслуживать весь Манхэттен» . Нью-Йорк Таймс . Архивировано из оригинала 17 июля 2016 года . Проверено 4 июля 2016 г.
- ^ Джим Дуайер (6 апреля 2016 г.). «Де Блазио добавляет деньги на строительство водного туннеля в Бруклине и Квинсе» . Нью-Йорк Таймс . Архивировано из оригинала 17 июля 2016 года . Проверено 4 июля 2016 г.
- ^ «Национальный рейтинг университетов» . Новости США и мировой отчет . Архивировано из оригинала 21 мая 2011 года . Проверено 27 марта 2018 г.
- ^ «Список школ Лиги плюща» . Обзор университета. Архивировано из оригинала 4 октября 2013 года . Проверено 10 сентября 2013 г.
- ^ «Академический рейтинг университетов мира 2013» . Шанхайское рейтинговое консалтинговое агентство. Архивировано из оригинала 27 сентября 2017 года . Проверено 10 сентября 2013 г.
- ↑ Крупнейшие колледжи. Архивировано 6 сентября 2015 г. на Wayback Machine , rich.com.
- ^ «Краткий обзор Хофстры - Университет Хофстра, Нью-Йорк» . www.hofstra.edu . Архивировано из оригинала 30 января 2017 года . Проверено 17 февраля 2017 г.
- ^ «Фордхемский университет» . Новости США и мировой отчет . Архивировано из оригинала 28 сентября 2013 года . Проверено 2 октября 2013 г.
- ^ Куриан, Джордж Томас; Лэмпорт, Марк А. (ред.) (2015). Энциклопедия христианского образования. 3. Роуман и Литтлфилд. ISBN 978-0-8108-8492-2 . OCLC 881399583.|p=510
- ^ Шелли, Томас Дж. (2016). Фордхэм, История Иезуитского университета Нью-Йорка: 1841–2003 гг. Нью-Йорк: Издательство Фордхэмского университета. ISBN 978-0-8232-7151-1 . ОСЛК 6933280401
- ^ «Избранные статистические данные о наборе учащихся, учителях, бросивших учебу и выпускниках в округах государственных школ, в которых обучается более 15 000 учащихся, по штатам: 1990, 2000 и 2006 годы» (PDF) . Сборник статистики образования 2008 . Министерство образования США . Институт педагогических наук , Национальный центр статистики образования . 18 марта 2009 г. стр. 129–139. Архивировано (PDF) из оригинала 7 мая 2009 г. Проверено 26 апреля 2009 г.
- ^ «Национальный рейтинг лучших средних школ US News & World Report» . Новости США и мировой отчет . Архивировано из оригинала 5 мая 2016 года . Проверено 10 сентября 2012 г.
- ^ «ОТДЕЛЬНЫЕ СОЦИАЛЬНЫЕ ХАРАКТЕРИСТИКИ В СОЕДИНЕННЫХ ШТАТАХ, Оценки исследования американского сообщества за 2010 год» . Бюро переписи населения США. Архивировано из оригинала 12 февраля 2020 года . Проверено 16 ноября 2011 г.
- ^ Кристи, Лес (1 октября 2010 г.). «Самые умные места для жизни в Америке» . CNN Деньги . Архивировано из оригинала 16 ноября 2011 года . Проверено 16 ноября 2011 г.
- ^ Маккензи, Брайан (август 2015 г.). «Кто ездит на работу? Путешествие на автомобиле в США: 2013 г.» (PDF) . Отчеты американских опросов. Архивировано (PDF) из оригинала 21 декабря 2017 г. Проверено 26 декабря 2017 г.
- ^ «Сеть MTA: общественный транспорт региона Нью-Йорка» . Столичное транспортное управление. Архивировано из оригинала 3 июня 2019 года . Проверено 7 сентября 2012 г.
- ^ Писарски, Алан (16 октября 2006 г.). «Путешествие на работу в Америке III: факты о поездках на работу» (PDF) . Совет транспортных исследований. Архивировано (PDF) из оригинала 13 января 2013 г. Проверено 7 сентября 2012 г.
- ^ «Сеть MTA: общественный транспорт региона Нью-Йорка» . Столичное транспортное управление. Архивировано из оригинала 3 июня 2019 года . Проверено 4 сентября 2012 г.
- ^ «MTA: количество пассажиров в метро на самом высоком уровне с 1950 года» . Нью-Йорк1 . 10 апреля 2012 года. Архивировано из оригинала 14 апреля 2012 года . Проверено 11 апреля 2012 г.
- ^ «(Нью-Йорк) Метро (факты и цифры под названием «Ежегодное количество пассажиров в метро)» . МТА.инфо . 2 апреля 2013. Архивировано из оригинала 22 июня 2013 года . Проверено 2 апреля 2013 г.
- ^ «Часы обслуживания» . ССО . Архивировано из оригинала 29 сентября 2012 года . Проверено 6 сентября 2012 г.
- ^ «Линия Цуэн Ван» . TravelChinaGuide.com. Архивировано из оригинала 20 октября 2012 года . Проверено 6 сентября 2012 г.
- ^ «Расписание поездов – Поиск станции» . Сеульская столичная корпорация скоростного транспорта . Архивировано из оригинала 16 февраля 2012 года . Проверено 6 сентября 2012 г.
- ^ «Карта метро» . Сеульская столичная корпорация скоростного транспорта. Архивировано из оригинала 14 апреля 2012 года . Проверено 6 сентября 2012 г.
- ^ Макгинн, Стюарт (31 октября 2022 г.). «Пользователи общественного транспорта Торонто хотят, чтобы метро открылось раньше, и вот что говорит TTC» . Нарсити . Нарсити Медиа. Архивировано из оригинала 13 октября 2023 года . Проверено 6 октября 2023 г.
- ^ «Расписание, карта и путеводитель PATH» (PDF) . Портовое управление Нью-Йорка и Нью-Джерси. Сентябрь 2017 г. Архивировано (PDF) из оригинала 8 мая 2018 г. Проверено 30 апреля 2018 г.
- ^ «Прогресс Всемирного торгового центра» (PDF) . panynj.gov . Портовое управление Нью-Йорка и Нью-Джерси. Февраль 2010. с. 2. Архивировано (PDF) из оригинала 24 сентября 2015 г. Проверено 31 августа 2014 г.
- ^ Перейти обратно: а б с «Отчет о пассажиропотоке общественного транспорта за четвертый квартал 2015 г.» (PDF) . Американская ассоциация общественного транспорта (APTA). 2 марта 2016 г. Архивировано (PDF) из оригинала 6 октября 2016 г. . Проверено 29 августа 2016 г.
- ^ Перейти обратно: а б «Портовое управление Нью-Йорка и Нью-Джерси – Мост Джорджа Вашингтона» . Портовое управление Нью-Йорка и Нью-Джерси. Архивировано из оригинала 20 сентября 2013 года . Проверено 13 сентября 2013 г.
- ^ Перейти обратно: а б Бод Вудрафф; Лана Зак и Стефани Уош (20 ноября 2012 г.). «Маляры мостов GW: опасная работа на вершине самого загруженного моста в мире» . Новости Эй-Би-Си. Архивировано из оригинала 28 сентября 2013 года . Проверено 13 сентября 2013 г.
- ^ Перейти обратно: а б «Книга рекордов Гиннеса 2014 — официально удивительно» . Архивировано из оригинала 11 декабря 2013 года . Проверено 7 декабря 2013 г.
- ^ Перейти обратно: а б «Самые длинные подвесные мосты в мире» . Pearson Education, издательство Infoplease. Архивировано из оригинала 10 августа 2012 года . Проверено 7 сентября 2012 г.
- ^ Перейти обратно: а б «Мост Верразано – Нэрроуз» . Восточные дороги. Архивировано из оригинала 3 сентября 2012 года . Проверено 7 сентября 2012 г.
- ^ «Власти порта: проект моста через Байонну на 6 месяцев раньше запланированного срока» . CBS Нью-Йорк. 18 июля 2012. Архивировано из оригинала 24 мая 2013 года . Проверено 7 сентября 2012 г.
- ^ «Бруклинский мост – программа национальных исторических достопримечательностей» . Служба национальных парков США. Архивировано из оригинала 28 ноября 2002 года . Проверено 7 сентября 2012 г.
- ^ Перейти обратно: а б «Garden State Parkway открывает самый широкий мост в мире – 15 полос движения» . TOLLROADSnews, Питер Сэмюэл. 11 апреля 2006. Архивировано из оригинала 23 марта 2012 года . Проверено 7 сентября 2012 г.
- ^ Хуррам Саид и Тереза Джува-Браун (17 декабря 2012 г.). «Это официально: штат выбирает строителя для нового моста Таппан Зи» . lohud.com. Архивировано из оригинала 10 октября 2014 года . Проверено 19 декабря 2012 г.
- ^ «ОТДЕЛЬНЫЕ ЭКОНОМИЧЕСКИЕ ХАРАКТЕРИСТИКИ, результаты исследования американского сообщества за 2010 год, оценки за 1 год» . Бюро переписи населения США. 2010. Архивировано из оригинала 13 февраля 2016 года . Проверено 5 апреля 2020 г.
- ^ «Общая информация о Метрополитен-музее» . Метрополитен-музей. Архивировано из оригинала 18 апреля 2012 года . Проверено 10 сентября 2012 г.
- ^ Перейти обратно: а б Эстебан (27 октября 2011 г.). «11 самых дорогих стадионов мира» . Тотальный профессиональный спорт. Архивировано из оригинала 27 августа 2012 года . Проверено 18 мая 2013 г.
- ^ Белсон, Кен (8 апреля 2010 г.). «Новый стадион, футбольный дворец, откроется в субботу лакроссом» . Нью-Йорк Таймс . Архивировано из оригинала 13 апреля 2010 года . Проверено 18 мая 2013 г.
- ^ «История искусства и развлечений Big Apple. Перекресток мира» . Тринадцать / WNET, Нью-Йорк, 2005 г., Образовательная радиовещательная корпорация. Архивировано из оригинала 5 января 2008 года . Проверено 3 сентября 2012 г.
- ^ «Перекресток мира – Таймс-сквер, официальный сайт Таймс-сквер» . Times Square District Management Association, Inc. Архивировано из оригинала 21 февраля 2011 года . Проверено 3 сентября 2012 г.
- ^ «Таймс-сквер Нью-Йорк, Нью-Йорк Таймс-сквер» . 2011 NYCTourist.com. Архивировано из оригинала 21 апреля 2012 года . Проверено 3 сентября 2012 г.
- ^ Адитья Рангру (14 октября 2010 г.). «Таймс-сквер: перекресток мира. Информация о Нью-Йорке» . (C) 1980–2010 TimesSquare.com Компания Dataware Corporation. Архивировано из оригинала 22 июля 2013 года . Проверено 3 сентября 2012 г.
- ^ Аллан Танненбаум. «Нью-Йорк 70-х: воспоминания» . Цифровой журналист. Архивировано из оригинала 20 марта 2012 года . Проверено 3 сентября 2012 г.
- ^ Джошуа Прамис (октябрь 2011 г.). «Самые посещаемые туристические достопримечательности мира № 1: Таймс-сквер, Нью-Йорк» . Издательская корпорация American Express. Архивировано из оригинала 1 февраля 2015 года . Проверено 3 сентября 2012 г.
- ^ «Генеральное консульство Исландии в Нью-Йорке. Культура» . Генеральное консульство Исландии в Нью-Йорке. Архивировано из оригинала 5 февраля 2013 года . Проверено 10 сентября 2012 г.
- ^ «Консульство Латвии в Нью-Йорке» . Консульство Латвии. Архивировано из оригинала 8 февраля 2013 года . Проверено 10 сентября 2012 г.
- ^ «Введение в главу 14: Культура Нью-Йорка (Нью-Йорк)» . Центр международного бизнеса Вейсмана, Колледж Баруха / CUNY, 2011. Архивировано из оригинала 5 мая 2013 года . Проверено 10 сентября 2012 г.
- ^ Нью-Йорк, культурная столица мира, 1940–1965 / под редакцией Леонарда Уоллока; эссе Дора Эштона... [и др.] . НАЦИОНАЛЬНАЯ БИБЛИОТЕКА АВСТРАЛИИ. 1988. ISBN 9780847809905 . Архивировано из оригинала 13 января 2013 года . Проверено 10 сентября 2012 г.
- ^ «Выступления: открытие выставки Тома Кристофера» (пресс-релиз). Генеральное консульство США: Франкфурт, Германия. 9 мая 2007 года. Архивировано из оригинала 23 июля 2007 года . Проверено 10 сентября 2012 г.
- ^ «Информация о компании Национальной футбольной лиги» . Hoover's, Inc. Архивировано из оригинала 3 октября 2013 года . Проверено 18 мая 2013 г.
- ^ «Информация о бейсбольной компании Высшей лиги» . Hoover's, Inc. Архивировано из оригинала 21 марта 2013 года . Проверено 18 мая 2013 г.
- ^ «Информация о компании Национальной баскетбольной ассоциации» . Hoover's, Inc. Архивировано из оригинала 18 мая 2013 года . Проверено 18 мая 2013 г.
- ^ «Информация о компании Национальной хоккейной лиги» . Hoover's, Inc. Архивировано из оригинала 21 мая 2013 года . Проверено 18 мая 2013 г.
- ^ "Информация о компании Высшая лига футбола, ООО" . Hoovers, Inc. Архивировано из оригинала 28 сентября 2013 года . Проверено 18 мая 2013 г.
- ^ «Six Flags Great Adventure станет крупнейшим в мире тематическим парком в 2013 году» . njtoday.net. 30 августа 2012. Архивировано из оригинала 17 января 2013 года . Проверено 2 сентября 2012 г.
- ^ КарлФабрициус (20 сентября 2010 г.). «10 самых высоких американских горок на Земле» . EntertainmentDesigner.com. Архивировано из оригинала 15 сентября 2012 года . Проверено 2 сентября 2012 г.
- ^ Джеймс Бэррон (27 сентября 2012 г.). «Самое высокое в мире колесо обозрения планируется построить на Статен-Айленде» . Нью-Йорк Таймс . Архивировано из оригинала 29 сентября 2012 года . Проверено 29 сентября 2012 г.
Внешние ссылки
[ редактировать ]- Государственная перепись , таблица 1.
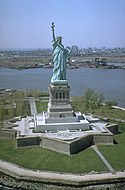
Содружество Пенсильвании |
|---|