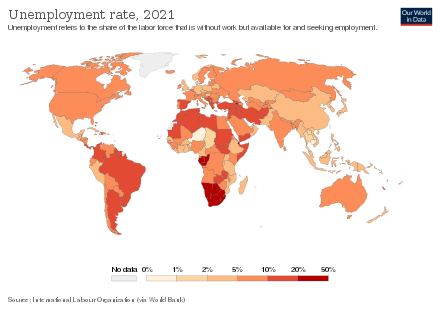
Unemployment
| Part of a series on |
| Economics |
|---|
| Part of a series on |
| Macroeconomics |
|---|
 |
| Part of a series on |
| Capitalism |
|---|
Unemployment, according to the OECD (Organisation for Economic Co-operation and Development), is people above a specified age (usually 15)[2] not being in paid employment or self-employment but currently available for work during the reference period.[3]
Unemployment is measured by the unemployment rate, which is the number of people who are unemployed as a percentage of the labour force (the total number of people employed added to those unemployed).[3]
Unemployment can have many sources, such as the following:
- the status of the economy, which can be influenced by a recession
- competition caused by globalization and international trade
- new technologies and inventions
- policies of the government
- regulation and market
- war, civil disorder, and natural disasters
Unemployment and the status of the economy can be influenced by a country through, for example, fiscal policy. Furthermore, the monetary authority of a country, such as the central bank, can influence the availability and cost for money through its monetary policy.
In addition to theories of unemployment, a few categorisations of unemployment are used for more precisely modelling the effects of unemployment within the economic system. Some of the main types of unemployment include structural unemployment, frictional unemployment, cyclical unemployment, involuntary unemployment and classical unemployment.[4] Structural unemployment focuses on foundational problems in the economy and inefficiencies inherent in labor markets, including a mismatch between the supply and demand of laborers with necessary skill sets. Structural arguments emphasize causes and solutions related to disruptive technologies and globalization. Discussions of frictional unemployment focus on voluntary decisions to work based on individuals' valuation of their own work and how that compares to current wage rates added to the time and effort required to find a job. Causes and solutions for frictional unemployment often address job entry threshold and wage rates.
According to the UN's International Labour Organization (ILO), there were 172 million people worldwide (or 5% of the reported global workforce) without work in 2018.[5]
Because of the difficulty in measuring the unemployment rate by, for example, using surveys (as in the United States) or through registered unemployed citizens (as in some European countries), statistical figures such as the employment-to-population ratio might be more suitable for evaluating the status of the workforce and the economy if they were based on people who are registered, for example, as taxpayers.[6]
Definitions, types, and theories
[edit]
The state of being without any work yet looking for work is called unemployment. Economists distinguish between various overlapping types of and theories of unemployment, including cyclical or Keynesian unemployment, frictional unemployment, structural unemployment and classical unemployment definition. Some additional types of unemployment that are occasionally mentioned are seasonal unemployment, hardcore unemployment, and hidden unemployment.
Though there have been several definitions of "voluntary" and "involuntary unemployment" in the economics literature, a simple distinction is often applied. Voluntary unemployment is attributed to the individual's decisions, but involuntary unemployment exists because of the socio-economic environment (including the market structure, government intervention, and the level of aggregate demand) in which individuals operate. In these terms, much or most of frictional unemployment is voluntary since it reflects individual search behavior. Voluntary unemployment includes workers who reject low-wage jobs, but involuntary unemployment includes workers fired because of an economic crisis, industrial decline, company bankruptcy, or organizational restructuring.
On the other hand, cyclical unemployment, structural unemployment, and classical unemployment are largely involuntary in nature. However, the existence of structural unemployment may reflect choices made by the unemployed in the past, and classical (natural) unemployment may result from the legislative and economic choices made by labour unions or political parties.
The clearest cases of involuntary unemployment are those with fewer job vacancies than unemployed workers even when wages are allowed to adjust and so even if all vacancies were to be filled, some unemployed workers would still remain. That happens with cyclical unemployment, as macroeconomic forces cause microeconomic unemployment, which can boomerang back and exacerbate those macroeconomic forces.
Real wage unemployment
[edit]Classical, natural, or real-wage unemployment, occurs when real wages for a job are set above the market-clearing level, causing the number of job-seekers to exceed the number of vacancies. On the other hand, most economists argue that as wages fall below a livable wage, many choose to drop out of the labour market and no longer seek employment. That is especially true in countries in which low-income families are supported through public welfare systems. In such cases, wages would have to be high enough to motivate people to choose employment over what they receive through public welfare. Wages below a livable wage are likely to result in lower labor market participation in the above-stated scenario. In addition, consumption of goods and services is the primary driver of increased demand for labor. Higher wages lead to workers having more income available to consume goods and services. Therefore, higher wages increase general consumption and as a result demand for labor increases and unemployment decreases.
Many economists[who?] have argued that unemployment increases with increased governmental regulation. For example, minimum wage laws raise the cost of some low-skill laborers above market equilibrium, resulting in increased unemployment as people who wish to work at the going rate cannot (as the new and higher enforced wage is now greater than the value of their labour).[7][8] Laws restricting layoffs may make businesses less likely to hire in the first place, as hiring becomes more risky.[8]
However, that argument overly simplifies the relationship between wage rates and unemployment by ignoring numerous factors that contribute to unemployment.[9][10][11][12][13] Some, such as Murray Rothbard, suggest that even social taboos can prevent wages from falling to the market-clearing level.[14]
In Out of Work: Unemployment and Government in the Twentieth-Century America, economists Richard Vedder and Lowell Gallaway argue that the empirical record of wages rates, productivity, and unemployment in America validates classical unemployment theory. Their data shows a strong correlation between adjusted real wage and unemployment in the United States from 1900 to 1990. However, they maintain that their data does not take into account exogenous events.[15]
Cyclical unemployment
[edit]
Cyclical, deficient-demand, or Keynesian unemployment occurs when there is not enough aggregate demand in the economy to provide jobs for everyone who wants to work. Demand for most goods and services falls, less production is needed and consequently, fewer workers are needed, wages are sticky and do not fall to meet the equilibrium level, and unemployment results.[16] Its name is derived from the frequent ups and downs in the business cycle, but unemployment can also be persistent, such as during the Great Depression.
With cyclical unemployment, the number of unemployed workers exceeds the number of job vacancies and so even if all open jobs were filled, some workers would still remain unemployed. Some associate cyclical unemployment with frictional unemployment because the factors that cause the friction are partially caused by cyclical variables. For example, a surprise decrease in the money supply may suddenly inhibit aggregate demand and thus inhibit labor demand.
Keynesian economists, on the other hand, see the lack of supply of jobs as potentially resolvable by government intervention. One suggested intervention involves deficit spending to boost employment and goods demand. Another intervention involves an expansionary monetary policy to increase the supply of money, which should reduce interest rates, which, in turn, should lead to an increase in non-governmental spending.[17]
Unemployment under "full employment"
[edit]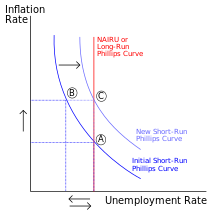
In demands based theory, it is possible to abolish cyclical unemployment by increasing the aggregate demand for products and workers. However, the economy eventually hits an "inflation barrier" that is imposed by the four other kinds of unemployment to the extent that they exist. Historical experience suggests that low unemployment affects inflation in the short term but not the long term.[18] In the long term, the velocity of money supply measures such as the MZM ("money zero maturity", representing cash and equivalent demand deposits) velocity is far more predictive of inflation than low unemployment.[19][20]
Some demand theory economists see the inflation barrier as corresponding to the natural rate of unemployment. The "natural" rate of unemployment is defined as the rate of unemployment that exists when the labour market is in equilibrium, and there is pressure for neither rising inflation rates nor falling inflation rates. An alternative technical term for that rate is the NAIRU, the Non-Accelerating Inflation Rate of Unemployment. Whatever its name, demand theory holds that if the unemployment rate gets "too low", inflation will accelerate in the absence of wage and price controls (incomes policies).
One of the major problems with the NAIRU theory is that no one knows exactly what the NAIRU is, and it clearly changes over time.[18] The margin of error can be quite high relative to the actual unemployment rate, making it hard to use the NAIRU in policy-making.[19]
Another, normative, definition of full employment might be called the ideal unemployment rate. It would exclude all types of unemployment that represent forms of inefficiency. This type of "full employment" unemployment would correspond to only frictional unemployment (excluding that part encouraging the McJobs management strategy) and so would be very low. However, it would be impossible to attain this full-employment target using only demand-side Keynesian stimulus without getting below the NAIRU and causing accelerating inflation (absent incomes policies). Training programs aimed at fighting structural unemployment would help here.
To the extent that hidden unemployment exists, it implies that official unemployment statistics provide a poor guide to what unemployment rate coincides with "full employment".[18]
Structural unemployment
[edit]
Structural unemployment occurs when a labour market is unable to provide jobs for everyone who wants one because there is a mismatch between the skills of the unemployed workers and the skills needed for the available jobs. Structural unemployment is hard to separate empirically from frictional unemployment except that it lasts longer. As with frictional unemployment, simple demand-side stimulus will not work to abolish this type of unemployment easily.
Structural unemployment may also be encouraged to rise by persistent cyclical unemployment: if an economy suffers from longlasting low aggregate demand, it means that many of the unemployed become disheartened, and their skills (including job-searching skills) become "rusty" and obsolete. Problems with debt may lead to homelessness and a fall into the vicious cycle of poverty, which means that people affected in this way may not fit the job vacancies that are created when the economy recovers. The implication is that sustained high demand may lower structural unemployment. This theory of persistence in structural unemployment has been referred to as an example of path dependence or "hysteresis".
Much technological unemployment,[21] caused by the replacement of workers by machines might be counted as structural unemployment. Alternatively, technological unemployment might refer to the way in which steady increases in labour productivity mean that fewer workers are needed to produce the same level of output every year. The fact that aggregate demand can be raised to deal with the problem suggests that the problem is instead one of cyclical unemployment. As indicated by Okun's law, the demand side must grow sufficiently quickly to absorb not only the growing labour force but also the workers who are made redundant by the increased labour productivity.
Seasonal unemployment may be seen as a kind of structural unemployment since it is linked to certain kinds of jobs (construction and migratory farm work). The most-cited official unemployment measures erase this kind of unemployment from the statistics using "seasonal adjustment" techniques. That results in substantial and permanent structural unemployment.
Frictional unemployment
[edit]
Frictional unemployment is the time period between jobs in which a worker searches for or transitions from one job to another. It is sometimes called search unemployment and can be voluntary, based on the circumstances of the unemployed individual. Frictional unemployment exists because both jobs and workers are heterogeneous, and a mismatch can result between the characteristics of supply and demand. Such a mismatch can be related to skills, payment, work-time, location, seasonal industries, attitude, taste, and a multitude of other factors. New entrants (such as graduating students) and re-entrants (such as former homemakers) can also suffer a spell of frictional unemployment.
Workers and employers accept a certain level of imperfection, risk or compromise, but usually not right away. They will invest some time and effort to find a better match. That is, in fact, beneficial to the economy since it results in a better allocation of resources. However, if the search takes too long and mismatches are too frequent, the economy suffers since some work will not get done. Therefore, governments will seek ways to reduce unnecessary frictional unemployment by multiple means including providing education, advice, training, and assistance such as daycare centers.
The frictions in the labour market are sometimes illustrated graphically with a Beveridge curve, a downward-sloping, convex curve that shows a correlation between the unemployment rate on one axis and the vacancy rate on the other. Changes in the supply of or demand for labour cause movements along the curve. An increase or decrease in labour market frictions will shift the curve outwards or inwards.
Hidden unemployment
[edit]Official statistics often underestimate unemployment rates because of hidden, or covered, unemployment.[22] That is the unemployment of potential workers that are not reflected in official unemployment statistics because of how the statistics are collected. In many countries, only those who have no work but are actively looking for work and/or qualifying for social security benefits are counted as unemployed. Those who have given up looking for work and sometimes those who are on government "retraining" programs are not officially counted among the unemployed even though they are not employed.
The statistic also does not count the "underemployed", those working fewer hours than they would prefer or in a job that fails to make good use of their capabilities. In addition, those who are of working age but are currently in full-time education are usually not considered unemployed in government statistics. Traditional unemployed native societies who survive by gathering, hunting, herding, and farming in wilderness areas may or may not be counted in unemployment statistics.
Long-term unemployment
[edit]Long-term unemployment (LTU) is defined in European Union statistics as unemployment lasting for longer than one year (while unemployment lasting over two years is defined as very long-term unemployment). The United States Bureau of Labor Statistics (BLS), which reports current long-term unemployment rate at 1.9 percent, defines this as unemployment lasting 27 weeks or longer. Long-term unemployment is a component of structural unemployment, which results in long-term unemployment existing in every social group, industry, occupation, and all levels of education.[23]
In 2015 the European Commission published recommendations on how to reduce long-term unemployment.[24] These advised governments to:
- encourage long-term unemployed people to register with an employment service;
- provide each registered long-term unemployed person with an individual in-depth assessment to identify their needs and potential within 18 months;
- offer a tailor-made job integration agreement (JIA) to all registered long-term unemployed within 18 months. These might include measures such as mentoring, help with job search, further education and training, support for housing, transport, child and care services and rehabilitation. Each person would have a single point of contact to access this support, which would be implemented in partnership with employers.
In 2017–2019 it implemented the Long-Term Unemployment project to research solutions implemented by EU member states and produce a toolkit[25] to guide government action. Progress was evaluated[26] in 2019.
Marxian theory of unemployment
[edit]
It is in the very nature of the capitalist mode of production to overwork some workers while keeping the rest as a reserve army of unemployed paupers.
— Marx, Theory of Surplus Value[27]
Marxists share the Keynesian viewpoint of the relationship between economic demand and employment, but with the caveat that the market system's propensity to slash wages and reduce labor participation on an enterprise level causes a requisite decrease in aggregate demand in the economy as a whole, causing crises of unemployment and periods of low economic activity before the capital accumulation (investment) phase of economic growth can continue. According to Karl Marx, unemployment is inherent within the unstable capitalist system and periodic crises of mass unemployment are to be expected. He theorized that unemployment was inevitable and even a necessary part of the capitalist system, with recovery and regrowth also part of the process.[28] The function of the proletariat within the capitalist system is to provide a "reserve army of labour" that creates downward pressure on wages. This is accomplished by dividing the proletariat into surplus labour (employees) and under-employment (unemployed).[29] This reserve army of labour fight among themselves for scarce jobs at lower and lower wages. At first glance, unemployment seems inefficient since unemployed workers do not increase profits, but unemployment is profitable within the global capitalist system because unemployment lowers wages which are costs from the perspective of the owners. From this perspective low wages benefit the system by reducing economic rents. Yet, it does not benefit workers; according to Karl Marx, the workers (proletariat) work to benefit the bourgeoisie through their production of capital.[30] Capitalist systems unfairly manipulate the market for labour by perpetuating unemployment which lowers laborers' demands for fair wages. Workers are pitted against one another at the service of increasing profits for owners. As a result of the capitalist mode of production, Marx argued that workers experienced alienation and estrangement through their economic identity.[31] According to Marx, the only way to permanently eliminate unemployment would be to abolish capitalism and the system of forced competition for wages and then shift to a socialist or communist economic system. For contemporary Marxists, the existence of persistent unemployment is proof of the inability of capitalism to ensure full employment.[32]
Measurement
[edit]There are also different ways national statistical agencies measure unemployment. The differences may limit the validity of international comparisons of unemployment data.[33] To some degree, the differences remain despite national statistical agencies increasingly adopting the definition of unemployment of the International Labour Organization.[34] To facilitate international comparisons, some organizations, such as the OECD, Eurostat, and International Labor Comparisons Program, adjust data on unemployment for comparability across countries.
Though many people care about the number of unemployed individuals, economists typically focus on the unemployment rate, which corrects for the normal increase in the number of people employed caused by increases in population and increases in the labour force relative to the population. The unemployment rate is expressed as a percentage and calculated as follows:

As defined by the International Labour Organization, "unemployed workers" are those who are currently not working but are willing and able to work for pay, currently available to work, and have actively searched for work.[35] Individuals who are actively seeking job placement must make the effort to be in contact with an employer, have job interviews, contact job placement agencies, send out resumes, submit applications, respond to advertisements, or some other means of active job searching within the prior four weeks. Simply looking at advertisements and not responding will not count as actively seeking job placement. Since not all unemployment may be "open" and counted by government agencies, official statistics on unemployment may not be accurate.[36] In the United States, for example, the unemployment rate does not take into consideration those individuals who are not actively looking for employment, such as those who are still attending college.[37]
According to the OECD, Eurostat, and the US Bureau of Labor Statistics the unemployment rate is the number of unemployed people as a percentage of the labour force.
"An unemployed person is defined by Eurostat, according to the guidelines of the International Labour Organization, as:
- someone aged 15 to 74 (in Italy, Spain, the United Kingdom, Iceland, Norway: 16 to 74 years);
- without work during the reference week;
- available to start work within the next two weeks (or has already found a job to start within the next three months);
- actively having sought employment at some time during the last four weeks."[38]
The labour force, or workforce, includes both employed (employees and self-employed) and unemployed people but not the economically inactive, such as pre-school children, school children, students and pensioners.[39]
The unemployment rate of an individual country is usually calculated and reported on a monthly, quarterly, and yearly basis by the National Agency of Statistics. Organisations like the OECD report statistics for all of its member states.[40]
Certain countries provide unemployment compensation for a certain period of time for unemployed citizens who are registered as unemployed at the government employment agency. Furthermore, pension receivables or claims could depend on the registration at the government employment agency.[41][42]
In many countries like in Germany, the unemployment rate is based on the number of people who are registered as unemployed.[43] Other countries like the United States use a labour force survey to calculate the unemployment rate.[44][45]
The ILO describes four different methods to calculate the unemployment rate:[46]
- Labour Force Sample Surveys are the most preferred method of unemployment rate calculation since they give the most comprehensive results and enables calculation of unemployment by different group categories such as race and gender. This method is the most internationally comparable.
- Official Estimates are determined by a combination of information from one or more of the other three methods. The use of this method has been declining in favor of labour surveys.
- Social Insurance Statistics, such as unemployment benefits, are computed based on the number of persons insured representing the total labour force and the number of persons who are insured that are collecting benefits. This method has been heavily criticized because if the expiration of benefits before the person finds work.
- Employment Office Statistics are the least effective since they include only a monthly tally of unemployed persons who enter employment offices. This method also includes those who are not unemployed by the ILO definition.
The primary measure of unemployment, U3, allows for comparisons between countries. Unemployment differs from country to country and across different time periods. For example, in the 1990s and 2000s, the United States had lower unemployment levels than many countries in the European Union,[47] which had significant internal variation, with countries like the United Kingdom and Denmark outperforming Italy and France. However, large economic events like the Great Depression can lead to similar unemployment rates across the globe.
In 2013, the ILO adopted a resolution to introduce new indicators to measure the unemployment rate.[48]
- LU1: Unemployment rate: [persons in unemployment / labour force] × 100
- LU2: Combined rate of time-related underemployment and unemployment: [(persons in time-related underemployment + persons in unemployment) / labour force]
x 100
- LU3: Combined rate of unemployment and potential labour force: [(persons in unemployment + potential labour force) / (extended labour force)] × 100
- LU4: Composite measure of labour underutilization: [(persons in time-related underemployment + persons in unemployment + potential
labour force) / (extended labour force)] × 100
European Union (Eurostat)
[edit]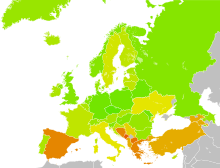

Eurostat, the statistical office of the European Union, defines unemployed as those persons between age 15 and 74 who are not working, have looked for work in the last four weeks, and are ready to start work within two weeks; this definition conforms to ILO standards. Both the actual count and the unemployment rate are reported. Statistical data are available by member state for the European Union as a whole (EU28) as well as for the eurozone (EA19). Eurostat also includes a long-term unemployment rate, which is defined as part of the unemployed who have been unemployed for more than one year.[49]
The main source used is the European Union Labour Force Survey (EU-LFS). It collects data on all member states each quarter. For monthly calculations, national surveys or national registers from employment offices are used in conjunction with quarterly EU-LFS data. The exact calculation for individual countries, resulting in harmonized monthly data, depends on the availability of the data.[50]
United States Bureau of Labor statistics
[edit]
The Bureau of Labor Statistics measures employment and unemployment (of those over 17 years of age) by using two different labor force surveys[52] conducted by the United States Census Bureau (within the United States Department of Commerce) and/or the Bureau of Labor Statistics (within the United States Department of Labor) that gather employment statistics monthly. The Current Population Survey (CPS), or "Household Survey", conducts a survey based on a sample of 60,000 households. The survey measures the unemployment rate based on the ILO definition.[53]
The Current Employment Statistics survey (CES), or "Payroll Survey", conducts a survey based on a sample of 160,000 businesses and government agencies, which represent 400,000 individual employers.[54] Since the survey measures only civilian nonagricultural employment, it does not calculate an unemployment rate, and it differs from the ILO unemployment rate definition. Both sources have different classification criteria and usually produce differing results. Additional data are also available from the government, such as the unemployment insurance weekly claims report available from the Office of Workforce Security, within the U.S. Department of Labor's Employment and Training Administration.[55] The Bureau of Labor Statistics provides up-to-date numbers via a PDF linked here.[56] The BLS also provides a readable concise current Employment Situation Summary, updated monthly.[57]

The Bureau of Labor Statistics also calculates six alternate measures of unemployment, U1 to U6, which measure different aspects of unemployment:[58]
- U1:[59] Percentage of labor force unemployed 15 weeks or longer.
- U2: Percentage of labor force who lost jobs or completed temporary work.
- U3: Official unemployment rate, per the ILO definition, occurs when people are without jobs and they have actively looked for work within the past four weeks.[60]
- U4: U3 + "discouraged workers", or those who have stopped looking for work because current economic conditions make them believe that no work is available for them.
- U5: U4 + other "marginally attached workers," or "loosely attached workers", or those who "would like" and are able to work but have not looked for work recently.
- U6: U5 + Part-time workers who want to work full-time, but cannot for economic reasons (underemployment).
Note: "Marginally attached workers" are added to the total labour force for unemployment rate calculation for U4, U5, and U6. The BLS revised the CPS in 1994 and among the changes the measure representing the official unemployment rate was renamed U3 instead of U5.[61] In 2013, Representative Hunter proposed that the Bureau of Labor Statistics use the U5 rate instead of the current U3 rate.[62]
Statistics for the US economy as a whole hide variations among groups. For example, in January 2008, the US unemployment rates were 4.4% for adult men, 4.2% for adult women, 4.4% for Caucasians, 6.3% for Hispanics or Latinos (all races), 9.2% for African Americans, 3.2% for Asian Americans, and 18.0% for teenagers.[54] Also, the US unemployment rate would be at least 2% higher if prisoners and jail inmates were counted.[63][64]
The unemployment rate is included in a number of major economic indices including the US Conference Board's Index of Leading Indicators a macroeconomic measure of the state of the economy.


Alternatives
[edit]Limitations of definition
[edit]Some critics believe that current methods of measuring unemployment are inaccurate in terms of the impact of unemployment on people as these methods do not take into account the 1.5% of the available working population incarcerated in US prisons (who may or may not be working while they are incarcerated); those who have lost their jobs and have become discouraged over time from actively looking for work; those who are self-employed or wish to become self-employed, such as tradesmen or building contractors or information technology consultants; those who have retired before the official retirement age but would still like to work (involuntary early retirees); those on disability pensions who do not possess full health but still wish to work in occupations suitable for their medical conditions; or those who work for payment for as little as one hour per week but would like to work full time.[70]
The last people are "involuntary part-time" workers, those who are underemployed, such as a computer programmer who is working in a retail store until he can find a permanent job, involuntary stay-at-home mothers who would prefer to work, and graduate and professional school students who are unable to find worthwhile jobs after they graduated with their bachelor's degrees.

Internationally, some nations' unemployment rates are sometimes muted or appear less severe because of the number of self-employed individuals working in agriculture.[65] Small independent farmers are often considered self-employed and so cannot be unemployed. That can impact non-industrialized economies, such as the United States and Europe in the early 19th century, since overall unemployment was approximately 3% because so many individuals were self-employed, independent farmers; however, non-agricultural unemployment was as high as 80%.[65]
Many economies industrialize and so experience increasing numbers of non-agricultural workers. For example, the United States' non-agricultural labour force increased from 20% in 1800 to 50% in 1850 and 97% in 2000.[65] The shift away from self-employment increases the percentage of the population that is included in unemployment rates. When unemployment rates between countries or time periods are compared, it is best to consider differences in their levels of industrialization and self-employment.
Additionally, the measures of employment and unemployment may be "too high". In some countries, the availability of unemployment benefits can inflate statistics by giving an incentive to register as unemployed. People who do not seek work may choose to declare themselves unemployed to get benefits; people with undeclared paid occupations may try to get unemployment benefits in addition to the money that they earn from their work.[71]
However, in the United States, Canada, Mexico, Australia, Japan, and the European Union, unemployment is measured using a sample survey (akin to a Gallup poll).[34] According to the BLS, a number of Eastern European nations have instituted labour force surveys as well. The sample survey has its own problems because the total number of workers in the economy is calculated based on a sample, rather than a census.
It is possible to be neither employed nor unemployed by ILO definitions by being outside of the "labour force".[36] Such people have no job and are not looking for one. Many of them go to school or are retired. Family responsibilities keep others out of the labour force. Still others have a physical or mental disability that prevents them from participating in the labour force. Some people simply elect not to work and prefer to be dependent on others for sustenance.
Typically, employment and the labour force include only work that is done for monetary gain. Hence, a homemaker is neither part of the labour force nor unemployed. Also, full-time students and prisoners are considered to be neither part of the labour force nor unemployed.[70] The number of prisoners can be important. In 1999, economists Lawrence F. Katz and Alan B. Krueger estimated that increased incarceration lowered measured unemployment in the United States by 0.17% between 1985 and the late 1990s.[70]
In particular, as of 2005, roughly 0.7% of the US population is incarcerated (1.5% of the available working population). Additionally, children, the elderly, and some individuals with disabilities are typically not counted as part of the labour force and so are not included in the unemployment statistics. However, some elderly and many disabled individuals are active in the labour market.
In the early stages of an economic boom, unemployment often rises.[16] That is because people join the labour market (give up studying, start a job hunt, etc.) as a result of the improving job market, but until they have actually found a position, they are counted as unemployed. Similarly, during a recession, the increase in the unemployment rate is moderated by people leaving the labour force or being otherwise discounted from the labour force, such as with the self-employed.
For the fourth quarter of 2004, according to OECD (Employment Outlook 2005 ISBN 92-64-01045-9), normalized unemployment for men aged 25 to 54 was 4.6% in the US and 7.4% in France. At the same time and for the same population, the employment rate (number of workers divided by population) was 86.3% in the US and 86.7% in France. That example shows that the unemployment rate was 60% higher in France than in the US, but more people in that demographic were working in France than in the US, which is counterintuitive if it is expected that the unemployment rate reflects the health of the labour market.[72][73]
Those deficiencies make many labour market economists prefer to look at a range of economic statistics such as labour market participation rate, the percentage of people between 15 and 64 who are currently employed or searching for employment, the total number of full-time jobs in an economy, the number of people seeking work as a raw number and not a percentage, and the total number of person-hours worked in a month compared to the total number of person-hours people would like to work. In particular, the National Bureau of Economic Research does not use the unemployment rate but prefers various employment rates to date recessions.[74]
Labor force participation rate
[edit]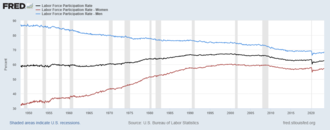
The labor force participation rate is the ratio between the labor force and the overall size of their cohort (national population of the same age range). In the West, during the latter half of the 20th century, the labor force participation rate increased significantly because of an increase in the number of women entering the workplace.
In the United States, there have been four significant stages of women's participation in the labour force: increases in the 20th century and decreases in the 21st century. Male labor force participation decreased from 1953 to 2013. Since October 2013, men have been increasingly joining the labour force.
From the late 19th century to the 1920s, very few women worked outside the home. They were young single women who typically withdrew from the labor force at marriage unless family needed two incomes. Such women worked primarily in the textile manufacturing industry or as domestic workers. That profession empowered women and allowed them to earn a living wage.[75] At times, they were a financial help to their families.
Between 1930 and 1950, female labor force participation increased primarily because of the increased demand for office workers, women's participation in the high school movement, and electrification, which reduced the time that was spent on household chores. From the 1950s to the early 1970s, most women were secondary earners working mainly as secretaries, teachers, nurses, and librarians (pink-collar jobs).
From the mid-1970s to the late 1990s, there was a period of revolution of women in the labor force brought on by various factors, many of which arose from the second-wave feminism movement. Women more accurately planned for their future in the work force by investing in more applicable majors in college that prepared them to enter and compete in the labor market. In the United States, the female labor force participation rate rose from approximately 33% in 1948 to a peak of 60.3% in 2000. As of April 2015, the female labor force participation is at 56.6%, the male labor force participation rate is at 69.4%, and the total is 62.8%.[76]
A common theory in modern economics claims that the rise of women participating in the US labor force in the 1950s to the 1990s was caused by the introduction of a new contraceptive technology, birth control pills, as well as the adjustment of age of majority laws. The use of birth control gave women the flexibility of opting to invest and to advance their career while they maintained a relationship. By having control over the timing of their fertility, they were not running a risk of thwarting their career choices. However, only 40% of the population actually used the birth control pill.
That implies that other factors may have contributed to women choosing to invest in advancing their careers. One factor may be that an increasing number of men delayed the age of marriage, which allowed women to marry later in life without them worrying about the quality of older men. Other factors include the changing nature of work, with machines replacing physical labor, thus eliminating many traditional male occupations, and the rise of the service sector in which many jobs are gender neutral.
Another factor that may have contributed to the trend was the Equal Pay Act of 1963, which aimed at abolishing wage disparity based on sex. Such legislation diminished sexual discrimination and encouraged more women to enter the labor market by receiving fair remuneration to help raising families and children.
At the turn of the 21st century, the labor force participation began to reverse its long period of increase. Reasons for the change include a rising share of older workers, an increase in school enrollment rates among young workers, and a decrease in female labor force participation.[77]
The labor force participation rate can decrease when the rate of growth of the population outweighs that of the employed and the unemployed together. The labor force participation rate is a key component in long-term economic growth, almost as important as productivity.
A historic shift began around the end of the Great Recession as women began leaving the labor force in the United States and other developed countries. The female labor force participation rate in the United States has steadily decreased since 2009, and as of April 2015, the female labor force participation rate has gone back down to 1988 levels of 56.6%.[76]
Participation rates are defined as follows:
| Pop = total population | LF = labor force = U + E |
| LFpop = labor force population (generally defined as all men and women aged 15–64) |
p = participation rate = LF / LFpop |
| E = number employed | e = rate of employment = E / LFpop |
| U = number of unemployed | u = rate of unemployment = U / LF |
The labor force participation rate explains how an increase in the unemployment rate can occur simultaneously with an increase in employment. If a large number of new workers enter the labor force but only a small fraction become employed, then the increase in the number of unemployed workers can outpace the growth in employment.[78]
Unemployment-to-population ratio
[edit]The unemployment-to-population ratio calculates the share of unemployed for the whole population. This is in contrast to the unemployment rate, which calculates the percentage of unemployed persons in relation to the active population. Particularly, many young people between 15 and 24 are studying full-time and so are neither working nor looking for a job. That means that they are not part of the labor force, which is used as the denominator when the unemployment rate is calculated.[79]
The youth unemployment ratios in the European Union range from 5.2 (Austria) to 20.6 percent (Spain). They are considerably lower than the standard youth unemployment rates, ranging from 7.9 (Germany) to 57.9 percent (Greece).[80]
Effects
[edit]High and the persistent unemployment, in which economic inequality increases, has a negative effect on subsequent long-run economic growth. Unemployment can harm growth because it is a waste of resources; generates redistributive pressures and subsequent distortions; drives people to poverty; constrains liquidity limiting labor mobility; and erodes self-esteem promoting social dislocation, unrest, and conflict.[81] The 2013 winner of the Nobel Prize in Economics, Robert J. Shiller, said that rising inequality in the United States and elsewhere is the most important problem.[82]
Costs
[edit]Individual
[edit]
Unemployed individuals are unable to earn money to meet financial obligations. Failure to pay mortgage payments or to pay rent may lead to homelessness through foreclosure or eviction.[83] Across the United States the growing ranks of people made homeless in the foreclosure crisis are generating tent cities.[84]
Unemployment increases susceptibility to cardiovascular disease, somatization, anxiety disorders, depression, and suicide. In addition, unemployed people have higher rates of medication use, poor diet, physician visits, tobacco smoking, alcoholic beverage consumption, drug use, and lower rates of exercise.[85] According to a study published in Social Indicator Research, even those who tend to be optimistic find it difficult to look on the bright side of things when unemployed. Using interviews and data from German participants aged 16 to 94, including individuals coping with the stresses of real life and not just a volunteering student population, the researchers determined that even optimists struggled with being unemployed.[86]
In 1979, M. Harvey Brenner found that for every 10% increase in the number of unemployed, there is an increase of 1.2% in total mortality, a 1.7% increase in cardiovascular disease, 1.3% more cirrhosis cases, 1.7% more suicides, 4.0% more arrests, and 0.8% more assaults reported to the police.[87][88]
A study by Christopher Ruhm in 2000 on the effect of recessions on health found that several measures of health actually improve during recessions.[89] As for the impact of an economic downturn on crime, during the Great Depression, the crime rate did not decrease. The unemployed in the US often use welfare programs such as food stamps or accumulating debt because unemployment insurance in the US generally does not replace most of the income that was received on the job, and one cannot receive such aid indefinitely.
Not everyone suffers equally from unemployment. In a prospective study of 9,570 individuals over four years, highly conscientious people suffered more than twice as much if they became unemployed.[90] The authors suggested that may because of conscientious people making different attributions about why they became unemployed or through experiencing stronger reactions following failure. There is also the possibility of reverse causality from poor health to unemployment.[91]
Some researchers hold that many of the low-income jobs are not really a better option than unemployment with a welfare state, with its unemployment insurance benefits. However, since it is difficult or impossible to get unemployment insurance benefits without having worked in the past, those jobs and unemployment are more complementary than they are substitutes. (They are often held short-term, either by students or by those trying to gain experience; turnover in most low-paying jobs is high.)
Another cost for the unemployed is that the combination of unemployment, lack of financial resources, and social responsibilities may push unemployed workers to take jobs that do not fit their skills or allow them to use their talents. Unemployment can cause underemployment, and fear of job loss can spur psychological anxiety. As well as anxiety, it can cause depression, lack of confidence, and huge amounts of stress, which is increased when the unemployed are faced with health issues, poverty, and lack of relational support.[92]
Another personal cost of unemployment is its impact on relationships. A 2008 study from Covizzi, which examined the relationship between unemployment and divorce, found that the rate of divorce is greater for couples when one partner is unemployed.[93] However, a more recent study has found that some couples often stick together in "unhappy" or "unhealthy" marriages when they are unemployed to buffer financial costs.[94] A 2014 study by Van der Meer found that the stigma that comes from being unemployed affects personal well-being, especially for men, who often feel as though their masculine identities are threatened by unemployment.[95]
Gender and age
[edit]Unemployment can also bring personal costs in relation to gender. One study found that women are more likely to experience unemployment than men and that they are less likely to move from temporary positions to permanent positions.[96] Another study on gender and unemployment found that men, however, are more likely to experience greater stress, depression, and adverse effects from unemployment, largely stemming from the perceived threat to their role as breadwinner.[97] The study found that men expect themselves to be viewed as "less manly" after a job loss than they actually are and so they engage in compensating behaviors, such as financial risk-taking and increased assertiveness. Unemployment has been linked to extremely adverse effects on men's mental health.[98] Professor Ian Hickie of the University of Sydney said that evidence showed that men have more restricted social networks than women and that men have are heavily work-based. Therefore, the loss of a job for men means the loss of a whole set of social connections as well. That loss can then lead to men becoming socially isolated very quickly.[99] An Australian study on the mental health impacts of graduating during an economic downturn found that the negative mental health outcomes are greater and more scarring for men than women. The effect was particularly pronounced for those with vocational or secondary education.[100]
Costs of unemployment also vary depending on age. The young and the old are the two largest age groups currently experiencing unemployment.[101] A 2007 study from Jacob and Kleinert found that young people (ages 18 to 24) who have fewer resources and limited work experiences are more likely to be unemployed.[102] Other researchers have found that today's high school seniors place a lower value on work than those in the past, which is likely because they recognize the limited availability of jobs.[103] At the other end of the age spectrum, studies have found that older individuals have more barriers than younger workers to employment, require stronger social networks to acquire work, and are also less likely to move from temporary to permanent positions.[96][101] Additionally, some older people see age discrimination as the reason for them not getting hired.[104]
Social
[edit]
An economy with high unemployment is not using all of the resources, specifically labour, available to it. Since it is operating below its production possibility frontier, it could have higher output if all of the workforce were usefully employed. However, there is a tradeoff between economic efficiency and unemployment: if all frictionally unemployed accepted the first job that they were offered, they would be likely to be operating at below their skill level, reducing the economy's efficiency.[105]
During a long period of unemployment, workers can lose their skills, causing a loss of human capital. Being unemployed can also reduce the life expectancy of workers by about seven years.[8]
High unemployment can encourage xenophobia and protectionism since workers fear that foreigners are stealing their jobs.[106] Efforts to preserve existing jobs of domestic and native workers include legal barriers against "outsiders" who want jobs, obstacles to immigration, and/or tariffs and similar trade barriers against foreign competitors.
High unemployment can also cause social problems such as crime. If people have less disposable income than before, it is very likely that crime levels within the economy will increase.
A 2015 study published in The Lancet, estimates that unemployment causes 45,000 suicides a year globally.[107]
Sociopolitical
[edit]
High levels of unemployment can be causes of civil unrest,[108] in some cases leading to revolution, particularly totalitarianism. The fall of the Weimar Republic in 1933 and Adolf Hitler's rise to power, which culminated in World War II and the deaths of tens of millions and the destruction of much of the physical capital of Europe, is attributed to the poor economic conditions in Germany at the time, notably a high unemployment rate[109] of above 20%; see Great Depression in Central Europe for details.
However the hyperinflation in the Weimar Republic is not directly blamed for the Nazi rise. Hyperinflation occurred primarily in 1921 to 1923, the year of Hitler's Beer Hall Putsch. Although hyperinflation has been blamed for damaging the credibility of democratic institutions, the Nazis did not assume government until 1933, ten years after the hyperinflation but in the midst of high unemployment.
Rising unemployment has traditionally been regarded by the public and the media in any country as a key guarantor of electoral defeat for any government that oversees it. That was very much the consensus in the United Kingdom until 1983, when Thatcher's Conservative government won a landslide in the general election, despite overseeing a rise in unemployment from 1.5 million to 3.2 million since the 1979 election.[110]
Benefits
[edit]The primary benefit of unemployment is that people are available for hire, without being headhunted away from their existing employers. That permits both new and old businesses to take on staff.
Unemployment is argued to be "beneficial" to the people who are not unemployed in the sense that it averts inflation, which itself has damaging effects, by providing (in Marxian terms) a reserve army of labour, which keeps wages in check.[111] However, the direct connection between full local employment and local inflation has been disputed by some because of the recent increase in international trade that supplies low-priced goods even while local employment rates rise to full employment.[112]

Full employment cannot be achieved because workers would shirk if they were not threatened with the possibility of unemployment.[113] The curve for the no-shirking condition (labelled NSC) thus goes to infinity at full employment. The inflation-fighting benefits to the entire economy arising from a presumed optimum level of unemployment have been studied extensively.[114] The Shapiro–Stiglitz model suggests that wages never bid down sufficiently to reach 0% unemployment.[115] That occurs because employers know that when wages decrease, workers will shirk and expend less effort. Employers avoid shirking by preventing wages from decreasing so low that workers give up and become unproductive. The higher wages perpetuate unemployment, but the threat of unemployment reduces shirking.
Before current levels of world trade were developed, unemployment was shown to reduce inflation, following the Phillips curve, or to decelerate inflation, following the NAIRU/natural rate of unemployment theory since it is relatively easy to seek a new job without losing a current job. When more jobs are available for fewer workers (lower unemployment), that may allow workers to find the jobs that better fit their tastes, talents and needs.
As in the Marxian theory of unemployment, special interests may also benefit. Some employers may expect that employees with no fear of losing their jobs will not work as hard or will demand increased wages and benefit. According to that theory, unemployment may promote general labour productivity and profitability by increasing employers' rationale for their monopsony-like power (and profits).[27]
Optimal unemployment has also been defended as an environmental tool to brake the constantly accelerated growth of the GDP to maintain levels that are sustainable in the context of resource constraints and environmental impacts.[116] However, the tool of denying jobs to willing workers seems a blunt instrument for conserving resources and the environment. It reduces the consumption of the unemployed across the board and only in the short term. Full employment of the unemployed workforce, all focused toward the goal of developing more environmentally efficient methods for production and consumption, might provide a more significant and lasting cumulative environmental benefit and reduced resource consumption.[117]
Some critics of the "culture of work" such as the anarchist Bob Black see employment as culturally overemphasized in modern countries. Such critics often propose quitting jobs when possible, working less, reassessing the cost of living to that end, creation of jobs that are "fun" as opposed to "work," and creating cultural norms in which work is seen as unhealthy. These people advocate an "anti-work" ethic for life.[118]
Decline in work hours
[edit]As a result of productivity, the work week declined considerably during the 19th century.[119][120] By the 1920s, the average workweek in the US was 49 hours, but it was reduced to 40 hours (after which overtime premium was applied) as part of the 1933 National Industrial Recovery Act. During the Great Depression, the enormous productivity gains caused by electrification, mass production, and agricultural mechanization were believed to have ended the need for a large number of previously employed workers.[21][121]
Remedies
[edit]| 1936 | 1937 | 1938 | 1939 | 1940 | 1941 | |
|---|---|---|---|---|---|---|
| Workers employed | ||||||
| WPA | 1,995 | 2,227 | 1,932 | 2,911 | 1,971 | 1,638 |
| CCC and NYA | 712 | 801 | 643 | 793 | 877 | 919 |
| Other federal work projects | 554 | 663 | 452 | 488 | 468 | 681 |
| Cases on public assistance | ||||||
| Social security programs | 602 | 1,306 | 1,852 | 2,132 | 2,308 | 2,517 |
| General relief | 2,946 | 1,484 | 1,611 | 1,647 | 1,570 | 1,206 |
| Итоги | ||||||
| Всего помогло семей | 5,886 | 5,660 | 5,474 | 6,751 | 5,860 | 5,167 |
| Безработные (BLS) | 9,030 | 7,700 | 10,390 | 9,480 | 8,120 | 5,560 |
| Охват (заболевшие/безработные) | 65% | 74% | 53% | 71% | 72% | 93% |
Общества пробуют ряд различных мер, чтобы привлечь на работу как можно больше людей, и в различных обществах наблюдается близкая к полной занятости в течение длительных периодов времени , особенно во время экономического роста после Второй мировой войны . В Соединенном Королевстве в 1950-х и 1960-х годах средний уровень безработицы составлял 1,6%. [123] а в Австралии Белая книга 1945 года о полной занятости в Австралии установила государственную политику полной занятости, которая продолжалась до 1970-х годов. [ 124 ]
Однако основные экономические дискуссии о полной занятости, начиная с 1970-х годов, предполагают, что попытки снизить уровень безработицы ниже естественного уровня безработицы потерпят неудачу, а приведут лишь к снижению объема производства и увеличению инфляции.
Решения, ориентированные на спрос
[ редактировать ]Увеличение спроса на рабочую силу перемещает экономику по кривой спроса , увеличивая заработную плату и занятость. Спрос на рабочую силу в экономике является производным от спроса на товары и услуги. Таким образом, если спрос на товары и услуги в экономике увеличивается, спрос на рабочую силу будет увеличиваться, увеличивая занятость и заработную плату.
Существует множество способов стимулирования спроса на товары и услуги. Одной из предлагаемых теорий является повышение заработной платы рабочему классу (тому, кто с большей вероятностью потратит увеличенные средства на товары и услуги, а не на различные виды сбережений или покупки товаров). Считается, что повышение заработной платы более эффективно стимулирует спрос на товары и услуги, чем стратегии центральных банков, которые передают увеличенную денежную массу в основном в руки богатых людей и учреждений. Монетаристы предполагают, что увеличение денежной массы в целом увеличивает краткосрочный спрос. Что касается долгосрочного спроса, то возросший спрос нивелируется инфляцией. Еще одной стратегией стимулирования совокупного спроса является рост бюджетных расходов.
Оказание помощи безработным — это стратегия, которая используется для предотвращения сокращения потребления товаров и услуг, что может привести к порочному кругу дальнейших потерь рабочих мест и дальнейшего снижения потребления и спроса. Многие страны помогают безработным посредством программ социального обеспечения . Такие пособия по безработице включают страхование по безработице , компенсации по безработице , социальное обеспечение и субсидии на помощь в переподготовке. Основная цель таких программ — облегчить краткосрочные трудности и, что более важно, предоставить работникам больше времени на поиск работы.
Прямым решением проблемы безработицы со стороны спроса является финансируемая государством занятость трудоспособной бедноты. В частности, это было реализовано в Великобритании с 17 века до 1948 года в институте работных домов , которые предоставляли безработным рабочие места с тяжелыми условиями и низкой заработной платой, чтобы воспрепятствовать их использованию. Современной альтернативой является гарантия занятости , при которой правительство гарантирует работу с прожиточным минимумом.
Временные меры могут включать программы общественных работ , такие как Управление ходом работ . Финансируемая государством занятость не широко пропагандируется как решение проблемы безработицы, за исключением периодов кризиса. Это объясняется тем, что существование рабочих мест в государственном секторе напрямую зависит от налоговых поступлений от занятости в частном секторе.

В США пособие по безработице зависит исключительно от предыдущего дохода (не отработанного времени, размера семьи и т. д.) и обычно компенсирует одну треть предыдущего дохода. Чтобы иметь право на участие, люди должны проживать в своем штате не менее года и работать. Система была создана Законом о социальном обеспечении 1935 года. Хотя 90% граждан охвачены страхованием по безработице, менее 40% подают заявления и получают пособия. [ 125 ] Однако во время рецессии число заявок и получателей пособий увеличивается. В отраслях с высокой сезонностью система обеспечивает доход работникам в межсезонье, тем самым поощряя их оставаться в отрасли.

Согласно классической экономической теории, рынки достигают равновесия, когда предложение равно спросу; каждый, кто хочет продать по рыночной цене, может это сделать. Те, кто не хочет продавать по этой цене, не делают этого; на рынке труда это классическая безработица. Денежно-кредитная политика и фискальная политика могут использоваться для увеличения краткосрочного роста экономики, увеличения спроса на рабочую силу и снижения безработицы.
Решения со стороны предложения
[ редактировать ]Однако рынок труда не эффективен на 100%, хотя он может быть более эффективным, чем бюрократия. Некоторый [ ВОЗ? ] утверждают, что минимальная заработная плата и деятельность профсоюзов удерживают заработную плату от падения, а это означает, что слишком много людей хотят продавать свой труд по текущей цене, но не могут. Это предполагает, что совершенная конкуренция на рынке труда существует , в частности, что ни одна организация не является достаточно крупной, чтобы влиять на уровень заработной платы, и что сотрудники имеют одинаковые способности.
Защитники [ ВОЗ? ] политики в сфере предложения считают, что такая политика может решить проблему, сделав рынок труда более гибким. К ним относятся отмена минимальной заработной платы и сокращение влияния профсоюзов. Сторонники предложения утверждают, что их реформы ускоряют долгосрочный экономический рост за счет снижения затрат на рабочую силу. Увеличение предложения товаров и услуг требует большего количества рабочих, увеличивая занятость. Это утверждается [ кем? ] что политика предложения, которая включает снижение налогов на бизнес и сокращение регулирования, создает рабочие места, снижает безработицу и уменьшает долю труда в национальном доходе. Другая политика, направленная на стимулирование предложения, включает образование, призванное сделать работников более привлекательными для работодателей.
История
[ редактировать ]
Исторические данные о безработице относительно ограничены, поскольку она не всегда признавалась или измерялась систематически. Индустриализация предполагает эффект масштаба , который часто лишает людей возможности иметь капитал для создания собственных рабочих мест и самостоятельной занятости. Человек, который не может присоединиться к предприятию или создать рабочее место, считается безработным. Поскольку отдельные фермеры, владельцы ранчо, прядильщики, врачи и торговцы объединяются в крупные предприятия, те, кто не может присоединиться или конкурировать, становятся безработными.
Признание безработицы происходило медленно по мере индустриализации и бюрократизации экономик во всем мире. До этого традиционные самодостаточные местные общества не имели понятия безработицы. Признание концепции «безработицы» лучше всего иллюстрируется хорошо документированными историческими данными в Англии. Например, в Англии XVI века не делалось различия между бродягами и безработными; обоих просто отнесли к категории « крепких нищих », которых нужно было наказать и двинуться дальше. [ 127 ]
16 век
[ редактировать ]Закрытие монастырей в 1530-х годах увеличило бедность , поскольку Римско-католическая церковь помогала бедным. наблюдался значительный рост количества огораживаний Кроме того, в период Тюдоров . Кроме того, население росло. У тех, кто не смог найти работу, стоял суровый выбор: голодать или нарушать закон. В 1535 году был составлен законопроект, призывавший к созданию системы общественных работ для решения проблемы безработицы, которые должны были финансироваться за счет налога на доход и капитал. Закон, принятый годом позже, разрешил бить и вешать бродяг. [ 128 ]
В 1547 году был принят закон, который подвергал бродяг самым суровым положениям уголовного закона: двум годам каторги и клеймению буквой «V» в качестве наказания за первое преступление и смертной казни за второе. [ 129 ] По оценкам, во время правления Генриха VIII было казнено около 72 000 человек. [ 130 ] Согласно Закону 1576 года, каждый город должен был предоставлять работу безработным. [ 131 ]
Закон о помощи бедным 1601 года , одна из первых в мире программ социального обеспечения, спонсируемых государством, провел четкое различие между теми, кто не мог работать, и теми трудоспособными людьми, которые отказались от работы. [ 132 ] Согласно законам о бедных в Англии и Уэльсе , Шотландии и Ирландии , работный дом представлял собой место, куда люди, неспособные обеспечить себя, могли пойти жить и работать. [ 133 ]
Промышленная революция до конца 19 века
[ редактировать ]
Бедность была весьма заметной проблемой в восемнадцатом веке, как в городах, так и в сельской местности. Во Франции и Британии к концу века примерно 10 процентов людей зависели от благотворительности или попрошайничества.
- Джексон Дж. Шпилфогель, 2008, Западная цивилизация: с 1500 года . Cengage Обучение. стр.566. ISBN 0-495-50287-1
К 1776 году в Англии и Уэльсе было создано около 1912 приходских и корпоративных работных домов, в которых проживало почти 100 000 нищих.
Описание нищенского жизненного уровня фабричных рабочих в Англии в 1844 году дал Фридрих Энгельс в «Положении рабочего класса в Англии в 1844 году» . [ 134 ] В предисловии к изданию 1892 года Энгельс отмечал, что крайняя бедность, о которой он писал в 1844 году, в значительной степени исчезла. Дэвид Эймс Уэллс также отметил, что к концу XIX века условия жизни в Англии улучшились и что безработица была низкой.
Дефицит и высокая цена рабочей силы в США в 19 веке были хорошо задокументированы современными отчетами, например:
«Рабочие классы сравнительно немногочисленны, но это уравновешивается и даже может быть одной из причин рвения, с которым они призывают к использованию машин почти во всех отраслях промышленности. как заменитель ручного труда, к нему повсеместно и охотно прибегают... Именно такое состояние рынка труда и такое активное обращение к машинам везде, где они могут быть применены, к которым под руководством высшего образования и интеллекта замечательное процветание Соединенных Штатов должный." [ 135 ]
- Джозеф Уитворт , 1854 г.
Нехватка рабочей силы была фактором экономики рабства в Соединенных Штатах .
По мере открытия новых территорий и проведения федеральной продажи земель необходимо было расчищать землю и строить новые усадьбы. Сотни тысяч иммигрантов ежегодно приезжали в США и находили работу на рытье каналов и строительстве железных дорог. Почти вся работа на протяжении большей части XIX века выполнялась вручную или с использованием лошадей, мулов или быков, поскольку механизации было очень мало. Рабочая неделя на протяжении большей части XIX века составляла 60 часов. Безработица временами составляла от одного до двух процентов.
Ограниченный рынок труда был фактором роста производительности, позволяя работникам сохранять или увеличивать свою номинальную заработную плату во время вековой дефляции, которая вызывала рост реальной заработной платы в разное время в XIX веке, особенно в его последние десятилетия. [ 136 ]
20 век
[ редактировать ]

наблюдалась нехватка рабочей силы Во время Первой мировой войны . [ 21 ] Ford Motor Co. удвоила заработную плату, чтобы сократить текучесть кадров. После 1925 года безработица постепенно начала расти. [ 137 ]
В 1930-е годы Великая депрессия повлияла на безработицу во всем мире. В Германии и США уровень безработицы достиг около 25% в 1932 году. [ 138 ]
В некоторых городах северо-востока Англии безработица достигала 70%; уровень безработицы в стране достиг пика более 22% в 1932 году. [ 139 ] Безработица в Канаде достигла 27% в разгар Депрессии 1933 года. [ 140 ] В 1929 году уровень безработицы в США составлял в среднем 3%. [ 141 ]

В США Управление прогрессом работ (1935–43) было крупнейшей программой временных работ. Он нанимал мужчин (и некоторых женщин) на вспомогательные должности («пособие по безработице»), как правило, для неквалифицированной работы. [ 142 ] Во время «Нового курса» более трех миллионов безработных молодых людей были выселены из своих домов и помещены на шесть месяцев в более чем 2600 трудовых лагерей, находящихся под управлением Гражданского корпуса охраны природы . [ 143 ]
Безработица в Соединенном Королевстве снизилась позже, в 1930-х годах, когда депрессия ослабла, и оставалась низкой (в однозначных цифрах) после Второй мировой войны .
Фредрик Миллс обнаружил, что в США 51% сокращения рабочего времени произошло из-за падения производства, а 49% — из-за повышения производительности. [ 144 ]
К 1972 году безработица в Соединенном Королевстве снова превысила 1 000 000, а к концу десятилетия она стала еще выше, при этом инфляция также была высокой. Хотя монетаристская экономическая политика Маргарет Тэтчер правительства консервативного привела к снижению инфляции после 1979 года, безработица резко выросла в начале 1980-х годов, а в 1982 году она превысила 3 000 000 - уровень, которого не наблюдалось около 50 лет. Это составляла каждая восьмая часть рабочей силы, при этом безработица превышала 20% в некоторых местах, которые зависели от приходящих в упадок отраслей, таких как добыча угля. [ 145 ]
Однако это было время высокого уровня безработицы и во всех других крупных промышленно развитых странах. [ 146 ] К весне 1983 года безработица выросла на 6% за предыдущие 12 месяцев по сравнению с 10% в Японии, 23% в США и 34% в Западной Германии (за семь лет до воссоединения ). [ 147 ]
Безработица в Соединенном Королевстве оставалась выше 3 000 000 до весны 1987 года, когда экономика пережила бум. [ 145 ] К концу 1989 года безработица упала до 1 600 000 человек. Однако инфляция достигла 7,8%, а в следующем году достигла девятилетнего максимума в 9,5%; что приводит к повышению процентных ставок. [ 148 ]
Еще одна рецессия произошла с 1990 по 1992 год . Безработица начала расти, и к концу 1992 года почти 3 000 000 человек в Соединенном Королевстве были безработными, и это число вскоре сократилось благодаря сильному восстановлению экономики. [ 145 ] Когда к 1993 году инфляция снизилась до 1,6%, безработица начала быстро падать и к началу 1997 года составила 1 800 000 человек. [ 149 ]
21 век
[ редактировать ]
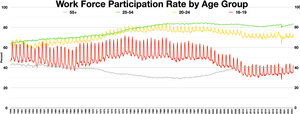
Возраст 15–24 лет (тонкая линия) – безработица среди молодежи .
Официальный уровень безработицы в 16 странах Европейского Союза (ЕС), использующих евро, вырос до 10% в декабре 2009 года в результате очередной рецессии . [ 151 ] В Латвии был самый высокий уровень безработицы в ЕС - 22,3% в ноябре 2009 года. [ 152 ] Особенно сильно пострадали молодые рабочие Европы. [ 153 ] В ноябре 2009 года уровень безработицы в ЕС-27 среди лиц в возрасте 15–24 лет составлял 18,3%. Среди лиц моложе 25 лет уровень безработицы в Испании составил 43,8%. [ 154 ] С 2010 года безработица выросла в двух третях европейских стран. [ 155 ]
В 21 веке безработица в Соединенном Королевстве оставалась низкой, а экономика оставалась сильной, а в некоторых других европейских странах, таких как Франция и Германия, произошла незначительная рецессия и значительный рост безработицы. [ 156 ]
В 2008 году, когда рецессия привела к новому росту в Соединенном Королевстве, после 15 лет экономического роста и отсутствия значительного роста безработицы. [ 157 ] В начале 2009 года безработица превысила отметку в 2 миллиона человек, и экономисты предсказывали, что вскоре она достигнет 3 миллионов. [ 158 ] Однако об окончании рецессии было объявлено в январе 2010 года. [ 159 ] а безработица достигла пика почти в 2,7 миллиона человек в 2011 году. [ 160 ] по-видимому, ослабляет опасения по поводу безработицы, достигающей 3 миллионов. [ 161 ] Уровень безработицы среди чернокожей молодежи Великобритании в 2011 году составил 47,4%. [ 162 ] В 2013/2014 году уровень занятости увеличился с 1 935 836 до 2 173 012 человек, чему способствовали [ 163 ] показывая, что Великобритания создает больше возможностей для трудоустройства, и прогнозирует, что темпы роста в 2014/2015 году составят еще 7,2%. [ 164 ]
назвали Глобальную рецессию 2008–2012 годов «мансией» из-за непропорционально большого числа мужчин, потерявших работу, по сравнению с женщинами. Гендерный разрыв стал огромным в Соединенных Штатах в 2009 году, когда 10,5% работающих мужчин были безработными по сравнению с 8% женщин. [ 165 ] [ 166 ] Три четверти рабочих мест, потерянных в результате рецессии в США, принадлежали мужчинам. [ 167 ] [ 168 ]
от 26 апреля 2005 г. В статье Asia Times отмечалось: «В региональном гиганте Южной Африке около 300 000 работников текстильной промышленности потеряли работу за последние два года из-за притока китайских товаров». [ 169 ] растущий торговый дефицит США с Китаем стоил 2,4 миллиона американских рабочих мест в период с 2001 по 2008 год. Согласно исследованию Института экономической политики (EPI), [ 170 ] С 2000 по 2007 год Соединенные Штаты потеряли в общей сложности 3,2 миллиона рабочих мест в промышленности. [ 171 ] 12,1% ветеранов вооруженных сил США, служивших после терактов 11 сентября 2001 года, по состоянию на 2011 год были безработными; 29,1% ветеранов-мужчин в возрасте 18–24 лет были безработными. [ 85 ] По состоянию на сентябрь 2016 года общий уровень безработицы среди ветеранов составлял 4,3 процента. К сентябрю 2017 года этот показатель упал до 3 процентов. [ 172 ]
Около 25 миллионов человек в 30 самых богатых странах мира потеряли работу в период с конца 2007 года по конец 2010 года, поскольку экономический спад подтолкнул большинство стран к рецессии . [ 173 ] В апреле 2010 года уровень безработицы в США составлял 9,9%, но более широкий правительственный уровень безработицы среди учащихся U-6 составлял 17,1%. [ 174 ] В апреле 2012 года уровень безработицы в Японии составил 4,6%. [ 175 ] В статье 2012 года Financial Post сообщила: «Почти 75 миллионов молодых людей во всем мире являются безработными, что на 4 миллиона больше, чем в 2007 году. В Европейском Союзе, где за финансовым кризисом последовал долговой кризис, уровень безработицы среди молодежи вырос. до 18% в прошлом году с 12,5% в 2007 году, говорится в докладе МОТ». [ 176 ] В марте 2018 года, по данным статистики безработицы в США, уровень безработицы составил 4,1%, что ниже нормы 4,5–5,0%. [ 177 ]
В 2021 году уровень участия в рабочей силе цветных женщин и женщин с детьми значительно снизился во время пандемии Covid-19: около 20 миллионов женщин покинули рабочую силу. Мужчины пострадали не так сильно, что побудило некоторых охарактеризовать это явление как «уступку женщины». [ 178 ] [ 179 ]
См. также
[ редактировать ]- Обучение планированию карьеры и жизни
- Критика работы
- Экономическая терминология, отличающаяся от общепринятого использования
- Эффективный уровень безработицы
- Законодательство о защите занятости
- Соотношение занятости и численности населения
- Экономические данные Федеральной резервной системы (FRED)
- Выпускная безработица
- Закон о найме
- Миграция рабочих мест
- Пособие для соискателя работы
- Список стран по уровню долгосрочной безработицы
- Список стран по уровню безработицы
- Список фильмов о безработице
- Список штатов США по уровню безработицы
- Список европейских регионов по уровню безработицы
- Практикующая фирма
- Отказ от работы
- Инверсия зарплаты
- Шотландская сеть безработных
- Кратковременная работа
- Пространственное несоответствие
- Технологическая безработица
- Расширение безработицы
- Универсальный базовый доход
- Ожидание
- работа
- Исключение молодежи
Примечания
[ редактировать ]- ^ «Уровень безработицы» . Наш мир в данных . Проверено 7 марта 2020 г.
- ^ «Занятость – Уровень занятости по возрастным группам – Данные ОЭСР» . ОЭСР .
- ^ Перейти обратно: а б «Статистика ОЭСР» . stats.oecd.org .
- ^ Ховинс, Кевин Х. (1987). Безработица . Пингвин. ISBN 0-14-022763-6 . OCLC 21972786 .
- ^ «Международная организация труда: Уровень безработицы» .
- ^ «Идентификационные налоговые номера (ИНН) — Организация экономического сотрудничества и развития» .
- ^ Хайек, ФА (1960). Конституция страны . Чикаго: Издательство Чикагского университета.
- ^ Перейти обратно: а б с Андертон, Ален (2006). Экономика (Четвертое изд.). Ормскирк: Дорога. ISBN 978-1-902796-92-5 .
- ^ Гареньани, П. (1970). «Неоднородный капитал, производственная функция и теория распределения». Обзор экономических исследований . 37 (3): 407–436. дои : 10.2307/2296729 . JSTOR 2296729 .
- ^ Вьенно, Роберт Л. (2005). «О спросе на труд и равновесии фирмы». Манчестерская школа . 73 (5): 612–619. дои : 10.1111/j.1467-9957.2005.00467.x . S2CID 153778021 .
- ^ Опочер, Арриго; Стидман, Ян (2009). «Отношения входной цены и входного количества и нумерация». Кембриджский экономический журнал . 3 (5): 937–948. дои : 10.1093/cje/bep005 .
- ^ Аньядике-Дейнс, Майкл; Годли, Вайн (1989). «Реальная заработная плата и занятость: скептический взгляд на некоторые недавние эмпирические работы». Манчестерская школа . 62 (2): 172–187. дои : 10.1111/j.1467-9957.1989.tb00809.x .
- ^ Уайт, Грэм (2001). «Бедность традиционной экономической мудрости и поиск альтернативной экономической и социальной политики» . Чертежная доска: австралийский обзор связей с общественностью . 2 (2): 67–87.
- ^ Ротбард, Мюррей (1963). Великая депрессия Америки . Принстон: Ван Ностранд. п. 45.
- ^ Веддер, Ричард; Галлауэй, Лоуэлл (1997). Без работы: безработица и правительство в Америке двадцатого века . Нью-Йорк: Нью-Йоркский университет Пресс. ISBN 978-0-8147-8792-2 .
- ^ Перейти обратно: а б Кейнс, Джон Мейнард (2007) [1936]. Общая теория занятости, процента и денег . Бейзингсток, Хэмпшир: Пэлгрейв Макмиллан. ISBN 978-0-230-00476-4 . Архивировано из оригинала 16 марта 2009 года.
- ^ Харрис, Сеймур Э. (2005). Новая экономика: влияние Кейнса на теорию и государственную политику . Издательство Кессинджер. ISBN 978-1-4191-4534-6 .
- ^ Перейти обратно: а б с д Чанг, Р. (1997) «Является ли низкий уровень безработицы инфляционным?» Архивировано 13 ноября 2013 г. в журнале Wayback Machine Федерального резервного банка Атланты Economic Review, 1Q97: 4–13.
- ^ Перейти обратно: а б с Оливер Хоссфельд (2010) «Спрос на деньги в США, монетарный избыток и прогноз инфляции», рабочий документ Международной сети экономических исследований №. 2010.4
- ^ «Скорость МЗМ» . Research.stlouisfed.org. 20 декабря 2012 года . Проверено 1 марта 2014 г.
- ^ Перейти обратно: а б с Джером, Гарри (1934). Механизация промышленности, Национальное бюро экономических исследований .
- ^ Комлос, Джон (2019). Реальный уровень безработицы в США в два раза превышает официальный уровень, и это кривая Филлипса (PDF) . Рабочий документ CesIfo № 7859. стр. 54–74.
- ^ Бивенс, Джош; Ширхольц, Хайди, Почему долгосрочная безработица остается такой высокой, а не безработица, отстающий спрос, Институт экономической политики
- ^ «РЕКОМЕНДАЦИЯ СОВЕТА от 15 февраля 2016 года об интеграции длительно безработных на рынок труда» . Официальный журнал Европейского Союза . 20 февраля 2016 г. 2016/C 67/01.
- ^ «Проект LTU – Проект долгосрочной безработицы – ЕВРОПЕЙСКИЙ СОЦИАЛЬНЫЙ ФОНД – Европейская Комиссия» . ЕВРОПЕЙСКИЙ СОЦИАЛЬНЫЙ ФОНД . Проверено 11 марта 2021 г.
- ^ «Комиссия публикует отчет о реинтеграции длительно безработных» . ec.europa.eu . Проверено 11 марта 2021 г.
- ^ Перейти обратно: а б Маркс, Карл (1863). Теории прибавочной стоимости . стр. 478 или на MEW, 26.3, 300.
- ^ «Маркс и Кейнс о безработице» . Архивировано из оригинала 15 июня 2018 года . Проверено 15 июня 2018 г.
- ^ Маркс, Карл (2009). Капитал: Сокращенное издание. Под редакцией Дэвида Маклеллана, Oxford Paperbacks, Оксфорд, Великобритания. ISBN 978-0-19-953570-5 .
- ^ «Коммунистический манифест (глава 1)» .
- ^ «Словарь терминов: Эл» .
- ^ Маркс, Карл. «Коммунистический манифест» . Проверено 22 октября 2010 г.
- ^ «Международные уровни безработицы: насколько они сопоставимы?» Констанс Соррентино, Monthly Labor Review, июнь 2000 г., стр. 3–20.
- ^ Перейти обратно: а б Статистическое бюро Международной организации труда. Измерение занятости, безработицы и неполной занятости – современные международные стандарты и проблемы их применения . Проверено в августе 2010 г. Архивировано 24 сентября 2011 г. в Wayback Machine.
- ^ Международная организация труда, Статистическое бюро, Тринадцатая Международная конференция статистиков труда , получено 21 июля 2007 г.
- ^ Перейти обратно: а б Цукерман, Сэм (17 ноября 2002 г.). «Официальные данные по безработице не включают отчаявшихся искателей, работников, работающих неполный рабочий день» . Хроники Сан-Франциско . Архивировано из оригинала 29 июня 2011 года . Проверено 27 июля 2011 г.
- ^ Кой, П. (11 сентября 2012 г.). Уровень безработицы в США падает по худшей из всех причин. Businessweek.Com, 5.
- ^ «Глоссарий: Безработица» . Евростат.
- ^ «Глоссарий: Рабочая сила» . Евростат.
- ^ «Уровень безработицы» . Организация экономического сотрудничества и развития (ОЭСР).
- ^ «Занятость, социальные вопросы и инклюзивность» . Европейская комиссия.
- ^ «Помощь по безработице» . Сайт правительства США.
- ^ «Уровень безработицы» . Федеральное статистическое управление.
- ^ «Статистика рабочей силы на основе текущего обследования населения» . Бюро статистики труда.
- ^ «Глоссарий: Обследование рабочей силы (ОРС)» . Евростат.
- ^ Международная организация труда, LABORSTA, [1] Архивировано 7 июля 2007 г. в Wayback Machine . Проверено 22 июля 2007 г.
- ^ Шмитт, Джон; Ро, Хе Джин; Фремстад, Шон. Безработица в США сейчас такая же высокая, как и в Европе. Центр экономических и политических исследований. Май 2009.
- ^ «Резолюция I Резолюция о статистике труда, занятости и недоиспользования рабочей силы» (PDF) . МОТ.
- ^ Марко Джуни, изд. Книга «Спорная политика безработицы в Европе: государства всеобщего благосостояния и политические возможности» (Palgrave Macmillan; 2011) охватывает Великобританию, Францию, Германию, Италию, Швецию и Швейцарию.
- ^ «Европейская комиссия, Евростат» . Архивировано из оригинала 26 ноября 2009 года . Проверено 5 ноября 2009 г.
- ^ Бюро статистики труда (2009 г.). «Данные о рабочей силе по округам, среднегодовые показатели за 2008 год» . [ постоянная мертвая ссылка ]
- ^ США, Бюро статистики труда, [2] . Проверено 23 июля 2007 г.
- ^ Министерство труда США, Бюро статистики труда, обзор текущего обследования населения . Проверено 25 мая 2007 г.
- ^ Перейти обратно: а б Министерство труда США, Бюро статистики труда, « Ситуация с занятостью: январь 2008 г. », январь 2008 г.
- ^ Министерство труда США, Управление по трудоустройству и обучению, Управление безопасности трудовых ресурсов, Еженедельные заявления по страховому полису.
- ^ «Ситуация с трудоустройством: февраль 2010 г.» (PDF) . Проверено 16 декабря 2010 г.
- ^ «Краткая информация о ситуации с трудоустройством» . Бюро статистики труда. 8 июля 2011 года . Проверено 27 июля 2011 г.
- ^ Министерство труда США, Бюро статистики труда, Таблица A-15. Альтернативные меры недоиспользования рабочей силы. Дата обращения 5 августа 2010 г.
- ^ «Статистика рабочей силы (CPS), альтернативные меры от U-1 до U-6» . Бюро статистики труда. 6 января 2012 года . Проверено 6 января 2012 г.
- ^ Международная организация труда (октябрь 1982 г.). «Резолюция о статистике экономически активного населения, занятости, безработицы и неполной занятости, принятая Тринадцатой Международной конференцией статистиков труда; см. стр. 4» (PDF) . Проверено 26 ноября 2007 г.
- ^ Бреггер, Джон Э.; Хауген, Стивен Э. (1995). «BLS представляет новый спектр альтернативных мер по безработице» (PDF) . Ежемесячный обзор труда, 19–29 октября . Министерство труда США, Бюро статистики труда . Проверено 6 марта 2009 г.
- ^ Хонатан Хорн (24 апреля 2013 г.). «Представитель Хантера стремится изменить метод отчетности по безработице» . Сан-Диего Юнион Трибьюн . Архивировано из оригинала 3 декабря 2013 года . Проверено 23 июня 2013 г.
Молли К. Хупер (8 апреля 2012 г.). «Законодатель Республиканской партии призывает изменить методы измерения безработицы правительством» . Холм . Архивировано из оригинала 24 июня 2013 года . Проверено 23 июня 2013 г.
Мэтт Несто (2 августа 2012 г.). «Уровень безработицы — это фарс, который нужно исправить: член палаты представителей Дункан Хантер» . Yahoo! Финансы . Проверено 23 июня 2013 г. - ^ «Десятилетие наказаний: оценки тюрем и тюрем на тысячелетие» (PDF) . Институт политики правосудия. Май 2000 года.
- ^ Вестерн, Брюс; Беккет, Кэтрин (1999). «Насколько нерегулируемый рынок труда в США? Уголовно-исполнительная система как институт рынка труда». Американский журнал социологии . 104 (4): 1030–1060. дои : 10.1086/210135 . S2CID 27785866 .
- ^ Перейти обратно: а б с д Леберготт, Стэнли (1964). Рабочая сила в экономическом росте: американский рекорд с 1800 года . Нью-Йорк: МакГроу-Хилл. стр. 164–190 .
- ^ Ромер, Кристина (1986). «Ложная волатильность исторических данных по безработице». Журнал политической экономии . 94 (1): 1–37. дои : 10.1086/261361 . JSTOR 1831958 . S2CID 15302777 .
- ^ Коэн, Роберт М. (1973). «Рабочая сила и безработица в 1920-х и 1930-х годах: пересмотр на основе послевоенного опыта». Обзор экономики и статистики . 55 (1): 46–55. дои : 10.2307/1927993 . JSTOR 1927993 .
- ^ Бюро статистики труда. «Статус занятости гражданского неинституционального населения с 1940 года по настоящее время» . Проверено 6 марта 2009 г. [ постоянная мертвая ссылка ]
- ^ «Историческая сопоставимость» (PDF) . Занятость и доходы. Пояснительные примечания к данным домохозяйств, февраль 2006 г. 2006.
- ^ Перейти обратно: а б с Крюгер, Алан Б.; Лоуренс Ф. Кац (1999). «Новая тенденция в безработице?: Напряженный рынок труда США 1990-х годов» . Обзор Брукингса . Архивировано из оригинала 11 мая 2011 года . Проверено 18 февраля 2011 г.
- ^ «Сообщение о мошенничестве с выплатой пособий» . Директгов . Проверено 27 июля 2011 г.
- ^ Бейкер, Дин. «Wall Street Journal неправильно оценивает уровень безработицы в Германии» . Американский проспект . Архивировано из оригинала 30 сентября 2007 года . Проверено 1 июня 2007 г.
- ^ Раймонд Торрес, глава отдела анализа занятости ОЭСР, уровень безработицы, снизившийся на 1,2% в конце апреля, продолжает снижаться. [ постоянная мертвая ссылка ] Le Monde , 30 мая 2007 г.: Показатель безработицы становится все менее значимым для измерения эффективности рынка труда.
- ^ «Определение пика экономической активности в декабре 2007 года» . Национальное бюро экономических исследований. 28 ноября 2008 г. Архивировано из оригинала 5 сентября 2013 г. Проверено 27 июля 2011 г.
- ^ «Работницы-женщины в Британской промышленной революции – EH.net» . Проверено 12 июня 2024 г.
- ^ Перейти обратно: а б Уровень участия в гражданской рабочей силе: женщины Федеральный резервный банк Сент-Луиса
- ^ Ван Зандвеге, Виллем. «Интерпретация недавнего снижения участия в рабочей силе» (PDF) . Экономический обзор ФРС KC, первый квартал 2012 г .: 5–34. Архивировано из оригинала (PDF) 15 января 2013 года . Проверено 22 апреля 2013 г.
- ^ Питер Барт и Деннис Хеффли «Разборка и участие: уровень участия местной рабочей силы» Университет Коннектикута, 2004.
- ^ «Статистика безработицы – объяснение статистики» . Epp.eurostat.ec.europa.eu . Проверено 1 марта 2014 г.
- ^ «Файл: Безработица среди молодежи, четвертый квартал 2012 г. (%).png — объяснение статистики» . Epp.eurostat.ec.europa.eu . Проверено 1 марта 2014 г.
- ^ Кастельс-Кинтана, Давид; Висенте Ройуэла (2012). «Безработица и долгосрочный экономический рост: роль неравенства доходов и урбанизации» (PDF) . Региональные исследования . 12 (24): 153–173. hdl : 10017/27066 . Проверено 17 октября 2013 г.
- ^ Кристофферсен, Джон (14 октября 2013 г.). «Растущее неравенство — самая важная проблема», — говорит экономист, лауреат Нобелевской премии» . Пост-отправка Сент-Луиса . Проверено 19 октября 2013 г.
- ^ «Бездомные из пригорода: растущая волна семей» . Новости CBS . 16 февраля 2010 года. Архивировано из оригинала 19 февраля 2010 года . Проверено 30 мая 2010 г.
- ^ Беркман, Оливер (26 марта 2009 г.). «Палаточные городки США подчеркивают новые реалии по мере того, как рецессия продолжается» . Хранитель . Лондон.
- ^ Перейти обратно: а б Мид, Барбара Дж.; Гленн, Маргарет К.; Вирт, Оливер (29 марта 2013 г.). «Критическая миссия: вернуть ветеранов с посттравматическим стрессовым расстройством на работу» . NIOSH: Безопасность и здоровье на рабочем месте . Медскейп и НИОШ.
- ^ «Даже оптимисты грустят, когда нападают на розовые» . Новости . Проверено 27 октября 2008 г.
- ^ Бреннер, М. Харви (1979). «Влияние социальной среды на психологию: историческая перспектива». В Барретте, Джеймс Э. (ред.). Стресс и психические расстройства . Нью-Йорк: Рэйвен Пресс. ISBN 978-0-89004-384-4 .
- ^ Ричард Эшли (2007). «Информационный бюллетень о влиянии безработицы» (PDF) . Технологический институт Вирджинии, факультет экономики. Архивировано из оригинала (PDF) 25 октября 2007 года . Проверено 11 октября 2007 г.
- ^ Рум, Кристофер (2000). «Полезны ли рецессии для вашего здоровья?» (PDF) . Ежеквартальный экономический журнал . 115 (2): 617–650. дои : 10.1162/003355300554872 . S2CID 51729569 .
- ^ Бойс, Кристофер Дж.; Вуд, Алекс М.; Браун, Гордон Д.А. (2010). «Темная сторона добросовестности: добросовестные люди испытывают большее падение удовлетворенности жизнью после безработицы». Журнал исследований личности . 44 (4): 535–539. дои : 10.1016/j.jrp.2010.05.001 .
- ^ Бокерман, Петри; Ильмакуннас, Пекка (2009). «Безработица и самооценка здоровья: данные панельных данных» (PDF) . Экономика здравоохранения . 18 (2): 161–179. CiteSeerX 10.1.1.719.5903 . дои : 10.1002/гек.1361 . ПМИД 18536002 .
- ^ Блюстейн, Дэвид Л.; Козан, Салиха; Коннорс-Келлгрен, Алиса (2013). «Безработица и неполная занятость: повествовательный анализ потерь» . Журнал профессионального поведения . 82 (3): 256–265. дои : 10.1016/j.jvb.2013.02.005 .
- ^ Ковицци, Илария (1 июля 2008 г.). «Приводит ли роспуск профсоюза к безработице? Продольное исследование здоровья и риска безработицы для женщин и мужчин, переживающих разделение». Европейское социологическое обозрение . 24 (3): 347–361. дои : 10.1093/esr/jcn006 . ISSN 0266-7215 .
- ^ Амато, Пол Р.; Битти, Бретт (1 мая 2011 г.). «Влияет ли уровень безработицы на количество разводов? Анализ государственных данных за 1960–2005 годы». Социально-научные исследования . 40 (3): 705–715. дои : 10.1016/j.ssresearch.2010.12.012 .
- ^ Меер, Питер Х. ван дер (21 ноября 2012 г.). «Гендер, безработица и субъективное благополучие: почему быть безработным для мужчин хуже, чем для женщин». Исследование социальных показателей . 115 (1): 23–44. дои : 10.1007/s11205-012-0207-5 . ISSN 0303-8300 . S2CID 145056657 .
- ^ Перейти обратно: а б Фанг, Тони; Макфейл, Фиона (27 ноября 2007 г.). «Переход от временной к постоянной работе в Канаде: кто осуществляет переход и почему?». Исследование социальных показателей . 88 (1): 51–74. дои : 10.1007/s11205-007-9210-7 . hdl : 10315/6293 . ISSN 0303-8300 . S2CID 154555810 .
- ^ Мичневич, Кеннет С.; Ванделло, Джозеф А.; Боссон, Дженнифер К. (19 января 2014 г.). «(Неправильное) восприятие мужчинами гендерно угрожающих последствий безработицы». Сексуальные роли . 70 (3–4): 88–97. дои : 10.1007/s11199-013-0339-3 . ISSN 0360-0025 . S2CID 144321429 .
- ^ Перед лицом проблемы: влияние рецессии и безработицы на мужское здоровье в Ирландии (PDF) , Институт общественного здравоохранения Ирландии, июнь 2011 г.
- ^ Социальная изоляция – ключевой фактор риска самоубийства среди австралийских мужчин – исследование . Хранитель . Автор - Мелисса Дэйви. Опубликовано 25 июня 2015 г. Проверено 9 августа 2018 г.
- ^ Ли, Анг; Толл, Мэтью (2021). «Влияние получения высшего образования во время экономического спада на психическое здоровье» . Анналы эпидемиологии . 55 (55): 41–49. doi : 10.1016/j.annepidem.2020.12.005 . ISSN 1047-2797 . ПМИД 33359536 . S2CID 229693054 .
- ^ Перейти обратно: а б Кабери Гайен; Рональд Маккуэйд; Роберт Рэсайд (22 июня 2010 г.). «Социальные сети, возрастные когорты и занятость». Международный журнал социологии и социальной политики . 30 (5/6): 219–238. дои : 10.1108/01443331011054208 . ISSN 0144-333X .
- ^ Джейкоб, Марита; Кляйнерт, Коринна (1 апреля 2008 г.). «Помогает или мешает безработица стать независимым? Роль статуса занятости для ухода из родительского дома». Европейское социологическое обозрение . 24 (2): 141–153. дои : 10.1093/esr/jcm038 . hdl : 10419/31878 . ISSN 0266-7215 .
- ^ Рэй-Лейк, Лаура; Сиверцен, Эми К.; Бридделл, Лейн; Осгуд, Д. Уэйн; Фланаган, Констанс А. (1 сентября 2011 г.). «Изучение изменения значения работы для американских старшеклассников с 1976 по 2005 год» . Молодежь и общество . 43 (3): 1110–1135. дои : 10.1177/0044118X10381367 . ISSN 0044-118X . ПМК 3199574 . ПМИД 22034546 .
- ^ МакВитти, Крис; МакКинли, Энди; Виддикомб, Сью (2008). «Пассивная и активная безработица: возраст, занятость и личность пожилых неработающих людей». Журнал исследований старения . 22 (3): 248–255. дои : 10.1016/j.jaging.2007.04.003 .
- ^ «Теория цен: первое издание, глава 22: Инфляция и безработица» . Daviddfriedman.com . Проверено 27 июля 2011 г.
- ^ Штайнингер, М.; Ротте, Р. (2009). «Преступность, безработица и ксенофобия?: Экологический анализ результатов выборов правых в Гамбурге, 1986–2005 гг.». Ежегодник региональных исследований . 29 (1): 29–63. дои : 10.1007/s10037-008-0032-0 . S2CID 161133018 .
- ^ Сара Бозли (11 февраля 2015 г.). По данным исследования, безработица является причиной 45 000 самоубийств в год во всем мире . Хранитель . Проверено 13 февраля 2015 г.
- ^ Сулич, Адам (2016). «Рынок труда молодежи и кризис интеграции в Евросоюзе» . Международная конференция по европейской интеграции . 2 : 926–934.
- ^ Почему мы боимся создавать нужные нам рабочие места? , Лес Леопольд, 5 марта 2010 г.
- ^ «Что случилось с полной занятостью?» . Новости Би-би-си . 13 октября 2011 г.
- ^ Натале, Сэмюэл; Ротшильд, Брайан (1995). Трудовые ценности: образование, организация и религиозные проблемы (серия книг «Оценочные исследования», № 28) . Брилл Родопи. стр. 91–100.
- ^ Хэ, Сяохун (1998). «От торговли между странами к торговле внутри фирм через национальные границы». В Муккелли, Жан Луи; Бакли, Питер Дж.; Корделл, Виктор В. (ред.). Глобализация и регионализация: стратегии, политика и экономическая среда . Бингемтон, Нью-Йорк: Международная деловая пресса. стр. 15–73. ISBN 978-0-7890-0513-7 .
- ^ «Что на самом деле означает полная занятость» . Экономист . 2017.
- ^ Шапиро, Карл; Стиглиц, Джозеф Э. (1984). «Равновесная безработица как средство дисциплинарного воздействия». Американский экономический обзор . 74 (3): 433–444. JSTOR 1804018 .
- ^ «Эффективная заработная плата, модель Шапиро-Стиглица» (PDF) . Архивировано из оригинала (PDF) 15 июля 2011 года . Проверено 27 июля 2011 г.
- ^ О'Салливан, Артур ; Шеффрин, Стивен М. (2003). Экономика: принципы в действии . Река Аппер-Седл, Нью-Джерси: Пирсон Прентис Холл. п. 335 . ISBN 978-0-13-063085-8 .
- ^ Ричард, Майкл Грэм (2 июня 2008 г.). «Контрапункт: 4 причины, почему рецессия вредна для окружающей среды» . ДревоХаггер . Архивировано из оригинала 9 февраля 2008 года . Проверено 11 февраля 2008 г.
- ^ «Фонд праздности» . Архивировано из оригинала 9 июля 2012 года . Проверено 26 августа 2018 г.
- ^ «Часы работы в истории США» . 2010. Архивировано из оригинала 26 октября 2011 года.
- ^ Уэплс, Роберт (1991). «Сокращение американской рабочей недели: экономический и исторический анализ его контекста, причин и последствий». Журнал экономической истории . 51 (2): 454–457. дои : 10.1017/s0022050700039073 . JSTOR 2122588 . S2CID 153813437 .
- ^ Белл, Сперджен (1940). Производительность, заработная плата и национальный доход, Институт экономики Брукингского института .
- ^ Ховард, Дональд С. (1943). WPA и Федеральная политика помощи . п. 34.
- ^ Сломан, Джон (2003). Экономика . Лондон: Прентис Холл. п. 811 . ISBN 978-0-273-65574-9 .
- ^ Бэдхэм, Ван (26 июля 2019 г.). «Наличие постоянного количества безработных — это целенаправленная политика | Ван Бэдэм» . Хранитель . ISSN 0261-3077 . Проверено 24 октября 2019 г.
- ^ «Введение в страхование по безработице» . Центр бюджетных и политических приоритетов . 15 декабря 2008 года . Проверено 21 октября 2010 г.
- ^ «Снижение налогов для создателей рабочих мест» . Нью-Йорк Таймс . 19 октября 2012 г.
- ^ «Крепкие нищие» . Пробертенциклопедия.com. Архивировано из оригинала 8 июня 2011 года . Проверено 22 июля 2009 г.
- ^ «Бедные Тюдоры» . Местные истории.орг . Проверено 22 июля 2009 г.
- ^ Р.О. Бухольц, Ньютон Ки, Англия раннего Нового времени, 1485–1714, стр. 176.
- ^ « История смертной казни ». Служба общественного вещания (PBS).
- ^ « Бедность в елизаветинской Англии ». Би-би-си – История.
- ^ « Социальные классы в Англии Шекспира ». Архивировано 16 марта 2010 г. в Wayback Machine.
- ^ « Британская социальная политика, 1601–1948 гг. Архивировано 30 июня 2007 г. в Wayback Machine », Университет Роберта Гордона, Абердин.
- ^ Энгельс, Фридрих (1892). Положение рабочего класса в Англии в 1844 году . Лондон: Swan Sonnenschein & Co., стр. 45, 48–53. Архивировано из оригинала 12 октября 2014 года . Проверено 21 декабря 2011 г. Ссылка на отрывок
- ^ Роу, Джозеф Уикхэм (1916), английские и американские производители инструментов , Нью-Хейвен, Коннектикут: издательство Йельского университета, LCCN 16011753 . Перепечатано McGraw-Hill, Нью-Йорк и Лондон, 1926 г. ( LCCN 27-24075 ); и Lindsay Publications, Inc., Брэдли, Иллинойс ( ISBN 978-0-917914-73-7 ). Отчет британских комиссаров на Нью-Йоркской промышленной выставке, Лондон, 1854 г.
- ^ Уэллс, Дэвид А. (1891). Недавние экономические изменения и их влияние на производство и распределение богатства и благосостояние общества . Д. Эпплтона и Ко. Нью-Йорк: ISBN 978-0-543-72474-8 .
ПОСЛЕДНИЕ ЭКОНОМИЧЕСКИЕ ИЗМЕНЕНИЯ И ИХ ВЛИЯНИЕ НА РАСПРЕДЕЛЕНИЕ БОГАТСТВА И БЛАГОСОСТОЯНИЕ ОБЩЕСТВА.
- ^ Бодро, Бернар К. (1996). Массовое производство, крах фондового рынка и Великая депрессия . Нью-Йорк, Линкольн, Шанги: Выбор авторов.
- ↑ О Великой депрессии. Архивировано 20 декабря 2008 года в Wayback Machine , Университет Иллинойса.
- ^ «Социальные условия в Великобритании в 1930-е годы: занятость и безработица» . Blacksacademy.net. Архивировано из оригинала 10 сентября 2011 года . Проверено 27 июля 2011 г.
- ^ 1929–1939 - Великая депрессия. Архивировано 27 января 2009 года в Wayback Machine , Источник: Банк Канады.
- ^ Экономическое восстановление во время Великой депрессии , Фрэнк Г. Стейндл, Университет штата Оклахома. Архивировано 28 сентября 2013 г. в Wayback Machine.
- ^ Нэнси Э. Роуз, «На работу: WPA и государственная занятость во время Великой депрессии» (2-е изд. 2009 г.)
- ^ Финеган, Ченс (11 сентября 2008 г.). «История национального парка: «Дух Гражданского корпуса охраны природы» » . Путешественник по национальным паркам. Архивировано из оригинала 5 сентября 2010 года . Проверено 27 июля 2011 г.
- ^ Рифкин, Джереми (1995). Конец труда: упадок глобальной рабочей силы и начало пострыночной эры . Издательская группа Патнэма. ISBN 978-0-87477-779-6 .
- ^ Перейти обратно: а б с «Безработица, брифинг по вопросу» . Politics.co.uk. Архивировано из оригинала 9 июня 2011 года . Проверено 27 июля 2011 г.
- ^ Фелпс, Эдмунд С .; Зоега, Гильфи (2002). «Рост безработицы в Группе семи, 1970–94». В Битросе, Джордж; Кацулакос, Яннис (ред.). Очерки по экономической теории, экономическому росту и рынкам труда . Челтнем: Эдвард Элгар. стр. 177–210. ISBN 978-1-84064-739-6 .
- ^ «Коллекция плакатов CPA» . Коллекция архивных плакатов Консервативной партии. Архивировано из оригинала 12 августа 2011 года . Проверено 17 октября 2018 г.
- ^ «Историческая инфляция и конверсия цен в Великобритании» . Сайт Сафальры. 15 апреля 2010 года. Архивировано из оригинала 30 августа 2012 года . Проверено 27 июля 2011 г.
- ^ «Уровень безработицы в Британии упал до шестилетнего минимума» . Нью-Йорк Таймс . 16 января 1997 года . Проверено 27 июля 2011 г.
- ^ Статистика рабочей силы ОЭСР 2020 , ОЭСР, 2020, doi : 10.1787/23083387 , ISBN 9789264687714
- ^ « Безработица в еврозоне выросла до 10 процентов . Deutsche Welle . 29 января 2010 г.
- ^ « Безработица в еврозоне достигла двузначных цифр ». ЮПИ.com. 8 января 2010 г.
- ^ « Новое потерянное поколение Европы ». Внешняя политика. 13 июля 2009 г.
- ^ Ноябрь 2009 г. Уровень безработицы в еврозоне вырос до 10,0%, в ЕС-27 - до 9,5% . Евростат . 8 января 2010 г.
- ^ « Перспективы мировой безработицы мрачны, предупреждает МОТ . The Guardian . 30 апреля 2012 г.
- ^ «Рецессия в Германии заканчивается» . Новости Би-би-си . 23 мая 2002 года . Проверено 27 июля 2011 г.
- ^ «Рост безработицы самый высокий за 17 лет» . Новости Би-би-си . 15 октября 2008 года . Проверено 27 июля 2011 г.
- ^ «Безработица превышает два миллиона» . Новости Би-би-си . 18 марта 2009 года . Проверено 27 июля 2011 г.
- ^ «Экономика Великобритании выходит из рецессии» . Новости Би-би-си . 27 января 2010 г. Проверено 27 июля 2011 г.
- ^ «Безработица среди молодежи в Великобритании достигла самого высокого уровня за два десятилетия: 22,5%» . МеркоПресс . 15 апреля 2012 г.
- ^ «Безработица в Великобритании выросла до 2,5 миллионов» . Новости Би-би-си . 21 апреля 2010 года . Проверено 27 июля 2011 г.
- ^ Болл, Джеймс; Милмо, Дэн; Фергюсон, Бен (9 марта 2012 г.). «Половина молодых чернокожих мужчин Великобритании безработны» . Хранитель . Лондон.
- ^ http://www.ons.gov.uk/ons/publications/2014_2015re-reference-tables.html?edition=tcm%3A77-226710 [ мертвая ссылка ]
- ^ "Данные" . ons.gov.uk. ОНС.
- ^ Бакстер, Сара (7 июня 2009 г.), «Женщины - победители в« особняке » » , The Sunday Times , Лондон , получено 12 мая 2010 г.
- ^ Ховард Дж. Уолл (октябрь 2009 г.), «Человек-цессия» 2008-2009 гг. , Федеральный резервный банк Сент-Луиса, заархивировано из оригинала 29 августа 2014 г. , получено 26 марта 2020 г.
- ^ Даум, Меган (20 октября 2011 г.), «Внутри экономики спаривания» , Los Angeles Times.
- ^ Вандеркам, Лаура (4 марта 2012 г.), «Проблема принцессы» , первоначально вышла в эфир в USA Today 12 августа 2009 г.
- ^ « Азия лишает текстильную промышленность Африки ». Азия Таймс . 26 апреля 2005 г.
- ^ « Торговля Китая виновата в потере 2,4 миллиона рабочих мест в США – отчет ». Рейтер. 23 марта 2010 г.
- ^ « Рабочие места на заводе: с 2000 года потеряно 3 миллиона человек ». США сегодня . 20 апреля 2007 г.
- ^ Райли, Ким (11 октября 2017 г.). «Коммунальные предприятия открывают возможности трудоустройства для ветеранов вооруженных сил США» . Ежедневный инсайдер энергии . Проверено 23 октября 2017 г.
- ^ « Безработица достигла самого высокого уровня с 1995 года ». 16 сентября 2009 г.
- ^ « Более широкий уровень безработицы среди школьников до 6 лет увеличился до 17,1% в апреле ». Уолл Стрит Джорнал . 7 мая 2010 г.
- ^ Статистика безработицы . Евростат . Апрель 2012.
- ^ «Глобальный уровень безработицы среди молодежи растет» . Финансовый пост . Business.financialpost.com. 23 мая 2012 года . Проверено 1 марта 2014 г.
- ^ АМАДЕО, КИМБЕРЛИ (апрель 2018 г.). «Текущая статистика и новости уровня безработицы в США» . Баланс .
- ^ «Она-цессия: как пандемия вынудила женщин уйти с работы и как на это могут отреагировать работодатели» . Огайолин . 20 января 2022 г. Проверено 3 июня 2023 г.
- ^ Лим, Кэтрин; Забек, Майк (28 февраля 2022 г.). «Цветные женщины и женщины с детьми непропорционально часто уходили с рабочей силы во время пандемии COVID-19» . Федеральный резервный банк Миннеаполиса . Проверено 3 июня 2023 г.
Ссылки
[ редактировать ]- Фермер, Роджер Э.А. (2001). «Безработица». Макроэкономика (Второе изд.). Цинциннати: Юго-Западное издательство. стр. 173–192. ISBN 978-0-324-14964-7 .
- Калецкий, Михал (1943). «Политические аспекты полной занятости» (PDF) . Политический ежеквартальный журнал . 14 (4): 322–331. дои : 10.1111/j.1467-923X.1943.tb01016.x .
- Макгоги, Юэн (сентябрь 2022 г.). «Автоматизируют ли роботы вашу работу? Полная занятость, базовый доход и экономическая демократия» . (2022) 51(3) Журнал промышленного права 511–559 . дои : 10.2139/ssrn.3044448 . S2CID 219336439 . ССНР 3044448 .
- Райх, Роберт Б. (2010). Афтершок: следующая экономика и будущее Америки (1-е изд.). Альфред А. Кнопф. ISBN 978-0-307-59281-1 .
- Ромер, Дэвид (2011). «Безработица». Продвинутая макроэкономика (Четвертое изд.). Нью-Йорк: Образование Макгроу-Хилл. стр. 456–512. ISBN 978-0-07-351137-5 .
- Симонацци, Аннамария; Вианелло, Фернандо (2001). «Финансовая либерализация, единая европейская валюта и проблема безработицы». В Франзини, М.; Пиццути, Франция (ред.). Глобализация, институты и социальная сплоченность . Гейдельберг: Спрингер. ISBN 978-3-540-67741-3 .
Исторический: Европа и Япония
[ редактировать ]- Беверидж, Уильям Х. (1944). Полная занятость в свободном обществе (1-е изд.). Аллен и Анвин. , в Великобритании.
- Бродберри, Стивен Н. и Альбрехт Ритчль. «Реальная заработная плата, производительность и безработица в Великобритании и Германии в 1920-е годы». Исследования по экономической истории 32.3 (1995): 327–349.
- Димсдейл, Николас Х., Николас Хорсвуд и Артур Ван Риель. «Безработица в межвоенной Германии: анализ рынка труда, 1927-1936». Журнал экономической истории (2006): 778-808. онлайн
- Хаймбергер, Филипп, Якоб Капеллер и Бернхард Шютц. «Детерминанты NAIRU: что структурного в безработице в Европе?». Журнал политического моделирования 39.5 (2017): 883-908. онлайн
- Като, Мичия. «Политика безработицы и общественных работ в межвоенной Великобритании и Японии: международное сравнение». (2010): 69-101. онлайн
- Кауфман, Роджер Т. «Модели безработицы в Северной Америке, Западной Европе и Японии». Безработица в западных странах (Palgrave Macmillan, 1980). 3-35.
- Никелл, Стивен, Лука Нунциата и Вольфганг Охель. «Безработица в ОЭСР с 1960-х годов. Что мы знаем?». Экономический журнал 115.500 (2005): 1–27 онлайн .
- Стахура, П.Д. (1986). Безработица и Великая депрессия в Веймарской Германии . Пэлгрейв Макмиллан, Великобритания. ISBN 978-1-349-18355-5 . Проверено 3 июня 2023 г.
- Топп, Нильс-Хенрик. «Безработица и экономическая политика в Дании в 1930-е годы». Обзор экономической истории Скандинавии 56.1 (2008): 71-90.
- Уэбб, Сидней (1912). Как правительство может предотвратить безработицу . Национальный комитет по предотвращению нищеты. (Первое изд.). Летчворт, Хертс: Garden City Press Ltd. , Великобритания.
Исторический: США
[ редактировать ]- Дженсен, Ричард Дж. «Причины и способы лечения безработицы во время Великой депрессии». Журнал междисциплинарной истории 19.4 (1989): 553-583 онлайн .
- Кейсар, Александр (1986). Без работы: первый век безработицы в Массачусетсе . Издательство Кембриджского университета. ISBN 978-0-521-23016-2 .
- Марго, Роберт А. «Занятость и безработица в 1930-е годы». Журнал экономических перспектив 7.2 (1993): 41–59. онлайн
- Стрикер, Фрэнк. Безработица в Америке: прошлое, настоящее и будущее (University of Illinois Press, 2020) онлайн-обзор
- Сандстрем, Уильям А. «Последний нанятый, первый уволенный? Безработица и чернокожие городские рабочие во время Великой депрессии». Журнал экономической истории (1992): 415–429. онлайн
- Темин, Петр. «Социализм и заработная плата в период восстановления после Великой депрессии в США и Германии». Журнал экономической истории (1990): 297–307 онлайн .
Внешние ссылки
[ редактировать ]![]() Цитаты о безработице в Wikiquote
Цитаты о безработице в Wikiquote
![]() Словарное определение безработицы в Викисловаре
Словарное определение безработицы в Викисловаре
 СМИ, связанные с безработицей, на Викискладе?
 - Институт экономической политики
- Текущие показатели безработицы , данные CEIC
- Текущий уровень безработицы по странам
- Статистика ОЭСР по безработице
- Статистика безработицы по Ливанскому экономическому форуму, данные Всемирного банка.
- JobCity — подходящая платформа для государственных вакансий
- Термальные карты процентного уровня безработицы в мире по странам, 2007–2010 гг.